Cities with the Most Immigrants from Eastern Europe in Pennsylvania
RELATED REPORTS & OPTIONS
Eastern Europe
Pennsylvania
Compare Cities
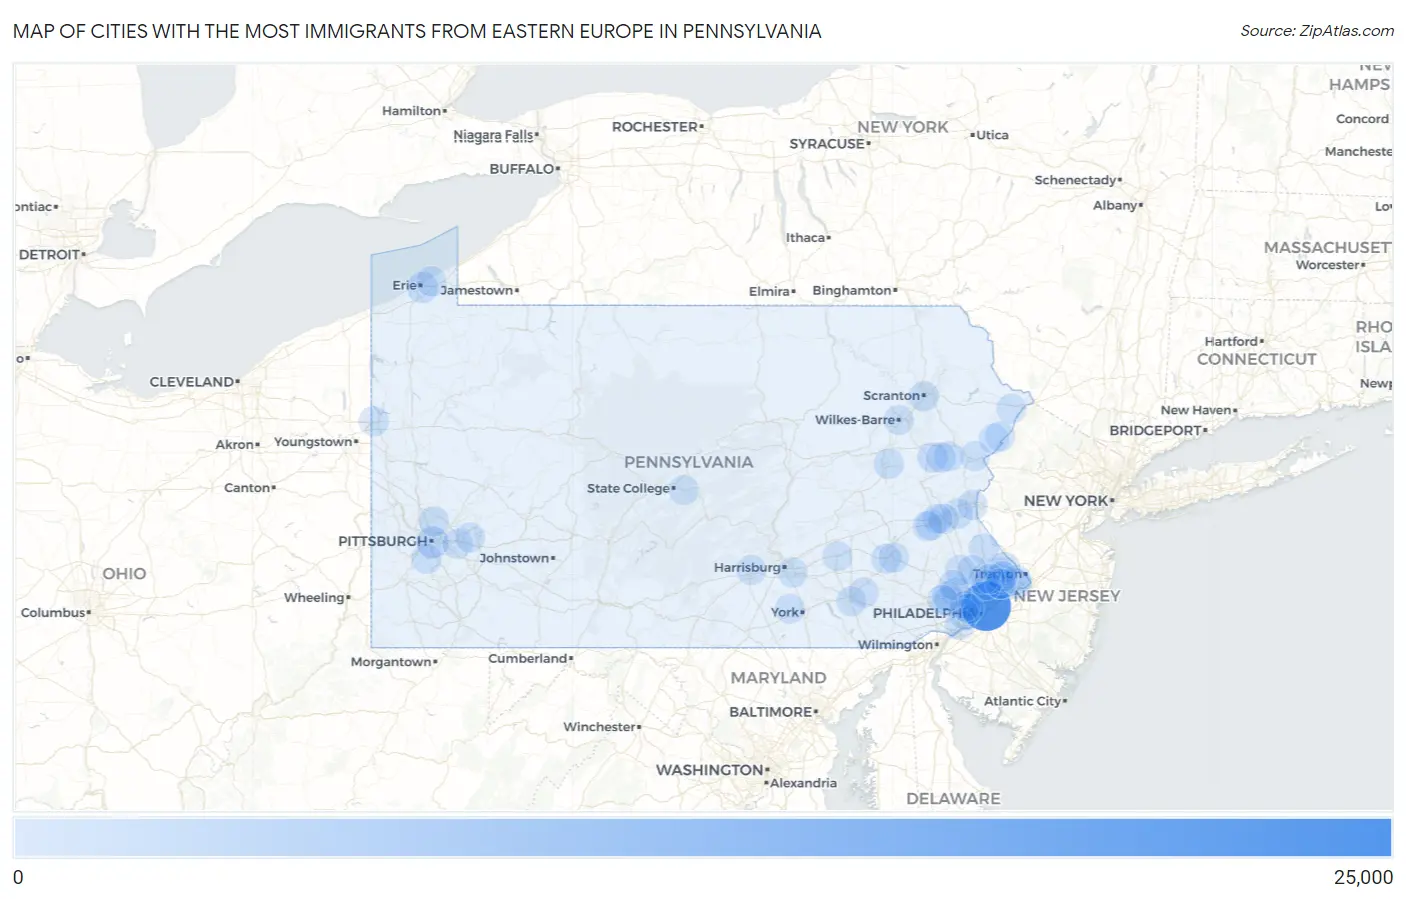
Map of Cities with the Most Immigrants from Eastern Europe in Pennsylvania
0
25,000
Cities with the Most Immigrants from Eastern Europe in Pennsylvania
| City | Eastern Europe | vs State | vs National | |
| 1. | Philadelphia | 22,777 | 84,280(27.03%)#1 | 2,208,794(1.03%)#4 |
| 2. | Pittsburgh | 2,503 | 84,280(2.97%)#2 | 2,208,794(0.11%)#82 |
| 3. | Erie | 1,309 | 84,280(1.55%)#3 | 2,208,794(0.06%)#216 |
| 4. | Levittown | 663 | 84,280(0.79%)#4 | 2,208,794(0.03%)#471 |
| 5. | Ephrata Borough | 515 | 84,280(0.61%)#5 | 2,208,794(0.02%)#603 |
| 6. | State College Borough | 488 | 84,280(0.58%)#6 | 2,208,794(0.02%)#638 |
| 7. | Churchville | 465 | 84,280(0.55%)#7 | 2,208,794(0.02%)#668 |
| 8. | Scranton | 404 | 84,280(0.48%)#8 | 2,208,794(0.02%)#753 |
| 9. | Morrisville Borough | 404 | 84,280(0.48%)#9 | 2,208,794(0.02%)#755 |
| 10. | Carlisle Borough | 377 | 84,280(0.45%)#10 | 2,208,794(0.02%)#800 |
| 11. | Bethlehem | 340 | 84,280(0.40%)#11 | 2,208,794(0.02%)#883 |
| 12. | Richboro | 313 | 84,280(0.37%)#12 | 2,208,794(0.01%)#976 |
| 13. | Trexlertown | 309 | 84,280(0.37%)#13 | 2,208,794(0.01%)#988 |
| 14. | Hazleton | 298 | 84,280(0.35%)#14 | 2,208,794(0.01%)#1,020 |
| 15. | Allentown | 265 | 84,280(0.31%)#15 | 2,208,794(0.01%)#1,132 |
| 16. | Newtown Grant | 263 | 84,280(0.31%)#16 | 2,208,794(0.01%)#1,139 |
| 17. | Trevose | 259 | 84,280(0.31%)#17 | 2,208,794(0.01%)#1,158 |
| 18. | King Of Prussia | 247 | 84,280(0.29%)#18 | 2,208,794(0.01%)#1,194 |
| 19. | Woodlyn | 242 | 84,280(0.29%)#19 | 2,208,794(0.01%)#1,221 |
| 20. | Baldwin Borough | 232 | 84,280(0.28%)#20 | 2,208,794(0.01%)#1,254 |
| 21. | Trappe Borough | 226 | 84,280(0.27%)#21 | 2,208,794(0.01%)#1,290 |
| 22. | Allison Park | 221 | 84,280(0.26%)#22 | 2,208,794(0.01%)#1,309 |
| 23. | Drexel Hill | 214 | 84,280(0.25%)#23 | 2,208,794(0.01%)#1,344 |
| 24. | Towamensing Trails | 207 | 84,280(0.25%)#24 | 2,208,794(0.01%)#1,384 |
| 25. | Easton | 199 | 84,280(0.24%)#25 | 2,208,794(0.01%)#1,430 |
| 26. | Lansdale Borough | 199 | 84,280(0.24%)#26 | 2,208,794(0.01%)#1,431 |
| 27. | Mont Clare | 197 | 84,280(0.23%)#27 | 2,208,794(0.01%)#1,446 |
| 28. | Feasterville | 192 | 84,280(0.23%)#28 | 2,208,794(0.01%)#1,463 |
| 29. | Kulpsville | 188 | 84,280(0.22%)#29 | 2,208,794(0.01%)#1,477 |
| 30. | Norristown Borough | 187 | 84,280(0.22%)#30 | 2,208,794(0.01%)#1,482 |
| 31. | Plumsteadville | 183 | 84,280(0.22%)#31 | 2,208,794(0.01%)#1,510 |
| 32. | West Wyomissing | 182 | 84,280(0.22%)#32 | 2,208,794(0.01%)#1,516 |
| 33. | Monroeville | 179 | 84,280(0.21%)#33 | 2,208,794(0.01%)#1,529 |
| 34. | Bala Cynwyd | 174 | 84,280(0.21%)#34 | 2,208,794(0.01%)#1,561 |
| 35. | Village Shires | 168 | 84,280(0.20%)#35 | 2,208,794(0.01%)#1,602 |
| 36. | East Stroudsburg Borough | 164 | 84,280(0.19%)#36 | 2,208,794(0.01%)#1,635 |
| 37. | Arlington Heights | 162 | 84,280(0.19%)#37 | 2,208,794(0.01%)#1,646 |
| 38. | Leola | 161 | 84,280(0.19%)#38 | 2,208,794(0.01%)#1,655 |
| 39. | Bethel Park | 160 | 84,280(0.19%)#39 | 2,208,794(0.01%)#1,660 |
| 40. | Wind Gap Borough | 159 | 84,280(0.19%)#40 | 2,208,794(0.01%)#1,671 |
| 41. | Fairless Hills | 157 | 84,280(0.19%)#41 | 2,208,794(0.01%)#1,693 |
| 42. | Saw Creek | 156 | 84,280(0.19%)#42 | 2,208,794(0.01%)#1,702 |
| 43. | Reading | 155 | 84,280(0.18%)#43 | 2,208,794(0.01%)#1,704 |
| 44. | Sierra View | 151 | 84,280(0.18%)#44 | 2,208,794(0.01%)#1,744 |
| 45. | Mckinley | 150 | 84,280(0.18%)#45 | 2,208,794(0.01%)#1,754 |
| 46. | Kingston Borough | 148 | 84,280(0.18%)#46 | 2,208,794(0.01%)#1,774 |
| 47. | Penndel Borough | 147 | 84,280(0.17%)#47 | 2,208,794(0.01%)#1,788 |
| 48. | Berwyn | 144 | 84,280(0.17%)#48 | 2,208,794(0.01%)#1,819 |
| 49. | Chesterbrook | 143 | 84,280(0.17%)#49 | 2,208,794(0.01%)#1,830 |
| 50. | Ardmore | 140 | 84,280(0.17%)#50 | 2,208,794(0.01%)#1,858 |
| 51. | Honesdale Borough | 138 | 84,280(0.16%)#51 | 2,208,794(0.01%)#1,883 |
| 52. | Wayne | 137 | 84,280(0.16%)#52 | 2,208,794(0.01%)#1,890 |
| 53. | Murrysville | 136 | 84,280(0.16%)#53 | 2,208,794(0.01%)#1,896 |
| 54. | Horsham | 136 | 84,280(0.16%)#54 | 2,208,794(0.01%)#1,897 |
| 55. | Boalsburg | 135 | 84,280(0.16%)#55 | 2,208,794(0.01%)#1,913 |
| 56. | Sharon | 130 | 84,280(0.15%)#56 | 2,208,794(0.01%)#1,947 |
| 57. | Willow Grove | 128 | 84,280(0.15%)#57 | 2,208,794(0.01%)#1,961 |
| 58. | Wilkes Barre | 127 | 84,280(0.15%)#58 | 2,208,794(0.01%)#1,964 |
| 59. | Warminster Heights | 127 | 84,280(0.15%)#59 | 2,208,794(0.01%)#1,973 |
| 60. | Edwardsville Borough | 124 | 84,280(0.15%)#60 | 2,208,794(0.01%)#2,005 |
| 61. | Lebanon | 123 | 84,280(0.15%)#61 | 2,208,794(0.01%)#2,011 |
| 62. | Doylestown Borough | 118 | 84,280(0.14%)#62 | 2,208,794(0.01%)#2,072 |
| 63. | Lancaster | 111 | 84,280(0.13%)#63 | 2,208,794(0.01%)#2,148 |
| 64. | Norwood Borough | 109 | 84,280(0.13%)#64 | 2,208,794(0.00%)#2,194 |
| 65. | Media Borough | 108 | 84,280(0.13%)#65 | 2,208,794(0.00%)#2,207 |
| 66. | Wyomissing Borough | 105 | 84,280(0.12%)#66 | 2,208,794(0.00%)#2,249 |
| 67. | Ridley Park Borough | 104 | 84,280(0.12%)#67 | 2,208,794(0.00%)#2,257 |
| 68. | Cetronia | 104 | 84,280(0.12%)#68 | 2,208,794(0.00%)#2,263 |
| 69. | Bressler | 104 | 84,280(0.12%)#69 | 2,208,794(0.00%)#2,264 |
| 70. | Homestead Borough | 103 | 84,280(0.12%)#70 | 2,208,794(0.00%)#2,272 |
| 71. | Montgomeryville | 102 | 84,280(0.12%)#71 | 2,208,794(0.00%)#2,278 |
| 72. | New Brighton Borough | 102 | 84,280(0.12%)#72 | 2,208,794(0.00%)#2,283 |
| 73. | Ivyland Borough | 102 | 84,280(0.12%)#73 | 2,208,794(0.00%)#2,285 |
| 74. | Trooper | 100 | 84,280(0.12%)#74 | 2,208,794(0.00%)#2,303 |
| 75. | Roslyn | 98 | 84,280(0.12%)#75 | 2,208,794(0.00%)#2,327 |
| 76. | Pocono Woodland Lakes | 93 | 84,280(0.11%)#76 | 2,208,794(0.00%)#2,412 |
| 77. | Middletown Borough | 92 | 84,280(0.11%)#77 | 2,208,794(0.00%)#2,424 |
| 78. | Villanova | 86 | 84,280(0.10%)#78 | 2,208,794(0.00%)#2,520 |
| 79. | Jenkintown Borough | 86 | 84,280(0.10%)#79 | 2,208,794(0.00%)#2,524 |
| 80. | Manchester Borough | 86 | 84,280(0.10%)#80 | 2,208,794(0.00%)#2,526 |
| 81. | Phoenixville Borough | 85 | 84,280(0.10%)#81 | 2,208,794(0.00%)#2,538 |
| 82. | New Freedom Borough | 84 | 84,280(0.10%)#82 | 2,208,794(0.00%)#2,561 |
| 83. | Northwest Harborcreek | 83 | 84,280(0.10%)#83 | 2,208,794(0.00%)#2,586 |
| 84. | Merion Station | 82 | 84,280(0.10%)#84 | 2,208,794(0.00%)#2,609 |
| 85. | Elkins Park | 80 | 84,280(0.09%)#85 | 2,208,794(0.00%)#2,643 |
| 86. | Kutztown Borough | 80 | 84,280(0.09%)#86 | 2,208,794(0.00%)#2,646 |
| 87. | Pine Ridge | 80 | 84,280(0.09%)#87 | 2,208,794(0.00%)#2,651 |
| 88. | Dillsburg Borough | 80 | 84,280(0.09%)#88 | 2,208,794(0.00%)#2,653 |
| 89. | Weigelstown | 78 | 84,280(0.09%)#89 | 2,208,794(0.00%)#2,680 |
| 90. | Breinigsville | 78 | 84,280(0.09%)#90 | 2,208,794(0.00%)#2,684 |
| 91. | Telford Borough | 77 | 84,280(0.09%)#91 | 2,208,794(0.00%)#2,713 |
| 92. | Indian Mountain Lake | 76 | 84,280(0.09%)#92 | 2,208,794(0.00%)#2,732 |
| 93. | Castle Shannon Borough | 75 | 84,280(0.09%)#93 | 2,208,794(0.00%)#2,753 |
| 94. | Chalfont Borough | 75 | 84,280(0.09%)#94 | 2,208,794(0.00%)#2,760 |
| 95. | Penn Wynne | 73 | 84,280(0.09%)#95 | 2,208,794(0.00%)#2,787 |
| 96. | Green Tree Borough | 73 | 84,280(0.09%)#96 | 2,208,794(0.00%)#2,790 |
| 97. | Paoli | 72 | 84,280(0.09%)#97 | 2,208,794(0.00%)#2,810 |
| 98. | Schlusser | 72 | 84,280(0.09%)#98 | 2,208,794(0.00%)#2,811 |
| 99. | Sayre Borough | 72 | 84,280(0.09%)#99 | 2,208,794(0.00%)#2,812 |
| 100. | Malvern Borough | 71 | 84,280(0.08%)#100 | 2,208,794(0.00%)#2,842 |
Common Questions
What are the Top 10 Cities with the Most Immigrants from Eastern Europe in Pennsylvania?
Top 10 Cities with the Most Immigrants from Eastern Europe in Pennsylvania are:
#1
22,777
#2
2,503
#3
1,309
#4
663
#5
465
#6
404
#7
340
#8
313
#9
309
#10
298
What city has the Most Immigrants from Eastern Europe in Pennsylvania?
Philadelphia has the Most Immigrants from Eastern Europe in Pennsylvania with 22,777.
What is the Total Immigrants from Eastern Europe in the State of Pennsylvania?
Total Immigrants from Eastern Europe in Pennsylvania is 84,280.
What is the Total Immigrants from Eastern Europe in the United States?
Total Immigrants from Eastern Europe in the United States is 2,208,794.