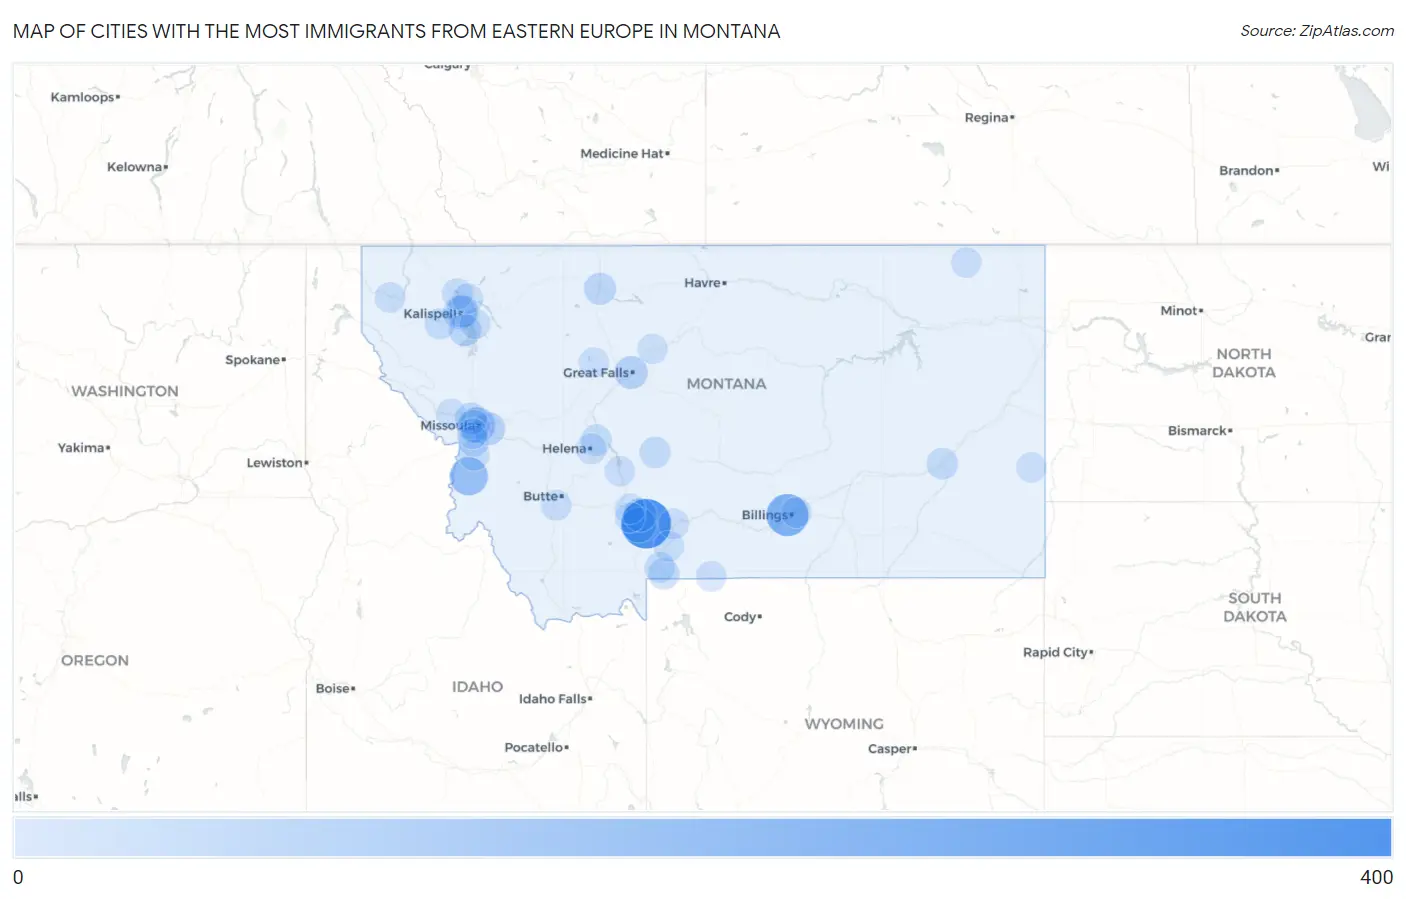
Cities with the Most Immigrants from Eastern Europe in Montana
RELATED REPORTS & OPTIONS
Eastern Europe
Montana
Compare Cities
Map of Cities with the Most Immigrants from Eastern Europe in Montana
0
400
Cities with the Most Immigrants from Eastern Europe in Montana
| City | Eastern Europe | vs State | vs National | |
| 1. | Bozeman | 386 | 2,553(15.12%)#1 | 2,208,794(0.02%)#782 |
| 2. | Billings | 233 | 2,553(9.13%)#2 | 2,208,794(0.01%)#1,249 |
| 3. | Hamilton | 157 | 2,553(6.15%)#3 | 2,208,794(0.01%)#1,694 |
| 4. | Missoula | 103 | 2,553(4.03%)#4 | 2,208,794(0.00%)#2,265 |
| 5. | Four Corners | 97 | 2,553(3.80%)#5 | 2,208,794(0.00%)#2,348 |
| 6. | Belgrade | 63 | 2,553(2.47%)#6 | 2,208,794(0.00%)#2,993 |
| 7. | Kalispell | 61 | 2,553(2.39%)#7 | 2,208,794(0.00%)#3,029 |
| 8. | Great Falls | 55 | 2,553(2.15%)#8 | 2,208,794(0.00%)#3,186 |
| 9. | Turah | 54 | 2,553(2.12%)#9 | 2,208,794(0.00%)#3,242 |
| 10. | Orchard Homes | 44 | 2,553(1.72%)#10 | 2,208,794(0.00%)#3,580 |
| 11. | Evergreen | 42 | 2,553(1.65%)#11 | 2,208,794(0.00%)#3,663 |
| 12. | Lakeside | 42 | 2,553(1.65%)#12 | 2,208,794(0.00%)#3,679 |
| 13. | Shelby | 37 | 2,553(1.45%)#13 | 2,208,794(0.00%)#3,898 |
| 14. | Wye | 37 | 2,553(1.45%)#14 | 2,208,794(0.00%)#3,909 |
| 15. | Miles City | 28 | 2,553(1.10%)#15 | 2,208,794(0.00%)#4,335 |
| 16. | White Sulphur Springs | 23 | 2,553(0.90%)#16 | 2,208,794(0.00%)#4,715 |
| 17. | Gardiner | 23 | 2,553(0.90%)#17 | 2,208,794(0.00%)#4,718 |
| 18. | Helena Valley Northeast | 20 | 2,553(0.78%)#18 | 2,208,794(0.00%)#4,919 |
| 19. | Stevensville | 18 | 2,553(0.71%)#19 | 2,208,794(0.00%)#5,147 |
| 20. | Marion | 18 | 2,553(0.71%)#20 | 2,208,794(0.00%)#5,154 |
| 21. | Carlton | 17 | 2,553(0.67%)#21 | 2,208,794(0.00%)#5,277 |
| 22. | Butte Silver Bow Balance | 15 | 2,553(0.59%)#22 | 2,208,794(0.00%)#5,399 |
| 23. | Bigfork | 13 | 2,553(0.51%)#23 | 2,208,794(0.00%)#5,716 |
| 24. | Corwin Springs | 13 | 2,553(0.51%)#24 | 2,208,794(0.00%)#5,785 |
| 25. | Helena | 12 | 2,553(0.47%)#25 | 2,208,794(0.00%)#5,792 |
| 26. | Whitefish | 12 | 2,553(0.47%)#26 | 2,208,794(0.00%)#5,824 |
| 27. | Lockwood | 10 | 2,553(0.39%)#27 | 2,208,794(0.00%)#6,128 |
| 28. | Columbia Falls | 10 | 2,553(0.39%)#28 | 2,208,794(0.00%)#6,138 |
| 29. | Libby | 10 | 2,553(0.39%)#29 | 2,208,794(0.00%)#6,175 |
| 30. | Pray | 10 | 2,553(0.39%)#30 | 2,208,794(0.00%)#6,225 |
| 31. | Livingston | 8 | 2,553(0.31%)#31 | 2,208,794(0.00%)#6,444 |
| 32. | Townsend | 8 | 2,553(0.31%)#32 | 2,208,794(0.00%)#6,503 |
| 33. | Manhattan | 8 | 2,553(0.31%)#33 | 2,208,794(0.00%)#6,511 |
| 34. | Cooke City | 7 | 2,553(0.27%)#34 | 2,208,794(0.00%)#6,788 |
| 35. | Lolo | 6 | 2,553(0.24%)#35 | 2,208,794(0.00%)#6,833 |
| 36. | Scobey | 5 | 2,553(0.20%)#36 | 2,208,794(0.00%)#7,147 |
| 37. | Fairfield | 5 | 2,553(0.20%)#37 | 2,208,794(0.00%)#7,152 |
| 38. | Alberton | 3 | 2,553(0.12%)#38 | 2,208,794(0.00%)#7,590 |
| 39. | Carter | 3 | 2,553(0.12%)#39 | 2,208,794(0.00%)#7,640 |
| 40. | Baker | 1 | 2,553(0.04%)#40 | 2,208,794(0.00%)#7,980 |
| 41. | Amsterdam | 1 | 2,553(0.04%)#41 | 2,208,794(0.00%)#8,099 |
Common Questions
What are the Top 10 Cities with the Most Immigrants from Eastern Europe in Montana?
Top 10 Cities with the Most Immigrants from Eastern Europe in Montana are:
#1
386
#2
233
#3
157
#4
103
#5
97
#6
63
#7
61
#8
55
#9
54
#10
44
What city has the Most Immigrants from Eastern Europe in Montana?
Bozeman has the Most Immigrants from Eastern Europe in Montana with 386.
What is the Total Immigrants from Eastern Europe in the State of Montana?
Total Immigrants from Eastern Europe in Montana is 2,553.
What is the Total Immigrants from Eastern Europe in the United States?
Total Immigrants from Eastern Europe in the United States is 2,208,794.