Cities with the Most Immigrants from Eastern Europe in Kentucky
RELATED REPORTS & OPTIONS
Eastern Europe
Kentucky
Compare Cities
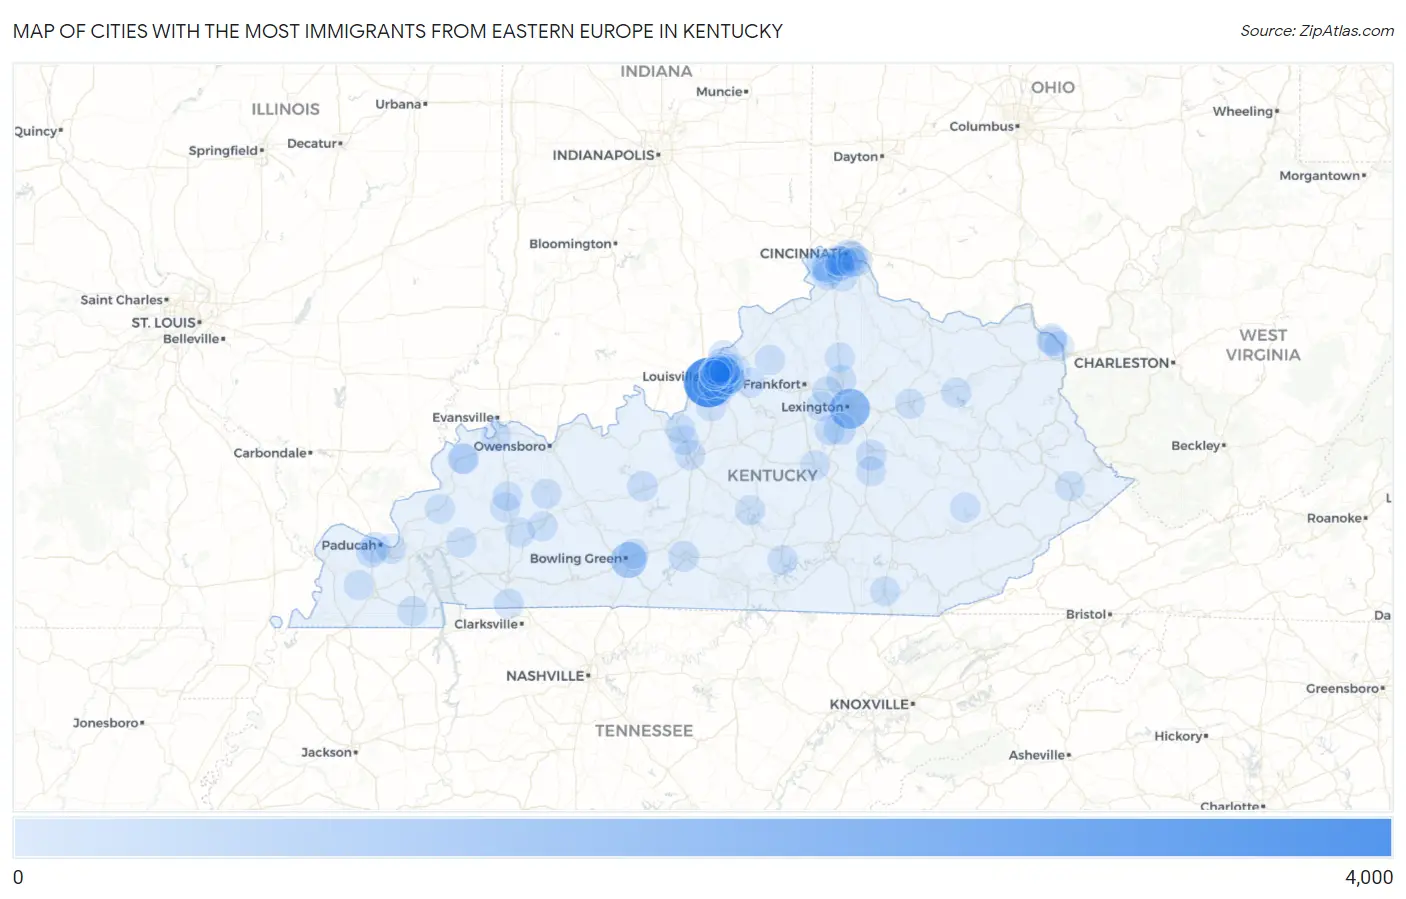
Map of Cities with the Most Immigrants from Eastern Europe in Kentucky
0
4,000
Cities with the Most Immigrants from Eastern Europe in Kentucky
| City | Eastern Europe | vs State | vs National | |
| 1. | Louisville | 3,196 | 10,366(30.83%)#1 | 2,208,794(0.14%)#59 |
| 2. | Lexington | 1,550 | 10,366(14.95%)#2 | 2,208,794(0.07%)#178 |
| 3. | Bowling Green | 911 | 10,366(8.79%)#3 | 2,208,794(0.04%)#340 |
| 4. | Nicholasville | 288 | 10,366(2.78%)#4 | 2,208,794(0.01%)#1,045 |
| 5. | Jeffersontown | 278 | 10,366(2.68%)#5 | 2,208,794(0.01%)#1,082 |
| 6. | Florence | 191 | 10,366(1.84%)#6 | 2,208,794(0.01%)#1,465 |
| 7. | Burlington | 172 | 10,366(1.66%)#7 | 2,208,794(0.01%)#1,573 |
| 8. | Glasgow | 124 | 10,366(1.20%)#8 | 2,208,794(0.01%)#2,003 |
| 9. | Richmond | 115 | 10,366(1.11%)#9 | 2,208,794(0.01%)#2,103 |
| 10. | Newport | 108 | 10,366(1.04%)#10 | 2,208,794(0.00%)#2,205 |
| 11. | Covington | 68 | 10,366(0.66%)#11 | 2,208,794(0.00%)#2,880 |
| 12. | Leitchfield | 66 | 10,366(0.64%)#12 | 2,208,794(0.00%)#2,942 |
| 13. | Elizabethtown | 63 | 10,366(0.61%)#13 | 2,208,794(0.00%)#2,980 |
| 14. | Independence | 63 | 10,366(0.61%)#14 | 2,208,794(0.00%)#2,982 |
| 15. | Wilmore | 60 | 10,366(0.58%)#15 | 2,208,794(0.00%)#3,064 |
| 16. | Houston Acres | 56 | 10,366(0.54%)#16 | 2,208,794(0.00%)#3,183 |
| 17. | Henderson | 47 | 10,366(0.45%)#17 | 2,208,794(0.00%)#3,456 |
| 18. | Paducah | 45 | 10,366(0.43%)#18 | 2,208,794(0.00%)#3,532 |
| 19. | Prospect | 40 | 10,366(0.39%)#19 | 2,208,794(0.00%)#3,763 |
| 20. | Murray | 35 | 10,366(0.34%)#20 | 2,208,794(0.00%)#3,953 |
| 21. | Fort Campbell North | 34 | 10,366(0.33%)#21 | 2,208,794(0.00%)#4,008 |
| 22. | Fort Thomas | 31 | 10,366(0.30%)#22 | 2,208,794(0.00%)#4,160 |
| 23. | Union | 27 | 10,366(0.26%)#23 | 2,208,794(0.00%)#4,397 |
| 24. | Massac | 27 | 10,366(0.26%)#24 | 2,208,794(0.00%)#4,404 |
| 25. | Oakbrook | 26 | 10,366(0.25%)#25 | 2,208,794(0.00%)#4,453 |
| 26. | Fort Wright | 25 | 10,366(0.24%)#26 | 2,208,794(0.00%)#4,531 |
| 27. | Douglass Hills | 25 | 10,366(0.24%)#27 | 2,208,794(0.00%)#4,532 |
| 28. | Middletown | 23 | 10,366(0.22%)#28 | 2,208,794(0.00%)#4,662 |
| 29. | Marion | 23 | 10,366(0.22%)#29 | 2,208,794(0.00%)#4,703 |
| 30. | Greenville | 22 | 10,366(0.21%)#30 | 2,208,794(0.00%)#4,758 |
| 31. | Crescent Springs | 22 | 10,366(0.21%)#31 | 2,208,794(0.00%)#4,760 |
| 32. | Morganfield | 19 | 10,366(0.18%)#32 | 2,208,794(0.00%)#5,011 |
| 33. | Radcliff | 17 | 10,366(0.16%)#33 | 2,208,794(0.00%)#5,177 |
| 34. | Silver Grove | 17 | 10,366(0.16%)#34 | 2,208,794(0.00%)#5,265 |
| 35. | Berea | 16 | 10,366(0.15%)#35 | 2,208,794(0.00%)#5,298 |
| 36. | Georgetown | 15 | 10,366(0.14%)#36 | 2,208,794(0.00%)#5,397 |
| 37. | Hurstbourne Acres | 15 | 10,366(0.14%)#37 | 2,208,794(0.00%)#5,481 |
| 38. | Edgewood | 14 | 10,366(0.14%)#38 | 2,208,794(0.00%)#5,555 |
| 39. | Mount Sterling | 13 | 10,366(0.13%)#39 | 2,208,794(0.00%)#5,700 |
| 40. | Plantation | 13 | 10,366(0.13%)#40 | 2,208,794(0.00%)#5,776 |
| 41. | Princeton | 12 | 10,366(0.12%)#41 | 2,208,794(0.00%)#5,833 |
| 42. | West Buechel | 12 | 10,366(0.12%)#42 | 2,208,794(0.00%)#5,884 |
| 43. | Breckinridge Center | 12 | 10,366(0.12%)#43 | 2,208,794(0.00%)#5,889 |
| 44. | Langdon Place | 12 | 10,366(0.12%)#44 | 2,208,794(0.00%)#5,905 |
| 45. | Madisonville | 11 | 10,366(0.11%)#45 | 2,208,794(0.00%)#5,929 |
| 46. | Fort Mitchell | 11 | 10,366(0.11%)#46 | 2,208,794(0.00%)#5,956 |
| 47. | Russell | 11 | 10,366(0.11%)#47 | 2,208,794(0.00%)#6,004 |
| 48. | Midway | 10 | 10,366(0.10%)#48 | 2,208,794(0.00%)#6,195 |
| 49. | Ashland | 9 | 10,366(0.09%)#49 | 2,208,794(0.00%)#6,257 |
| 50. | Pikeville | 9 | 10,366(0.09%)#50 | 2,208,794(0.00%)#6,286 |
| 51. | Spring Valley | 9 | 10,366(0.09%)#51 | 2,208,794(0.00%)#6,383 |
| 52. | Fancy Farm | 9 | 10,366(0.09%)#52 | 2,208,794(0.00%)#6,406 |
| 53. | Versailles | 8 | 10,366(0.08%)#53 | 2,208,794(0.00%)#6,436 |
| 54. | Eminence | 8 | 10,366(0.08%)#54 | 2,208,794(0.00%)#6,488 |
| 55. | Jamestown | 8 | 10,366(0.08%)#55 | 2,208,794(0.00%)#6,494 |
| 56. | Farmers | 8 | 10,366(0.08%)#56 | 2,208,794(0.00%)#6,586 |
| 57. | St Matthews | 7 | 10,366(0.07%)#57 | 2,208,794(0.00%)#6,602 |
| 58. | Highland Heights | 7 | 10,366(0.07%)#58 | 2,208,794(0.00%)#6,624 |
| 59. | Pewee Valley | 7 | 10,366(0.07%)#59 | 2,208,794(0.00%)#6,723 |
| 60. | Old Brownsboro Place | 7 | 10,366(0.07%)#60 | 2,208,794(0.00%)#6,773 |
| 61. | Simpsonville | 6 | 10,366(0.06%)#61 | 2,208,794(0.00%)#6,848 |
| 62. | Anchorage | 6 | 10,366(0.06%)#62 | 2,208,794(0.00%)#6,868 |
| 63. | Hanson | 6 | 10,366(0.06%)#63 | 2,208,794(0.00%)#6,942 |
| 64. | Buckhorn | 6 | 10,366(0.06%)#64 | 2,208,794(0.00%)#6,983 |
| 65. | Fort Knox | 5 | 10,366(0.05%)#65 | 2,208,794(0.00%)#7,006 |
| 66. | Indian Hills | 5 | 10,366(0.05%)#66 | 2,208,794(0.00%)#7,039 |
| 67. | Goshen | 5 | 10,366(0.05%)#67 | 2,208,794(0.00%)#7,126 |
| 68. | White Plains | 5 | 10,366(0.05%)#68 | 2,208,794(0.00%)#7,128 |
| 69. | Blue Ridge Manor | 5 | 10,366(0.05%)#69 | 2,208,794(0.00%)#7,141 |
| 70. | Fox Chase | 5 | 10,366(0.05%)#70 | 2,208,794(0.00%)#7,162 |
| 71. | Williamsburg | 4 | 10,366(0.04%)#71 | 2,208,794(0.00%)#7,222 |
| 72. | Ledbetter | 4 | 10,366(0.04%)#72 | 2,208,794(0.00%)#7,266 |
| 73. | Hollow Creek | 4 | 10,366(0.04%)#73 | 2,208,794(0.00%)#7,348 |
| 74. | Plum Springs | 4 | 10,366(0.04%)#74 | 2,208,794(0.00%)#7,372 |
| 75. | Forest Hills | 4 | 10,366(0.04%)#75 | 2,208,794(0.00%)#7,373 |
| 76. | Danville | 3 | 10,366(0.03%)#76 | 2,208,794(0.00%)#7,406 |
| 77. | Audubon Park | 3 | 10,366(0.03%)#77 | 2,208,794(0.00%)#7,484 |
| 78. | Bellefonte | 3 | 10,366(0.03%)#78 | 2,208,794(0.00%)#7,506 |
| 79. | Bellemeade | 3 | 10,366(0.03%)#79 | 2,208,794(0.00%)#7,537 |
| 80. | Woodland Hills | 3 | 10,366(0.03%)#80 | 2,208,794(0.00%)#7,578 |
| 81. | Wellington | 3 | 10,366(0.03%)#81 | 2,208,794(0.00%)#7,601 |
| 82. | Campbellsville | 2 | 10,366(0.02%)#82 | 2,208,794(0.00%)#7,652 |
| 83. | Northfield | 2 | 10,366(0.02%)#83 | 2,208,794(0.00%)#7,735 |
| 84. | Meadow Vale | 2 | 10,366(0.02%)#84 | 2,208,794(0.00%)#7,758 |
| 85. | Island | 2 | 10,366(0.02%)#85 | 2,208,794(0.00%)#7,807 |
| 86. | Fincastle | 2 | 10,366(0.02%)#86 | 2,208,794(0.00%)#7,810 |
| 87. | Riverwood | 2 | 10,366(0.02%)#87 | 2,208,794(0.00%)#7,830 |
| 88. | Brownsboro Village | 2 | 10,366(0.02%)#88 | 2,208,794(0.00%)#7,870 |
| 89. | Thornhill | 2 | 10,366(0.02%)#89 | 2,208,794(0.00%)#7,911 |
| 90. | Green Spring | 1 | 10,366(0.01%)#90 | 2,208,794(0.00%)#8,019 |
| 91. | Creekside | 1 | 10,366(0.01%)#91 | 2,208,794(0.00%)#8,056 |
| 92. | Glenview Hills | 1 | 10,366(0.01%)#92 | 2,208,794(0.00%)#8,060 |
| 93. | Sadieville | 1 | 10,366(0.01%)#93 | 2,208,794(0.00%)#8,067 |
| 94. | Bellewood | 1 | 10,366(0.01%)#94 | 2,208,794(0.00%)#8,083 |
Common Questions
What are the Top 10 Cities with the Most Immigrants from Eastern Europe in Kentucky?
Top 10 Cities with the Most Immigrants from Eastern Europe in Kentucky are:
#1
3,196
#2
1,550
#3
911
#4
288
#5
278
#6
191
#7
172
#8
124
#9
115
#10
108
What city has the Most Immigrants from Eastern Europe in Kentucky?
Louisville has the Most Immigrants from Eastern Europe in Kentucky with 3,196.
What is the Total Immigrants from Eastern Europe in the State of Kentucky?
Total Immigrants from Eastern Europe in Kentucky is 10,366.
What is the Total Immigrants from Eastern Europe in the United States?
Total Immigrants from Eastern Europe in the United States is 2,208,794.