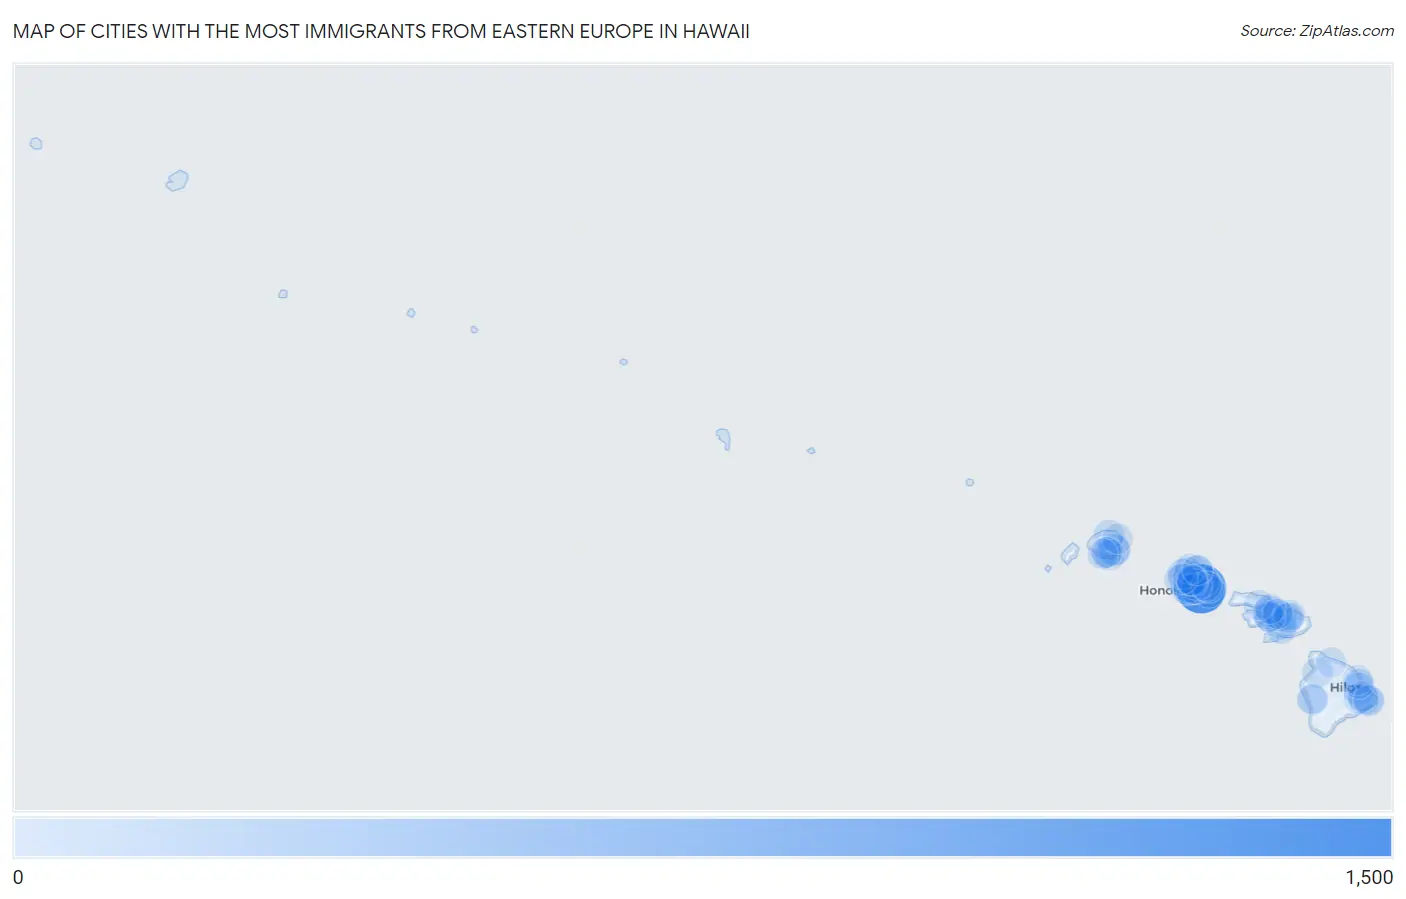
Cities with the Most Immigrants from Eastern Europe in Hawaii
RELATED REPORTS & OPTIONS
Eastern Europe
Hawaii
Compare Cities
Map of Cities with the Most Immigrants from Eastern Europe in Hawaii
0
1,500
Cities with the Most Immigrants from Eastern Europe in Hawaii
| City | Eastern Europe | vs State | vs National | |
| 1. | Urban Honolulu | 1,094 | 3,409(32.09%)#1 | 2,208,794(0.05%)#267 |
| 2. | Kaiminani | 177 | 3,409(5.19%)#2 | 2,208,794(0.01%)#1,541 |
| 3. | Kailua Cdp Hawaii County | 160 | 3,409(4.69%)#3 | 2,208,794(0.01%)#1,661 |
| 4. | Kaneohe | 156 | 3,409(4.58%)#4 | 2,208,794(0.01%)#1,699 |
| 5. | East Honolulu | 145 | 3,409(4.25%)#5 | 2,208,794(0.01%)#1,797 |
| 6. | Kailua Cdp Honolulu County | 145 | 3,409(4.25%)#6 | 2,208,794(0.01%)#1,798 |
| 7. | Kahaluu | 145 | 3,409(4.25%)#7 | 2,208,794(0.01%)#1,807 |
| 8. | Hilo | 104 | 3,409(3.05%)#8 | 2,208,794(0.00%)#2,254 |
| 9. | Kaloko | 85 | 3,409(2.49%)#9 | 2,208,794(0.00%)#2,548 |
| 10. | Puhi | 76 | 3,409(2.23%)#10 | 2,208,794(0.00%)#2,733 |
| 11. | Kihei | 66 | 3,409(1.94%)#11 | 2,208,794(0.00%)#2,929 |
| 12. | Makaha | 56 | 3,409(1.64%)#12 | 2,208,794(0.00%)#3,171 |
| 13. | Kapolei | 52 | 3,409(1.53%)#13 | 2,208,794(0.00%)#3,285 |
| 14. | Wailuku | 50 | 3,409(1.47%)#14 | 2,208,794(0.00%)#3,357 |
| 15. | Makakilo | 49 | 3,409(1.44%)#15 | 2,208,794(0.00%)#3,387 |
| 16. | Hauula | 48 | 3,409(1.41%)#16 | 2,208,794(0.00%)#3,447 |
| 17. | Schofield Barracks | 46 | 3,409(1.35%)#17 | 2,208,794(0.00%)#3,492 |
| 18. | Ko Olina | 42 | 3,409(1.23%)#18 | 2,208,794(0.00%)#3,683 |
| 19. | Mililani Mauka | 40 | 3,409(1.17%)#19 | 2,208,794(0.00%)#3,741 |
| 20. | Ainaloa | 35 | 3,409(1.03%)#20 | 2,208,794(0.00%)#3,978 |
| 21. | Lihue | 29 | 3,409(0.85%)#21 | 2,208,794(0.00%)#4,279 |
| 22. | Princeville | 28 | 3,409(0.82%)#22 | 2,208,794(0.00%)#4,368 |
| 23. | Kaneohe Base | 24 | 3,409(0.70%)#23 | 2,208,794(0.00%)#4,587 |
| 24. | Aiea | 24 | 3,409(0.70%)#24 | 2,208,794(0.00%)#4,594 |
| 25. | Wailea | 24 | 3,409(0.70%)#25 | 2,208,794(0.00%)#4,604 |
| 26. | Haleiwa | 24 | 3,409(0.70%)#26 | 2,208,794(0.00%)#4,616 |
| 27. | Leilani Estates | 24 | 3,409(0.70%)#27 | 2,208,794(0.00%)#4,632 |
| 28. | Mahinahina | 24 | 3,409(0.70%)#28 | 2,208,794(0.00%)#4,635 |
| 29. | Waimalu | 20 | 3,409(0.59%)#29 | 2,208,794(0.00%)#4,895 |
| 30. | Waipio Acres | 20 | 3,409(0.59%)#30 | 2,208,794(0.00%)#4,914 |
| 31. | Poipu | 20 | 3,409(0.59%)#31 | 2,208,794(0.00%)#4,949 |
| 32. | Ewa Gentry | 19 | 3,409(0.56%)#32 | 2,208,794(0.00%)#4,966 |
| 33. | Lawai | 19 | 3,409(0.56%)#33 | 2,208,794(0.00%)#5,014 |
| 34. | Kahului | 18 | 3,409(0.53%)#34 | 2,208,794(0.00%)#5,059 |
| 35. | Kaanapali | 18 | 3,409(0.53%)#35 | 2,208,794(0.00%)#5,153 |
| 36. | Kalaeloa | 17 | 3,409(0.50%)#36 | 2,208,794(0.00%)#5,233 |
| 37. | Hickam Housing | 16 | 3,409(0.47%)#37 | 2,208,794(0.00%)#5,318 |
| 38. | Kalaheo | 16 | 3,409(0.47%)#38 | 2,208,794(0.00%)#5,335 |
| 39. | Lahaina | 14 | 3,409(0.41%)#39 | 2,208,794(0.00%)#5,538 |
| 40. | Anahola | 14 | 3,409(0.41%)#40 | 2,208,794(0.00%)#5,602 |
| 41. | Fern Acres | 13 | 3,409(0.38%)#41 | 2,208,794(0.00%)#5,755 |
| 42. | Waipio | 11 | 3,409(0.32%)#42 | 2,208,794(0.00%)#5,949 |
| 43. | Eleele | 11 | 3,409(0.32%)#43 | 2,208,794(0.00%)#6,024 |
| 44. | Pukalani | 10 | 3,409(0.29%)#44 | 2,208,794(0.00%)#6,124 |
| 45. | Waikoloa Village | 10 | 3,409(0.29%)#45 | 2,208,794(0.00%)#6,127 |
| 46. | Iroquois Point | 9 | 3,409(0.26%)#46 | 2,208,794(0.00%)#6,296 |
| 47. | Waimanalo | 9 | 3,409(0.26%)#47 | 2,208,794(0.00%)#6,298 |
| 48. | Mokuleia | 9 | 3,409(0.26%)#48 | 2,208,794(0.00%)#6,354 |
| 49. | Haiku Pauwela | 8 | 3,409(0.23%)#49 | 2,208,794(0.00%)#6,439 |
| 50. | Pupukea | 8 | 3,409(0.23%)#50 | 2,208,794(0.00%)#6,459 |
| 51. | Mililani Town | 7 | 3,409(0.21%)#51 | 2,208,794(0.00%)#6,593 |
| 52. | Makawao | 7 | 3,409(0.21%)#52 | 2,208,794(0.00%)#6,621 |
| 53. | Captain Cook | 7 | 3,409(0.21%)#53 | 2,208,794(0.00%)#6,648 |
| 54. | Orchidlands Estates | 7 | 3,409(0.21%)#54 | 2,208,794(0.00%)#6,690 |
| 55. | Kealakekua | 7 | 3,409(0.21%)#55 | 2,208,794(0.00%)#6,697 |
| 56. | Nanawale Estates | 7 | 3,409(0.21%)#56 | 2,208,794(0.00%)#6,715 |
| 57. | Wheeler Afb | 6 | 3,409(0.18%)#57 | 2,208,794(0.00%)#6,876 |
| 58. | Waimea Cdp Hawaii County | 5 | 3,409(0.15%)#58 | 2,208,794(0.00%)#7,003 |
| 59. | Launiupoko | 4 | 3,409(0.12%)#59 | 2,208,794(0.00%)#7,352 |
| 60. | Maunawili | 3 | 3,409(0.09%)#60 | 2,208,794(0.00%)#7,445 |
| 61. | Pepeekeo | 3 | 3,409(0.09%)#61 | 2,208,794(0.00%)#7,477 |
| 62. | Makaha Valley | 3 | 3,409(0.09%)#62 | 2,208,794(0.00%)#7,630 |
| 63. | Ualapue | 2 | 3,409(0.06%)#63 | 2,208,794(0.00%)#7,837 |
| 64. | Waihee Waiehu | 1 | 3,409(0.03%)#64 | 2,208,794(0.00%)#7,935 |
| 65. | Laie | 1 | 3,409(0.03%)#65 | 2,208,794(0.00%)#7,946 |
| 66. | Paukaa | 1 | 3,409(0.03%)#66 | 2,208,794(0.00%)#8,023 |
| 67. | Kapalua | 1 | 3,409(0.03%)#67 | 2,208,794(0.00%)#8,050 |
| 68. | Kukuihaele | 1 | 3,409(0.03%)#68 | 2,208,794(0.00%)#8,052 |
1
2Common Questions
What are the Top 10 Cities with the Most Immigrants from Eastern Europe in Hawaii?
Top 10 Cities with the Most Immigrants from Eastern Europe in Hawaii are:
#1
1,094
#2
156
#3
145
#4
145
#5
104
#6
76
#7
66
#8
56
#9
52
#10
50
What city has the Most Immigrants from Eastern Europe in Hawaii?
Urban Honolulu has the Most Immigrants from Eastern Europe in Hawaii with 1,094.
What is the Total Immigrants from Eastern Europe in the State of Hawaii?
Total Immigrants from Eastern Europe in Hawaii is 3,409.
What is the Total Immigrants from Eastern Europe in the United States?
Total Immigrants from Eastern Europe in the United States is 2,208,794.