Cities with the Most Immigrants from Eastern Europe in Maryland
RELATED REPORTS & OPTIONS
Eastern Europe
Maryland
Compare Cities
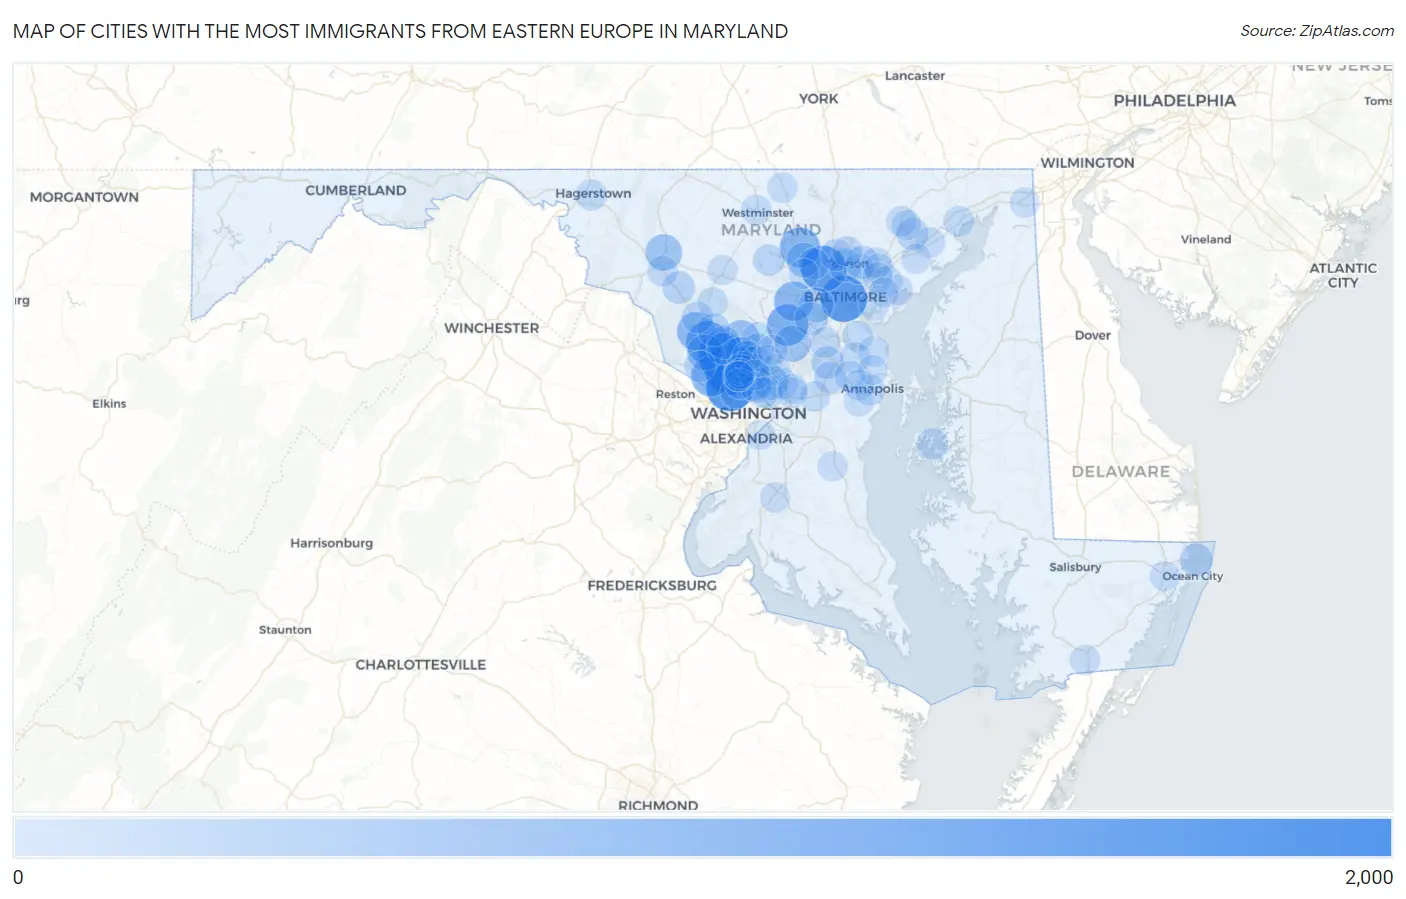
Map of Cities with the Most Immigrants from Eastern Europe in Maryland
0
2,000
Cities with the Most Immigrants from Eastern Europe in Maryland
| City | Eastern Europe | vs State | vs National | |
| 1. | North Bethesda | 1,761 | 34,645(5.08%)#1 | 2,208,794(0.08%)#152 |
| 2. | Rockville | 1,628 | 34,645(4.70%)#2 | 2,208,794(0.07%)#165 |
| 3. | Bethesda | 1,573 | 34,645(4.54%)#3 | 2,208,794(0.07%)#174 |
| 4. | Baltimore | 1,485 | 34,645(4.29%)#4 | 2,208,794(0.07%)#188 |
| 5. | Pikesville | 1,420 | 34,645(4.10%)#5 | 2,208,794(0.06%)#198 |
| 6. | Gaithersburg | 1,146 | 34,645(3.31%)#6 | 2,208,794(0.05%)#255 |
| 7. | Columbia | 1,017 | 34,645(2.94%)#7 | 2,208,794(0.05%)#301 |
| 8. | Potomac | 933 | 34,645(2.69%)#8 | 2,208,794(0.04%)#328 |
| 9. | Reisterstown | 915 | 34,645(2.64%)#9 | 2,208,794(0.04%)#338 |
| 10. | Ellicott City | 848 | 34,645(2.45%)#10 | 2,208,794(0.04%)#372 |
| 11. | Germantown | 777 | 34,645(2.24%)#11 | 2,208,794(0.04%)#411 |
| 12. | Olney | 658 | 34,645(1.90%)#12 | 2,208,794(0.03%)#478 |
| 13. | Frederick | 598 | 34,645(1.73%)#13 | 2,208,794(0.03%)#520 |
| 14. | North Laurel | 591 | 34,645(1.71%)#14 | 2,208,794(0.03%)#533 |
| 15. | Silver Spring | 568 | 34,645(1.64%)#15 | 2,208,794(0.03%)#554 |
| 16. | North Potomac | 537 | 34,645(1.55%)#16 | 2,208,794(0.02%)#579 |
| 17. | Aspen Hill | 460 | 34,645(1.33%)#17 | 2,208,794(0.02%)#673 |
| 18. | Owings Mills | 429 | 34,645(1.24%)#18 | 2,208,794(0.02%)#716 |
| 19. | Catonsville | 423 | 34,645(1.22%)#19 | 2,208,794(0.02%)#723 |
| 20. | College Park | 407 | 34,645(1.17%)#20 | 2,208,794(0.02%)#745 |
| 21. | Ilchester | 315 | 34,645(0.91%)#21 | 2,208,794(0.01%)#967 |
| 22. | Towson | 302 | 34,645(0.87%)#22 | 2,208,794(0.01%)#1,010 |
| 23. | Redland | 298 | 34,645(0.86%)#23 | 2,208,794(0.01%)#1,021 |
| 24. | Ocean City | 298 | 34,645(0.86%)#24 | 2,208,794(0.01%)#1,023 |
| 25. | Carney | 296 | 34,645(0.85%)#25 | 2,208,794(0.01%)#1,026 |
| 26. | Cloverly | 273 | 34,645(0.79%)#26 | 2,208,794(0.01%)#1,099 |
| 27. | Montgomery Village | 266 | 34,645(0.77%)#27 | 2,208,794(0.01%)#1,126 |
| 28. | Odenton | 252 | 34,645(0.73%)#28 | 2,208,794(0.01%)#1,174 |
| 29. | Urbana | 252 | 34,645(0.73%)#29 | 2,208,794(0.01%)#1,175 |
| 30. | Kemp Mill | 240 | 34,645(0.69%)#30 | 2,208,794(0.01%)#1,228 |
| 31. | Bel Air South | 230 | 34,645(0.66%)#31 | 2,208,794(0.01%)#1,264 |
| 32. | Glenmont | 222 | 34,645(0.64%)#32 | 2,208,794(0.01%)#1,304 |
| 33. | Mays Chapel | 201 | 34,645(0.58%)#33 | 2,208,794(0.01%)#1,416 |
| 34. | Friendship Heights Village | 185 | 34,645(0.53%)#34 | 2,208,794(0.01%)#1,503 |
| 35. | Crofton | 181 | 34,645(0.52%)#35 | 2,208,794(0.01%)#1,517 |
| 36. | Leisure World | 173 | 34,645(0.50%)#36 | 2,208,794(0.01%)#1,569 |
| 37. | Eldersburg | 167 | 34,645(0.48%)#37 | 2,208,794(0.01%)#1,606 |
| 38. | Clarksburg | 153 | 34,645(0.44%)#38 | 2,208,794(0.01%)#1,722 |
| 39. | St Michaels | 153 | 34,645(0.44%)#39 | 2,208,794(0.01%)#1,725 |
| 40. | Wheaton | 152 | 34,645(0.44%)#40 | 2,208,794(0.01%)#1,730 |
| 41. | Garrison | 149 | 34,645(0.43%)#41 | 2,208,794(0.01%)#1,762 |
| 42. | Derwood | 141 | 34,645(0.41%)#42 | 2,208,794(0.01%)#1,846 |
| 43. | Travilah | 134 | 34,645(0.39%)#43 | 2,208,794(0.01%)#1,918 |
| 44. | Severn | 133 | 34,645(0.38%)#44 | 2,208,794(0.01%)#1,920 |
| 45. | Hagerstown | 130 | 34,645(0.38%)#45 | 2,208,794(0.01%)#1,942 |
| 46. | Greenbelt | 129 | 34,645(0.37%)#46 | 2,208,794(0.01%)#1,950 |
| 47. | Woodlawn Cdp Baltimore County | 127 | 34,645(0.37%)#47 | 2,208,794(0.01%)#1,965 |
| 48. | Ballenger Creek | 125 | 34,645(0.36%)#48 | 2,208,794(0.01%)#1,991 |
| 49. | Ashton Sandy Spring | 119 | 34,645(0.34%)#49 | 2,208,794(0.01%)#2,058 |
| 50. | North Kensington | 116 | 34,645(0.33%)#50 | 2,208,794(0.01%)#2,099 |
| 51. | Colesville | 115 | 34,645(0.33%)#51 | 2,208,794(0.01%)#2,109 |
| 52. | Hyattsville | 114 | 34,645(0.33%)#52 | 2,208,794(0.01%)#2,113 |
| 53. | Havre De Grace | 114 | 34,645(0.33%)#53 | 2,208,794(0.01%)#2,114 |
| 54. | Pasadena | 110 | 34,645(0.32%)#54 | 2,208,794(0.00%)#2,165 |
| 55. | Parkville | 110 | 34,645(0.32%)#55 | 2,208,794(0.00%)#2,167 |
| 56. | Beltsville | 109 | 34,645(0.31%)#56 | 2,208,794(0.00%)#2,185 |
| 57. | Annapolis | 107 | 34,645(0.31%)#57 | 2,208,794(0.00%)#2,212 |
| 58. | Severna Park | 106 | 34,645(0.31%)#58 | 2,208,794(0.00%)#2,221 |
| 59. | Layhill | 102 | 34,645(0.29%)#59 | 2,208,794(0.00%)#2,284 |
| 60. | Perry Hall | 97 | 34,645(0.28%)#60 | 2,208,794(0.00%)#2,338 |
| 61. | Fairland | 97 | 34,645(0.28%)#61 | 2,208,794(0.00%)#2,339 |
| 62. | Lake Shore | 97 | 34,645(0.28%)#62 | 2,208,794(0.00%)#2,341 |
| 63. | Crownsville | 97 | 34,645(0.28%)#63 | 2,208,794(0.00%)#2,356 |
| 64. | Middle River | 93 | 34,645(0.27%)#64 | 2,208,794(0.00%)#2,400 |
| 65. | Manchester | 93 | 34,645(0.27%)#65 | 2,208,794(0.00%)#2,411 |
| 66. | Bel Air North | 92 | 34,645(0.27%)#66 | 2,208,794(0.00%)#2,416 |
| 67. | Takoma Park | 91 | 34,645(0.26%)#67 | 2,208,794(0.00%)#2,431 |
| 68. | Riverside | 89 | 34,645(0.26%)#68 | 2,208,794(0.00%)#2,474 |
| 69. | Four Corners | 88 | 34,645(0.25%)#69 | 2,208,794(0.00%)#2,487 |
| 70. | Chillum | 86 | 34,645(0.25%)#70 | 2,208,794(0.00%)#2,508 |
| 71. | Chevy Chase | 85 | 34,645(0.25%)#71 | 2,208,794(0.00%)#2,540 |
| 72. | Bowleys Quarters | 84 | 34,645(0.24%)#72 | 2,208,794(0.00%)#2,560 |
| 73. | Parole | 79 | 34,645(0.23%)#73 | 2,208,794(0.00%)#2,661 |
| 74. | Bowie | 78 | 34,645(0.23%)#74 | 2,208,794(0.00%)#2,675 |
| 75. | Lanham | 78 | 34,645(0.23%)#75 | 2,208,794(0.00%)#2,682 |
| 76. | Westminster | 75 | 34,645(0.22%)#76 | 2,208,794(0.00%)#2,746 |
| 77. | Damascus | 75 | 34,645(0.22%)#77 | 2,208,794(0.00%)#2,748 |
| 78. | Edgewater | 73 | 34,645(0.21%)#78 | 2,208,794(0.00%)#2,785 |
| 79. | Edgewood | 71 | 34,645(0.20%)#79 | 2,208,794(0.00%)#2,819 |
| 80. | Elkton | 68 | 34,645(0.20%)#80 | 2,208,794(0.00%)#2,886 |
| 81. | Burtonsville | 67 | 34,645(0.19%)#81 | 2,208,794(0.00%)#2,907 |
| 82. | Mount Airy | 66 | 34,645(0.19%)#82 | 2,208,794(0.00%)#2,937 |
| 83. | Dundalk | 65 | 34,645(0.19%)#83 | 2,208,794(0.00%)#2,948 |
| 84. | Bel Air | 63 | 34,645(0.18%)#84 | 2,208,794(0.00%)#2,994 |
| 85. | White Marsh | 60 | 34,645(0.17%)#85 | 2,208,794(0.00%)#3,059 |
| 86. | Chevy Chase View | 60 | 34,645(0.17%)#86 | 2,208,794(0.00%)#3,075 |
| 87. | Flower Hill | 59 | 34,645(0.17%)#87 | 2,208,794(0.00%)#3,087 |
| 88. | Dunkirk | 59 | 34,645(0.17%)#88 | 2,208,794(0.00%)#3,100 |
| 89. | Berlin | 58 | 34,645(0.17%)#89 | 2,208,794(0.00%)#3,119 |
| 90. | Timonium | 57 | 34,645(0.16%)#90 | 2,208,794(0.00%)#3,138 |
| 91. | South Kensington | 55 | 34,645(0.16%)#91 | 2,208,794(0.00%)#3,207 |
| 92. | Randallstown | 53 | 34,645(0.15%)#92 | 2,208,794(0.00%)#3,245 |
| 93. | Rossville | 53 | 34,645(0.15%)#93 | 2,208,794(0.00%)#3,253 |
| 94. | Waldorf | 51 | 34,645(0.15%)#94 | 2,208,794(0.00%)#3,310 |
| 95. | Glassmanor | 51 | 34,645(0.15%)#95 | 2,208,794(0.00%)#3,322 |
| 96. | Kensington | 48 | 34,645(0.14%)#96 | 2,208,794(0.00%)#3,450 |
| 97. | Arnold | 46 | 34,645(0.13%)#97 | 2,208,794(0.00%)#3,487 |
| 98. | Pocomoke City | 46 | 34,645(0.13%)#98 | 2,208,794(0.00%)#3,519 |
| 99. | Essex | 45 | 34,645(0.13%)#99 | 2,208,794(0.00%)#3,530 |
| 100. | Seabrook | 45 | 34,645(0.13%)#100 | 2,208,794(0.00%)#3,533 |
Common Questions
What are the Top 10 Cities with the Most Immigrants from Eastern Europe in Maryland?
Top 10 Cities with the Most Immigrants from Eastern Europe in Maryland are:
#1
1,761
#2
1,628
#3
1,573
#4
1,485
#5
1,420
#6
1,146
#7
1,017
#8
933
#9
915
#10
848
What city has the Most Immigrants from Eastern Europe in Maryland?
North Bethesda has the Most Immigrants from Eastern Europe in Maryland with 1,761.
What is the Total Immigrants from Eastern Europe in the State of Maryland?
Total Immigrants from Eastern Europe in Maryland is 34,645.
What is the Total Immigrants from Eastern Europe in the United States?
Total Immigrants from Eastern Europe in the United States is 2,208,794.