Fortuna, CA Map & Demographics
Fortuna Map
Fortuna Overview
$32,543
PER CAPITA INCOME
$68,009
AVG FAMILY INCOME
$58,633
AVG HOUSEHOLD INCOME
47.4%
WAGE / INCOME GAP [ % ]
52.6¢/ $1
WAGE / INCOME GAP [ $ ]
0.46
INEQUALITY / GINI INDEX
12,527
TOTAL POPULATION
6,040
MALE POPULATION
6,487
FEMALE POPULATION
93.11
MALES / 100 FEMALES
107.40
FEMALES / 100 MALES
37.5
MEDIAN AGE
3.1
AVG FAMILY SIZE
2.5
AVG HOUSEHOLD SIZE
5,941
LABOR FORCE [ PEOPLE ]
58.8%
PERCENT IN LABOR FORCE
5.3%
UNEMPLOYMENT RATE
Fortuna Zip Codes
Fortuna Area Codes
Income in Fortuna
Income Overview in Fortuna
Per Capita Income in Fortuna is $32,543, while median incomes of families and households are $68,009 and $58,633 respectively.
| Characteristic | Number | Measure |
| Per Capita Income | 12,527 | $32,543 |
| Median Family Income | 2,998 | $68,009 |
| Mean Family Income | 2,998 | $94,718 |
| Median Household Income | 4,955 | $58,633 |
| Mean Household Income | 4,955 | $80,311 |
| Income Deficit | 2,998 | $0 |
| Wage / Income Gap (%) | 12,527 | 47.36% |
| Wage / Income Gap ($) | 12,527 | 52.64¢ per $1 |
| Gini / Inequality Index | 12,527 | 0.46 |
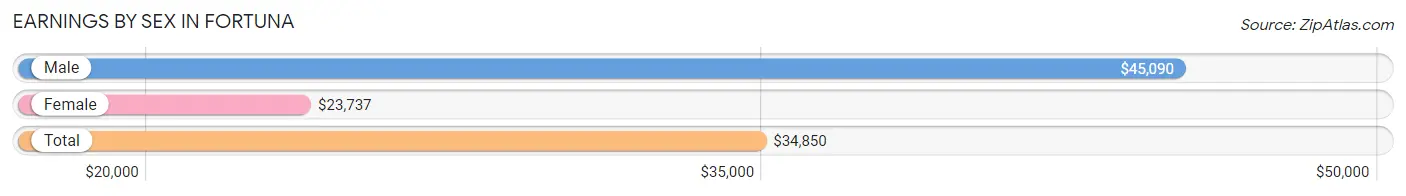
Earnings by Sex in Fortuna
Average Earnings in Fortuna are $34,850, $45,090 for men and $23,737 for women, a difference of 47.4%.
| Sex | Number | Average Earnings |
| Male | 3,479 (55.3%) | $45,090 |
| Female | 2,808 (44.7%) | $23,737 |
| Total | 6,287 (100.0%) | $34,850 |
Earnings by Sex by Income Bracket in Fortuna
The most common earnings brackets in Fortuna are $100,000+ for men (535 | 15.4%) and $2,499 or less for women (293 | 10.4%).
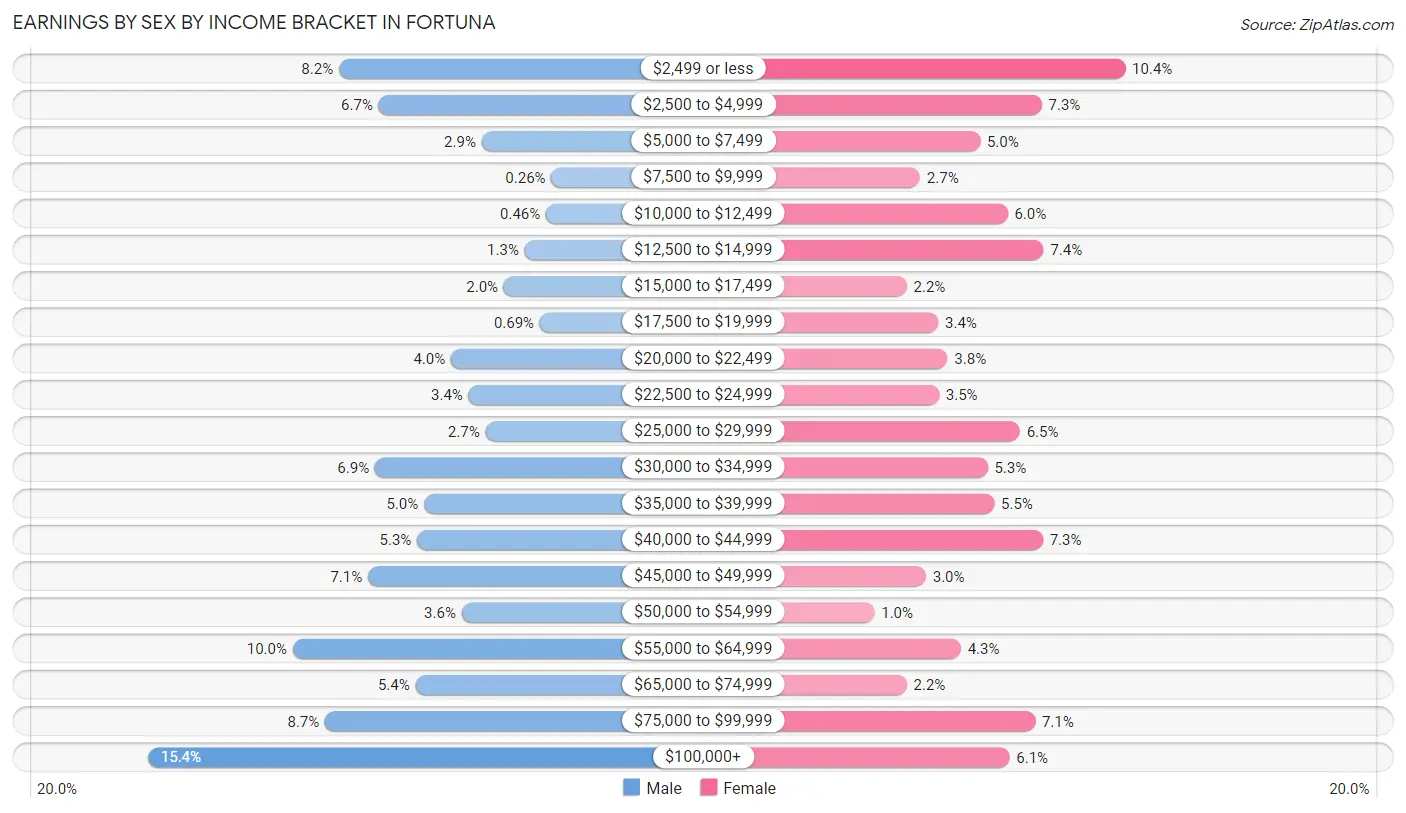
| Income | Male | Female |
| $2,499 or less | 286 (8.2%) | 293 (10.4%) |
| $2,500 to $4,999 | 234 (6.7%) | 205 (7.3%) |
| $5,000 to $7,499 | 100 (2.9%) | 140 (5.0%) |
| $7,500 to $9,999 | 9 (0.3%) | 77 (2.7%) |
| $10,000 to $12,499 | 16 (0.5%) | 169 (6.0%) |
| $12,500 to $14,999 | 44 (1.3%) | 207 (7.4%) |
| $15,000 to $17,499 | 71 (2.0%) | 63 (2.2%) |
| $17,500 to $19,999 | 24 (0.7%) | 96 (3.4%) |
| $20,000 to $22,499 | 140 (4.0%) | 106 (3.8%) |
| $22,500 to $24,999 | 117 (3.4%) | 97 (3.5%) |
| $25,000 to $29,999 | 95 (2.7%) | 182 (6.5%) |
| $30,000 to $34,999 | 239 (6.9%) | 148 (5.3%) |
| $35,000 to $39,999 | 175 (5.0%) | 155 (5.5%) |
| $40,000 to $44,999 | 184 (5.3%) | 206 (7.3%) |
| $45,000 to $49,999 | 248 (7.1%) | 83 (3.0%) |
| $50,000 to $54,999 | 126 (3.6%) | 29 (1.0%) |
| $55,000 to $64,999 | 346 (10.0%) | 120 (4.3%) |
| $65,000 to $74,999 | 186 (5.3%) | 63 (2.2%) |
| $75,000 to $99,999 | 304 (8.7%) | 198 (7.0%) |
| $100,000+ | 535 (15.4%) | 171 (6.1%) |
| Total | 3,479 (100.0%) | 2,808 (100.0%) |
Earnings by Sex by Educational Attainment in Fortuna
Average earnings in Fortuna are $49,500 for men and $29,809 for women, a difference of 39.8%. Men with an educational attainment of bachelor's degree enjoy the highest average annual earnings of $109,881, while those with less than high school education earn the least with $37,452. Women with an educational attainment of graduate degree earn the most with the average annual earnings of $41,080, while those with high school diploma education have the smallest earnings of $23,807.
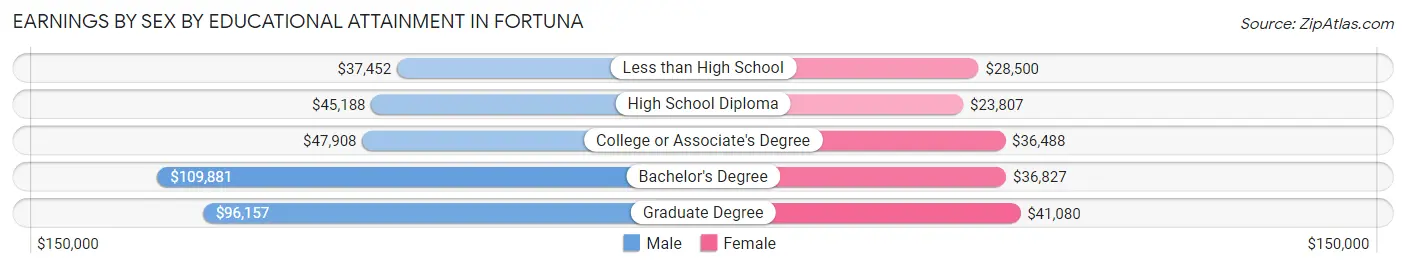
| Educational Attainment | Male Income | Female Income |
| Less than High School | $37,452 | $28,500 |
| High School Diploma | $45,188 | $23,807 |
| College or Associate's Degree | $47,908 | $36,488 |
| Bachelor's Degree | $109,881 | $36,827 |
| Graduate Degree | $96,157 | $41,080 |
| Total | $49,500 | $29,809 |
Family Income in Fortuna
Family Income Brackets in Fortuna
According to the Fortuna family income data, there are 498 families falling into the $50,000 to $74,999 income range, which is the most common income bracket and makes up 16.6% of all families. Conversely, the $10,000 to $14,999 income bracket is the least frequent group with only 57 families (1.9%) belonging to this category.
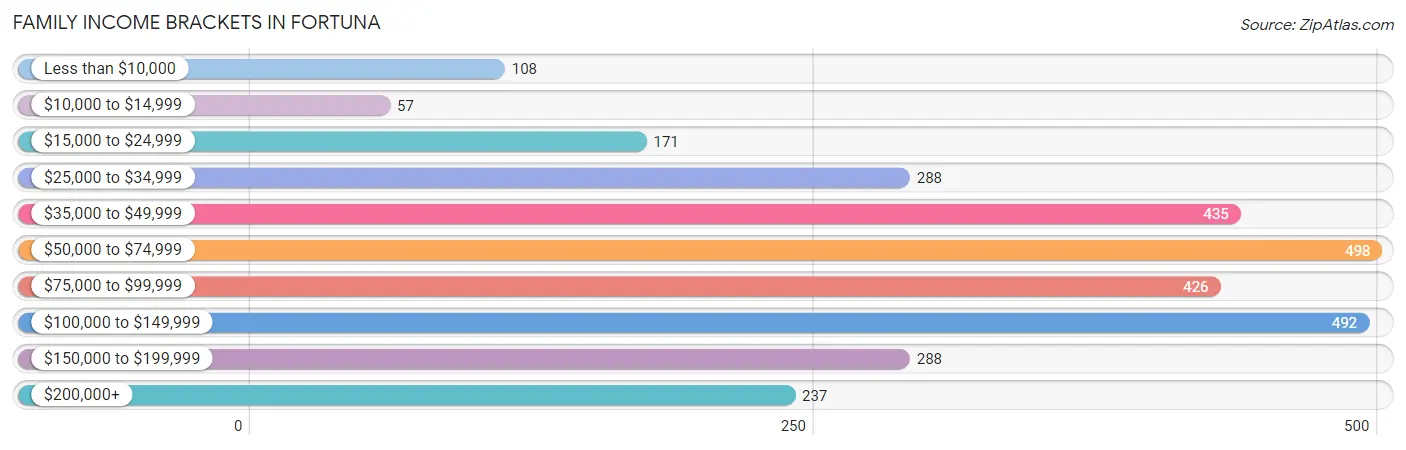
| Income Bracket | # Families | % Families |
| Less than $10,000 | 108 | 3.6% |
| $10,000 to $14,999 | 57 | 1.9% |
| $15,000 to $24,999 | 171 | 5.7% |
| $25,000 to $34,999 | 288 | 9.6% |
| $35,000 to $49,999 | 435 | 14.5% |
| $50,000 to $74,999 | 498 | 16.6% |
| $75,000 to $99,999 | 426 | 14.2% |
| $100,000 to $149,999 | 492 | 16.4% |
| $150,000 to $199,999 | 288 | 9.6% |
| $200,000+ | 237 | 7.9% |
Family Income by Famaliy Size in Fortuna
6-person families (109 | 3.6%) account for the highest median family income in Fortuna with $113,098 per family, while 3-person families (655 | 21.8%) have the highest median income of $31,157 per family member.
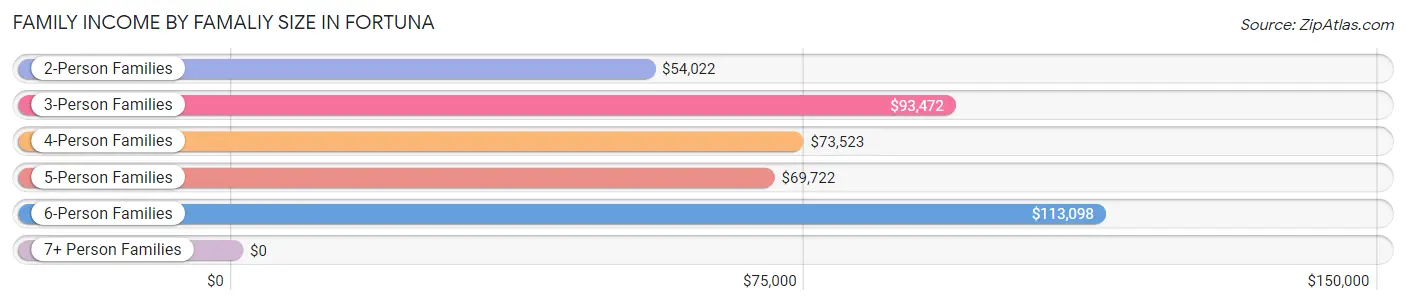
| Income Bracket | # Families | Median Income |
| 2-Person Families | 1,522 (50.8%) | $54,022 |
| 3-Person Families | 655 (21.8%) | $93,472 |
| 4-Person Families | 417 (13.9%) | $73,523 |
| 5-Person Families | 188 (6.3%) | $69,722 |
| 6-Person Families | 109 (3.6%) | $113,098 |
| 7+ Person Families | 107 (3.6%) | $0 |
| Total | 2,998 (100.0%) | $68,009 |
Family Income by Number of Earners in Fortuna
The median family income in Fortuna is $68,009, with families comprising 3+ earners (341) having the highest median family income of $161,563, while families with no earners (419) have the lowest median family income of $44,801, accounting for 11.4% and 14.0% of families, respectively.
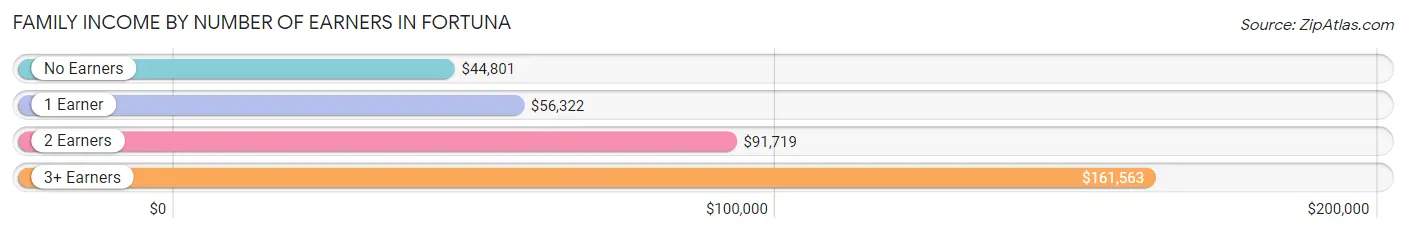
| Number of Earners | # Families | Median Income |
| No Earners | 419 (14.0%) | $44,801 |
| 1 Earner | 1,189 (39.7%) | $56,322 |
| 2 Earners | 1,049 (35.0%) | $91,719 |
| 3+ Earners | 341 (11.4%) | $161,563 |
| Total | 2,998 (100.0%) | $68,009 |
Household Income in Fortuna
Household Income Brackets in Fortuna
With 803 households falling in the category, the $50,000 to $74,999 income range is the most frequent in Fortuna, accounting for 16.2% of all households. In contrast, only 213 households (4.3%) fall into the less than $10,000 income bracket, making it the least populous group.
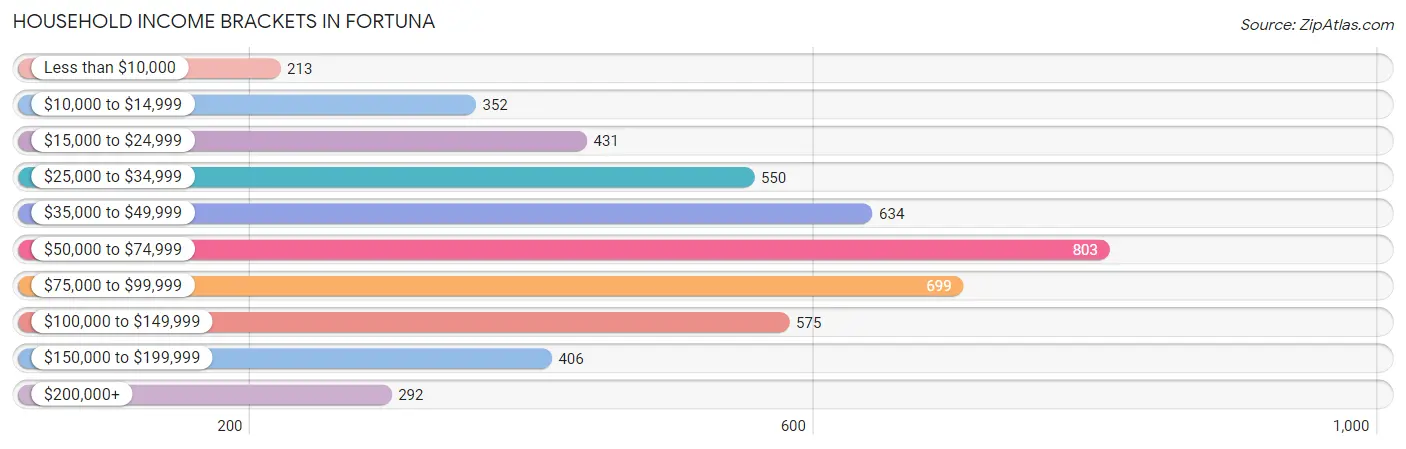
| Income Bracket | # Households | % Households |
| Less than $10,000 | 213 | 4.3% |
| $10,000 to $14,999 | 352 | 7.1% |
| $15,000 to $24,999 | 431 | 8.7% |
| $25,000 to $34,999 | 550 | 11.1% |
| $35,000 to $49,999 | 634 | 12.8% |
| $50,000 to $74,999 | 803 | 16.2% |
| $75,000 to $99,999 | 699 | 14.1% |
| $100,000 to $149,999 | 575 | 11.6% |
| $150,000 to $199,999 | 406 | 8.2% |
| $200,000+ | 292 | 5.9% |
Household Income by Householder Age in Fortuna
The median household income in Fortuna is $58,633, with the highest median household income of $66,875 found in the 25 to 44 years age bracket for the primary householder. A total of 1,505 households (30.4%) fall into this category. Meanwhile, the 65+ years age bracket for the primary householder has the lowest median household income of $43,484, with 1,280 households (25.8%) in this group.
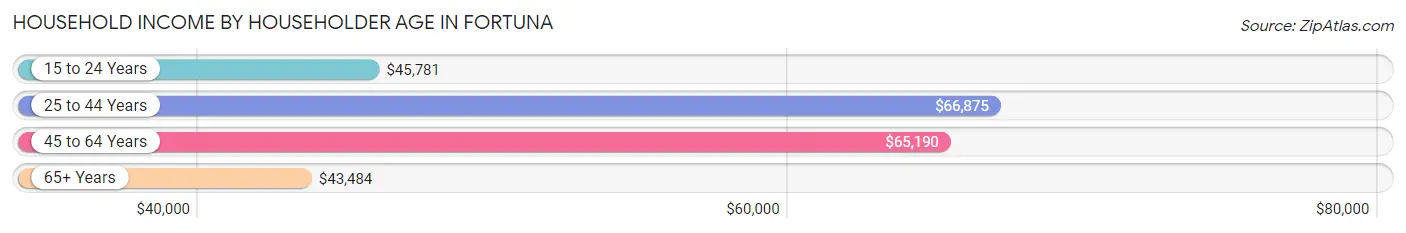
| Income Bracket | # Households | Median Income |
| 15 to 24 Years | 351 (7.1%) | $45,781 |
| 25 to 44 Years | 1,505 (30.4%) | $66,875 |
| 45 to 64 Years | 1,819 (36.7%) | $65,190 |
| 65+ Years | 1,280 (25.8%) | $43,484 |
| Total | 4,955 (100.0%) | $58,633 |
Poverty in Fortuna
Income Below Poverty by Sex and Age in Fortuna
With 13.6% poverty level for males and 15.5% for females among the residents of Fortuna, 15 year old males and 15 year old females are the most vulnerable to poverty, with 56 males (45.5%) and 47 females (79.7%) in their respective age groups living below the poverty level.
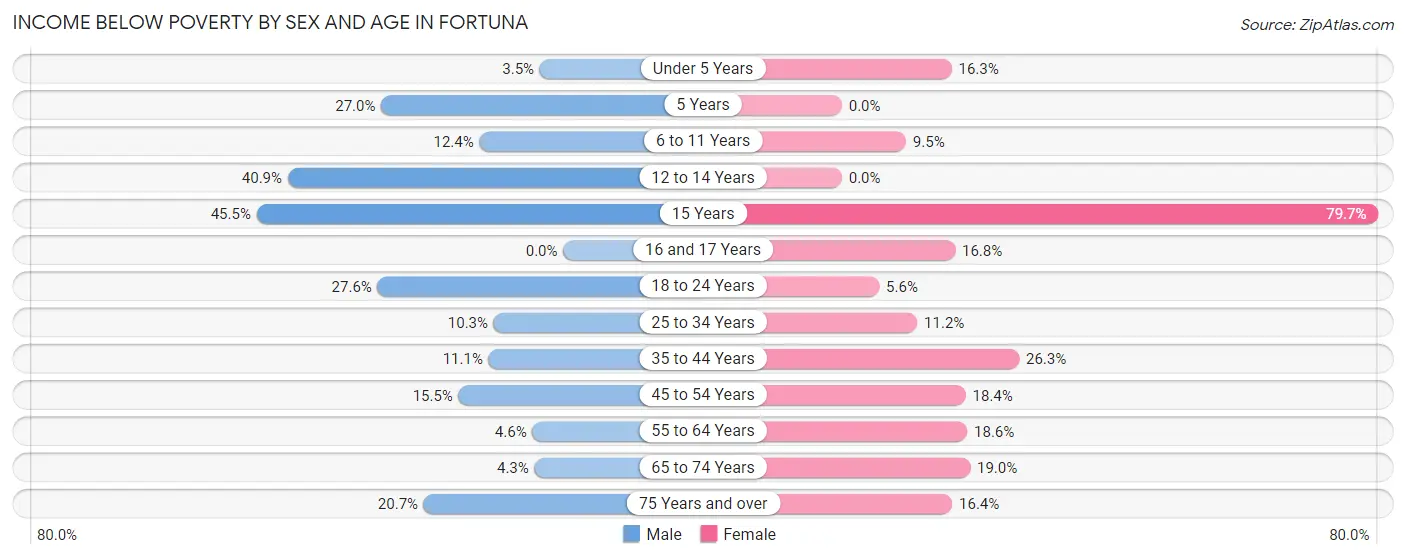
| Age Bracket | Male | Female |
| Under 5 Years | 11 (3.5%) | 66 (16.3%) |
| 5 Years | 30 (27.0%) | 0 (0.0%) |
| 6 to 11 Years | 52 (12.4%) | 55 (9.5%) |
| 12 to 14 Years | 54 (40.9%) | 0 (0.0%) |
| 15 Years | 56 (45.5%) | 47 (79.7%) |
| 16 and 17 Years | 0 (0.0%) | 40 (16.8%) |
| 18 to 24 Years | 188 (27.6%) | 39 (5.6%) |
| 25 to 34 Years | 84 (10.3%) | 97 (11.2%) |
| 35 to 44 Years | 91 (11.1%) | 159 (26.3%) |
| 45 to 54 Years | 117 (15.5%) | 112 (18.4%) |
| 55 to 64 Years | 38 (4.6%) | 187 (18.6%) |
| 65 to 74 Years | 23 (4.3%) | 95 (19.0%) |
| 75 Years and over | 76 (20.7%) | 96 (16.4%) |
| Total | 820 (13.6%) | 993 (15.5%) |
Income Above Poverty by Sex and Age in Fortuna
According to the poverty statistics in Fortuna, males aged 16 and 17 years and females aged 5 years are the age groups that are most secure financially, with 100.0% of males and 100.0% of females in these age groups living above the poverty line.
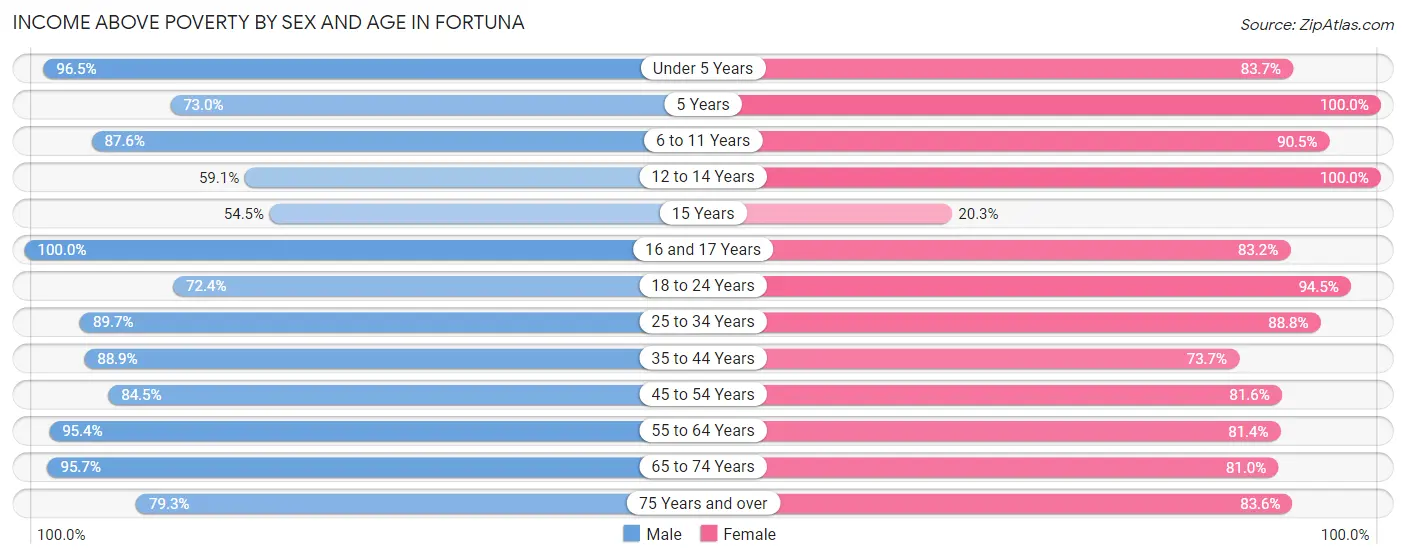
| Age Bracket | Male | Female |
| Under 5 Years | 305 (96.5%) | 339 (83.7%) |
| 5 Years | 81 (73.0%) | 115 (100.0%) |
| 6 to 11 Years | 366 (87.6%) | 523 (90.5%) |
| 12 to 14 Years | 78 (59.1%) | 146 (100.0%) |
| 15 Years | 67 (54.5%) | 12 (20.3%) |
| 16 and 17 Years | 106 (100.0%) | 198 (83.2%) |
| 18 to 24 Years | 494 (72.4%) | 664 (94.5%) |
| 25 to 34 Years | 730 (89.7%) | 770 (88.8%) |
| 35 to 44 Years | 730 (88.9%) | 445 (73.7%) |
| 45 to 54 Years | 636 (84.5%) | 497 (81.6%) |
| 55 to 64 Years | 791 (95.4%) | 818 (81.4%) |
| 65 to 74 Years | 516 (95.7%) | 404 (81.0%) |
| 75 Years and over | 291 (79.3%) | 490 (83.6%) |
| Total | 5,191 (86.4%) | 5,421 (84.5%) |
Income Below Poverty Among Married-Couple Families in Fortuna
The poverty statistics for married-couple families in Fortuna show that 2.2% or 46 of the total 2,051 families live below the poverty line. Families with 3 or 4 children have the highest poverty rate of 3.6%, comprising of 10 families. On the other hand, families with 1 or 2 children have the lowest poverty rate of 0.0%, which includes 0 families.
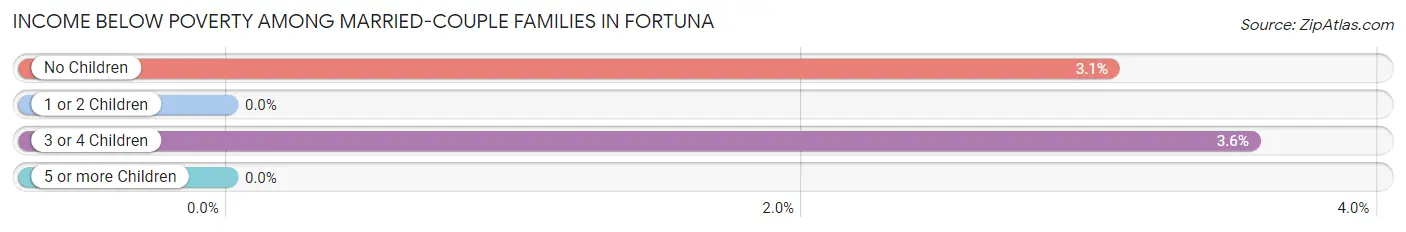
| Children | Above Poverty | Below Poverty |
| No Children | 1,138 (96.9%) | 36 (3.1%) |
| 1 or 2 Children | 590 (100.0%) | 0 (0.0%) |
| 3 or 4 Children | 271 (96.4%) | 10 (3.6%) |
| 5 or more Children | 6 (100.0%) | 0 (0.0%) |
| Total | 2,005 (97.8%) | 46 (2.2%) |
Income Below Poverty Among Single-Parent Households in Fortuna
According to the poverty data in Fortuna, 15.7% or 71 single-father households and 30.2% or 149 single-mother households are living below the poverty line. Among single-father households, those with 3 or 4 children have the highest poverty rate, with 29 households (80.6%) experiencing poverty. Likewise, among single-mother households, those with 1 or 2 children have the highest poverty rate, with 139 households (59.4%) falling below the poverty line.
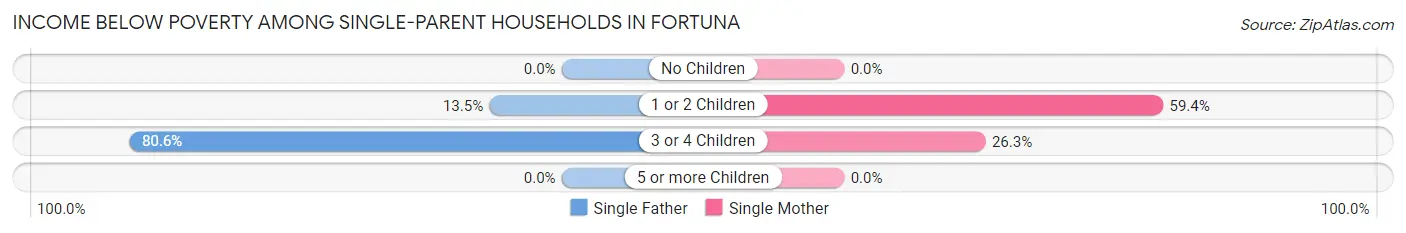
| Children | Single Father | Single Mother |
| No Children | 0 (0.0%) | 0 (0.0%) |
| 1 or 2 Children | 42 (13.5%) | 139 (59.4%) |
| 3 or 4 Children | 29 (80.6%) | 10 (26.3%) |
| 5 or more Children | 0 (0.0%) | 0 (0.0%) |
| Total | 71 (15.7%) | 149 (30.2%) |
Income Below Poverty Among Married-Couple vs Single-Parent Households in Fortuna
The poverty data for Fortuna shows that 46 of the married-couple family households (2.2%) and 220 of the single-parent households (23.2%) are living below the poverty level. Within the married-couple family households, those with 3 or 4 children have the highest poverty rate, with 10 households (3.6%) falling below the poverty line. Among the single-parent households, those with 3 or 4 children have the highest poverty rate, with 39 household (52.7%) living below poverty.
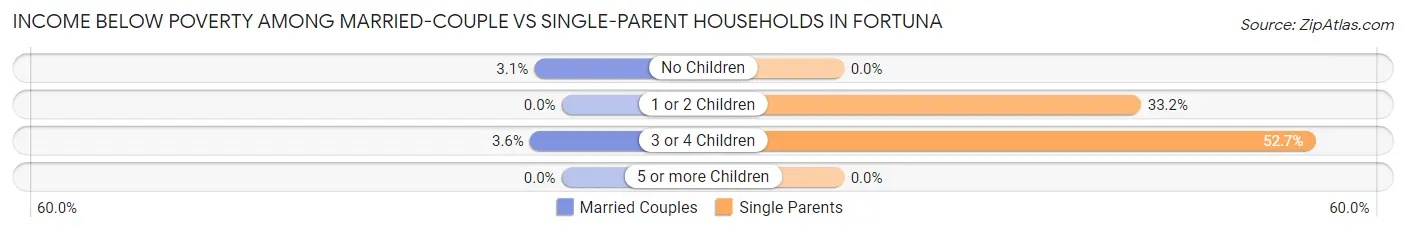
| Children | Married-Couple Families | Single-Parent Households |
| No Children | 36 (3.1%) | 0 (0.0%) |
| 1 or 2 Children | 0 (0.0%) | 181 (33.2%) |
| 3 or 4 Children | 10 (3.6%) | 39 (52.7%) |
| 5 or more Children | 0 (0.0%) | 0 (0.0%) |
| Total | 46 (2.2%) | 220 (23.2%) |
Race in Fortuna
The most populous races in Fortuna are White / Caucasian (9,174 | 73.2%), Hispanic or Latino (2,386 | 19.1%), and Two or more Races (1,456 | 11.6%).
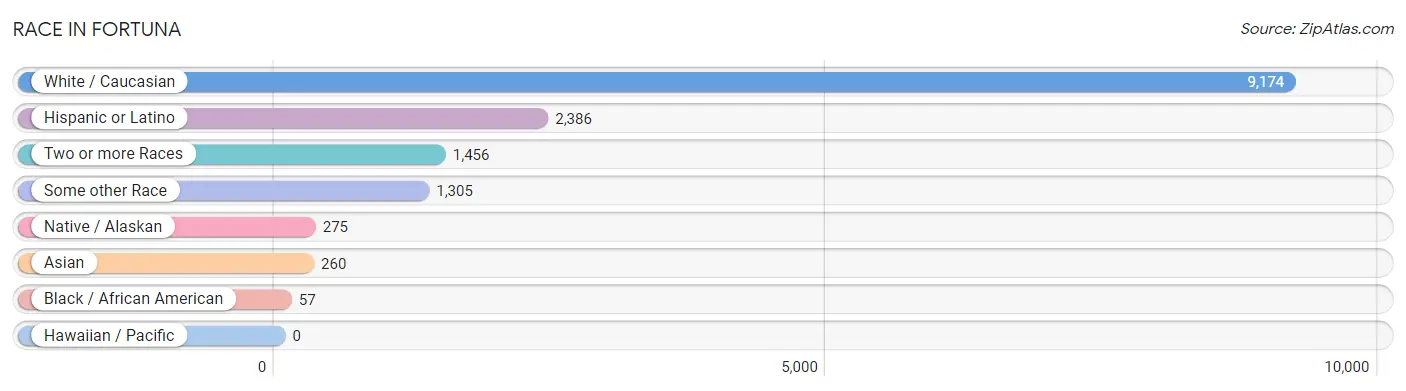
| Race | # Population | % Population |
| Asian | 260 | 2.1% |
| Black / African American | 57 | 0.5% |
| Hawaiian / Pacific | 0 | 0.0% |
| Hispanic or Latino | 2,386 | 19.1% |
| Native / Alaskan | 275 | 2.2% |
| White / Caucasian | 9,174 | 73.2% |
| Two or more Races | 1,456 | 11.6% |
| Some other Race | 1,305 | 10.4% |
| Total | 12,527 | 100.0% |
Ancestry in Fortuna
The most populous ancestries reported in Fortuna are Mexican (2,239 | 17.9%), Irish (1,851 | 14.8%), German (1,596 | 12.7%), English (1,394 | 11.1%), and Italian (504 | 4.0%), together accounting for 60.5% of all Fortuna residents.
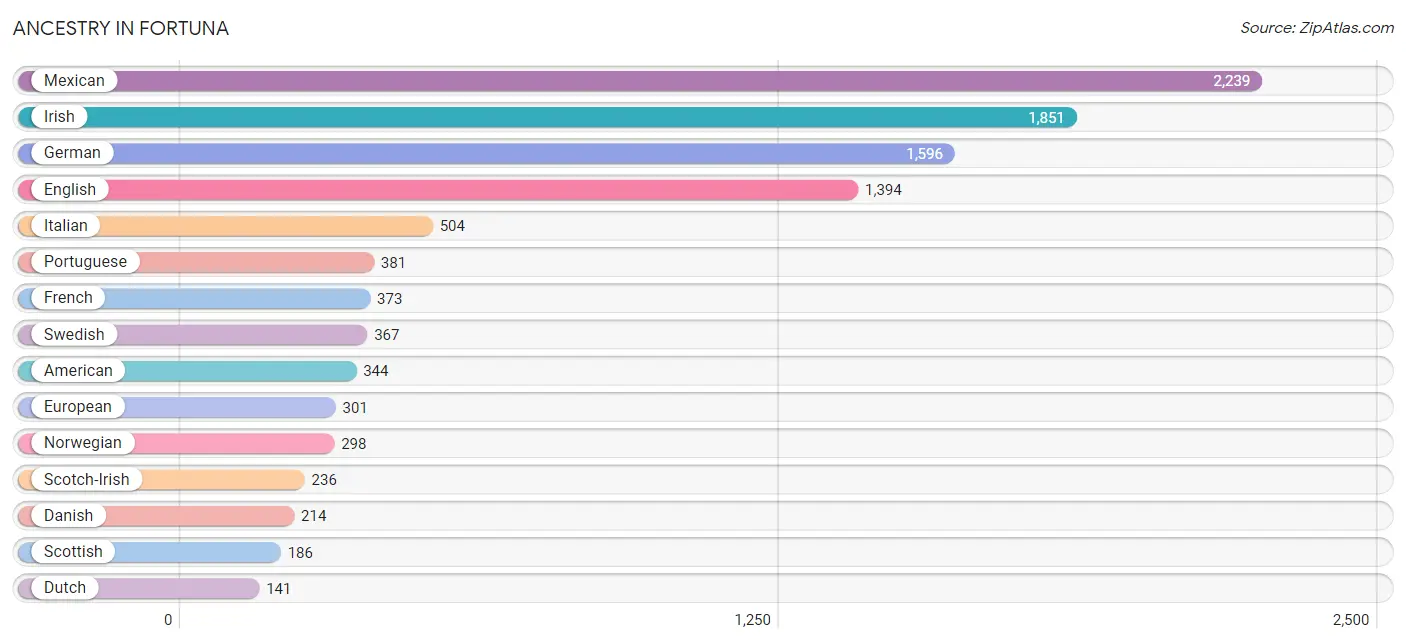
| Ancestry | # Population | % Population |
| American | 344 | 2.8% |
| Apache | 5 | 0.0% |
| Austrian | 50 | 0.4% |
| Bangladeshi | 5 | 0.0% |
| Basque | 89 | 0.7% |
| Bhutanese | 17 | 0.1% |
| Blackfeet | 53 | 0.4% |
| British | 47 | 0.4% |
| Bulgarian | 8 | 0.1% |
| Burmese | 7 | 0.1% |
| Canadian | 11 | 0.1% |
| Central American | 23 | 0.2% |
| Cherokee | 91 | 0.7% |
| Chickasaw | 37 | 0.3% |
| Choctaw | 56 | 0.4% |
| Costa Rican | 8 | 0.1% |
| Croatian | 9 | 0.1% |
| Cuban | 20 | 0.2% |
| Czech | 52 | 0.4% |
| Czechoslovakian | 7 | 0.1% |
| Danish | 214 | 1.7% |
| Delaware | 53 | 0.4% |
| Dominican | 40 | 0.3% |
| Dutch | 141 | 1.1% |
| Eastern European | 20 | 0.2% |
| English | 1,394 | 11.1% |
| European | 301 | 2.4% |
| Finnish | 19 | 0.2% |
| French | 373 | 3.0% |
| French Canadian | 87 | 0.7% |
| German | 1,596 | 12.7% |
| Greek | 23 | 0.2% |
| Guyanese | 12 | 0.1% |
| Icelander | 11 | 0.1% |
| Indian (Asian) | 53 | 0.4% |
| Iranian | 11 | 0.1% |
| Irish | 1,851 | 14.8% |
| Italian | 504 | 4.0% |
| Korean | 31 | 0.3% |
| Maltese | 22 | 0.2% |
| Mexican | 2,239 | 17.9% |
| Mexican American Indian | 35 | 0.3% |
| Northern European | 49 | 0.4% |
| Norwegian | 298 | 2.4% |
| Ottawa | 22 | 0.2% |
| Panamanian | 15 | 0.1% |
| Pennsylvania German | 63 | 0.5% |
| Peruvian | 8 | 0.1% |
| Polish | 123 | 1.0% |
| Portuguese | 381 | 3.0% |
| Russian | 12 | 0.1% |
| Scotch-Irish | 236 | 1.9% |
| Scottish | 186 | 1.5% |
| Seminole | 7 | 0.1% |
| Sioux | 37 | 0.3% |
| Slovak | 18 | 0.1% |
| South American | 8 | 0.1% |
| Spaniard | 15 | 0.1% |
| Spanish | 40 | 0.3% |
| Swedish | 367 | 2.9% |
| Swiss | 85 | 0.7% |
| Thai | 18 | 0.1% |
| Ukrainian | 18 | 0.1% |
| Welsh | 92 | 0.7% |
| West Indian | 12 | 0.1% |
| Yaqui | 26 | 0.2% | View All 66 Rows |
Immigrants in Fortuna
The most numerous immigrant groups reported in Fortuna came from Latin America (855 | 6.8%), Central America (803 | 6.4%), Mexico (788 | 6.3%), Asia (196 | 1.6%), and South Central Asia (146 | 1.2%), together accounting for 22.3% of all Fortuna residents.
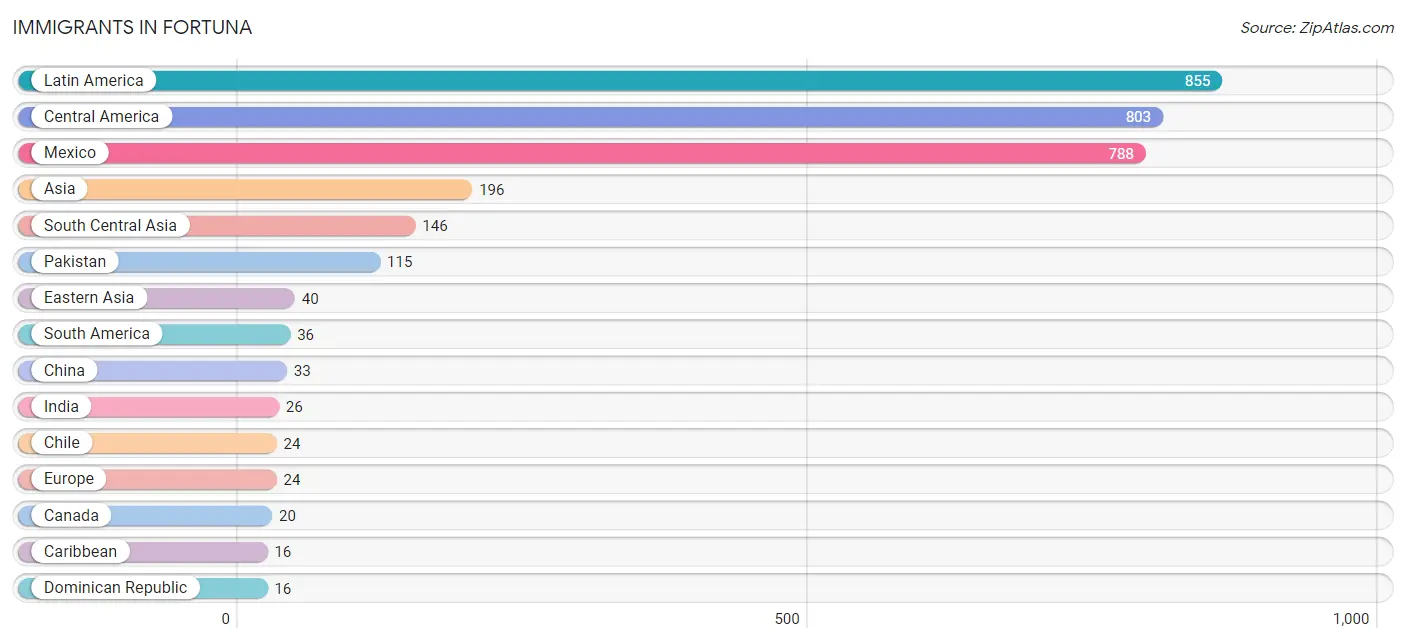
| Immigration Origin | # Population | % Population |
| Asia | 196 | 1.6% |
| Canada | 20 | 0.2% |
| Caribbean | 16 | 0.1% |
| Central America | 803 | 6.4% |
| Chile | 24 | 0.2% |
| China | 33 | 0.3% |
| Dominican Republic | 16 | 0.1% |
| Eastern Asia | 40 | 0.3% |
| England | 11 | 0.1% |
| Europe | 24 | 0.2% |
| Germany | 13 | 0.1% |
| Guyana | 12 | 0.1% |
| India | 26 | 0.2% |
| Kazakhstan | 5 | 0.0% |
| Korea | 7 | 0.1% |
| Latin America | 855 | 6.8% |
| Mexico | 788 | 6.3% |
| Northern Europe | 11 | 0.1% |
| Pakistan | 115 | 0.9% |
| Panama | 15 | 0.1% |
| Philippines | 6 | 0.1% |
| South America | 36 | 0.3% |
| South Central Asia | 146 | 1.2% |
| South Eastern Asia | 10 | 0.1% |
| Vietnam | 4 | 0.0% |
| Western Europe | 13 | 0.1% | View All 26 Rows |
Sex and Age in Fortuna
Sex and Age in Fortuna
The most populous age groups in Fortuna are 20 to 24 Years (525 | 8.7%) for men and 60 to 64 Years (557 | 8.6%) for women.
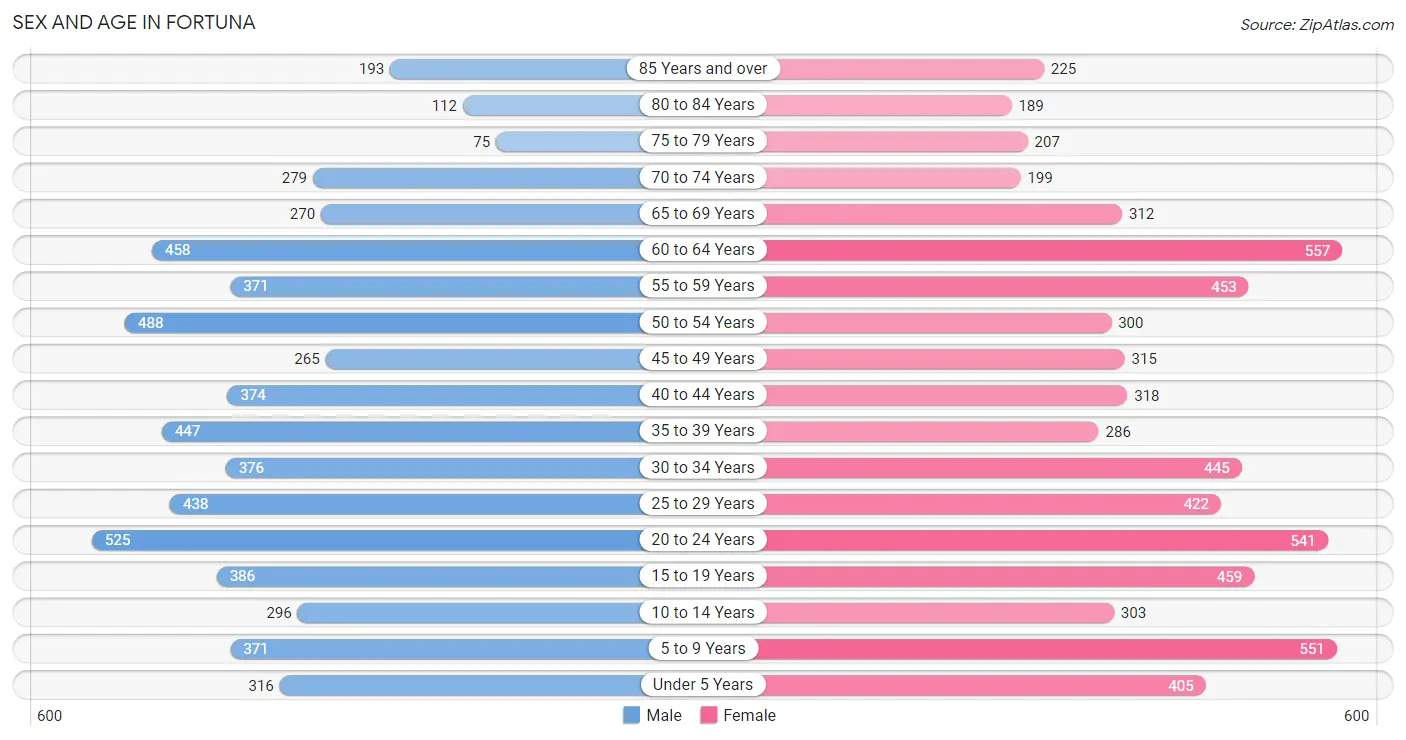
| Age Bracket | Male | Female |
| Under 5 Years | 316 (5.2%) | 405 (6.2%) |
| 5 to 9 Years | 371 (6.1%) | 551 (8.5%) |
| 10 to 14 Years | 296 (4.9%) | 303 (4.7%) |
| 15 to 19 Years | 386 (6.4%) | 459 (7.1%) |
| 20 to 24 Years | 525 (8.7%) | 541 (8.3%) |
| 25 to 29 Years | 438 (7.2%) | 422 (6.5%) |
| 30 to 34 Years | 376 (6.2%) | 445 (6.9%) |
| 35 to 39 Years | 447 (7.4%) | 286 (4.4%) |
| 40 to 44 Years | 374 (6.2%) | 318 (4.9%) |
| 45 to 49 Years | 265 (4.4%) | 315 (4.9%) |
| 50 to 54 Years | 488 (8.1%) | 300 (4.6%) |
| 55 to 59 Years | 371 (6.1%) | 453 (7.0%) |
| 60 to 64 Years | 458 (7.6%) | 557 (8.6%) |
| 65 to 69 Years | 270 (4.5%) | 312 (4.8%) |
| 70 to 74 Years | 279 (4.6%) | 199 (3.1%) |
| 75 to 79 Years | 75 (1.2%) | 207 (3.2%) |
| 80 to 84 Years | 112 (1.8%) | 189 (2.9%) |
| 85 Years and over | 193 (3.2%) | 225 (3.5%) |
| Total | 6,040 (100.0%) | 6,487 (100.0%) |
Families and Households in Fortuna
Median Family Size in Fortuna
The median family size in Fortuna is 3.14 persons per family, with married-couple families (2,051 | 68.4%) accounting for the largest median family size of 3.3 persons per family. On the other hand, single male/father families (453 | 15.1%) represent the smallest median family size with 2.58 persons per family.
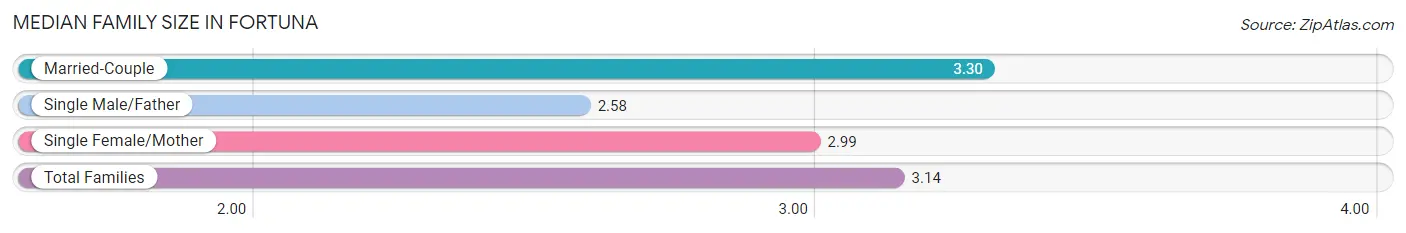
| Family Type | # Families | Family Size |
| Married-Couple | 2,051 (68.4%) | 3.30 |
| Single Male/Father | 453 (15.1%) | 2.58 |
| Single Female/Mother | 494 (16.5%) | 2.99 |
| Total Families | 2,998 (100.0%) | 3.14 |
Median Household Size in Fortuna
The median household size in Fortuna is 2.49 persons per household, with married-couple households (2,051 | 41.4%) accounting for the largest median household size of 3.32 persons per household. non-family households (1,957 | 39.5%) represent the smallest median household size with 1.28 persons per household.
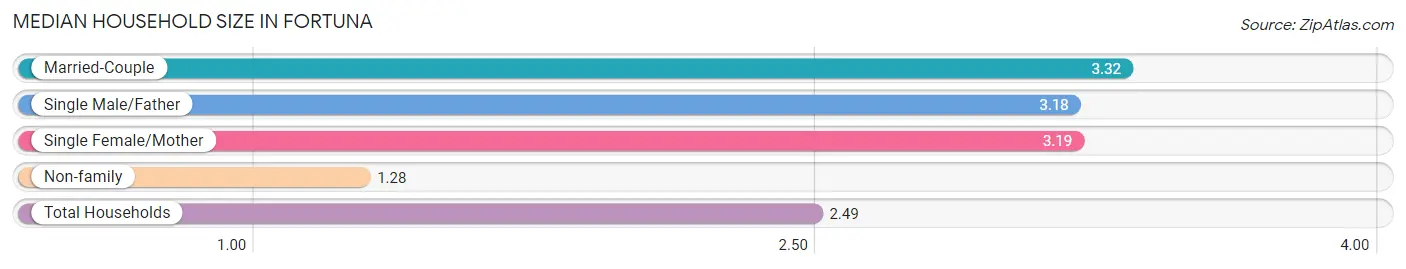
| Household Type | # Households | Household Size |
| Married-Couple | 2,051 (41.4%) | 3.32 |
| Single Male/Father | 453 (9.1%) | 3.18 |
| Single Female/Mother | 494 (10.0%) | 3.19 |
| Non-family | 1,957 (39.5%) | 1.28 |
| Total Households | 4,955 (100.0%) | 2.49 |
Household Size by Marriage Status in Fortuna
Out of a total of 4,955 households in Fortuna, 2,998 (60.5%) are family households, while 1,957 (39.5%) are nonfamily households. The most numerous type of family households are 2-person households, comprising 1,444, and the most common type of nonfamily households are 1-person households, comprising 1,415.
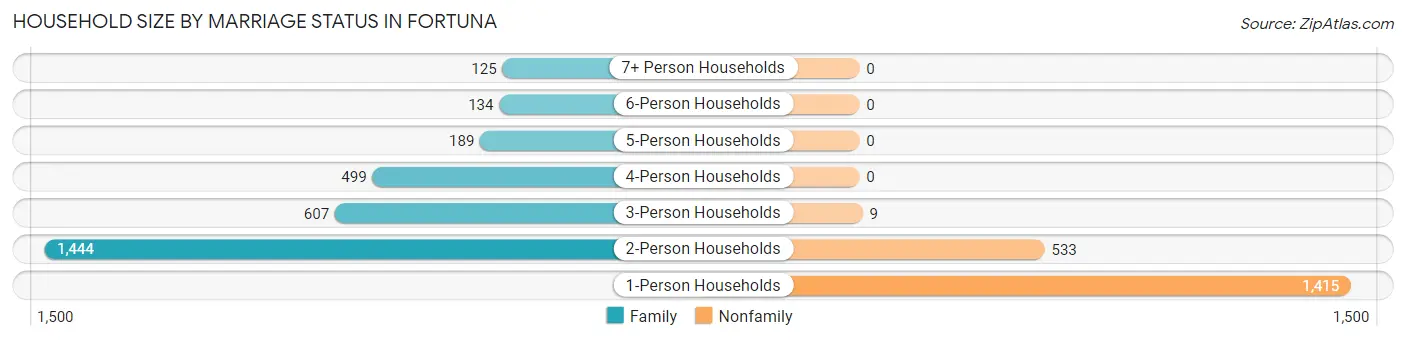
| Household Size | Family Households | Nonfamily Households |
| 1-Person Households | - | 1,415 (28.6%) |
| 2-Person Households | 1,444 (29.1%) | 533 (10.8%) |
| 3-Person Households | 607 (12.2%) | 9 (0.2%) |
| 4-Person Households | 499 (10.1%) | 0 (0.0%) |
| 5-Person Households | 189 (3.8%) | 0 (0.0%) |
| 6-Person Households | 134 (2.7%) | 0 (0.0%) |
| 7+ Person Households | 125 (2.5%) | 0 (0.0%) |
| Total | 2,998 (60.5%) | 1,957 (39.5%) |
Female Fertility in Fortuna
Fertility by Age in Fortuna
Average fertility rate in Fortuna is 25.0 births per 1,000 women. Women in the age bracket of 20 to 34 years have the highest fertility rate with 52.0 births per 1,000 women. Women in the age bracket of 20 to 34 years acount for 100.0% of all women with births.
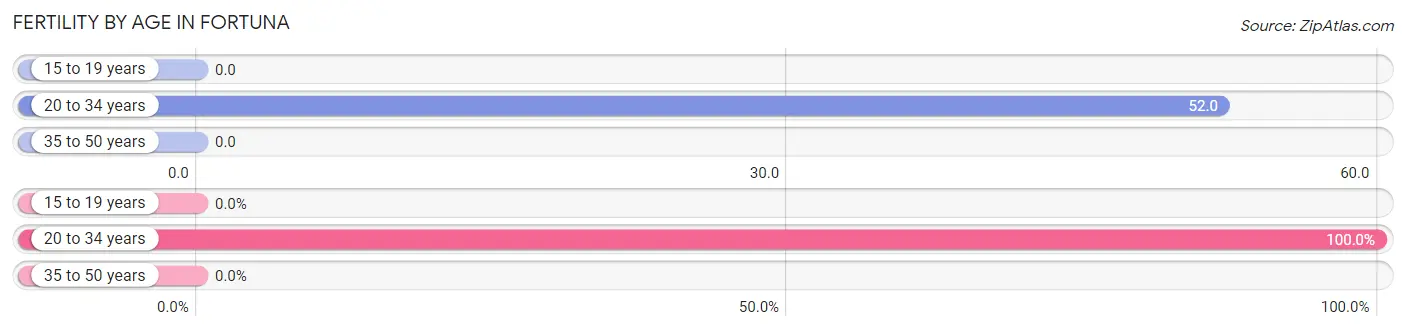
| Age Bracket | Women with Births | Births / 1,000 Women |
| 15 to 19 years | 0 (0.0%) | 0.0 |
| 20 to 34 years | 73 (100.0%) | 52.0 |
| 35 to 50 years | 0 (0.0%) | 0.0 |
| Total | 73 (100.0%) | 25.0 |
Fertility by Age by Marriage Status in Fortuna
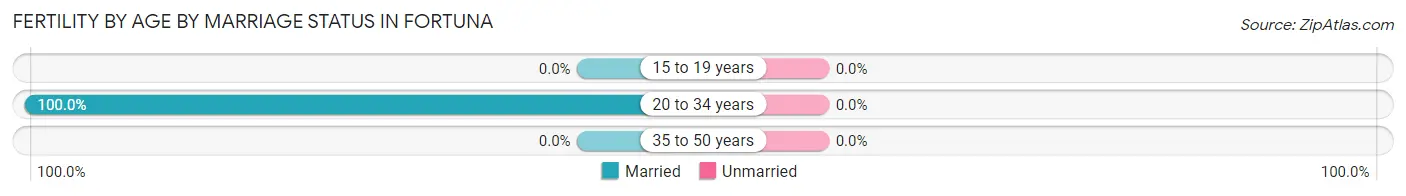
| Age Bracket | Married | Unmarried |
| 15 to 19 years | 0 (0.0%) | 0 (0.0%) |
| 20 to 34 years | 73 (100.0%) | 0 (0.0%) |
| 35 to 50 years | 0 (0.0%) | 0 (0.0%) |
| Total | 73 (100.0%) | 0 (0.0%) |
Fertility by Education in Fortuna
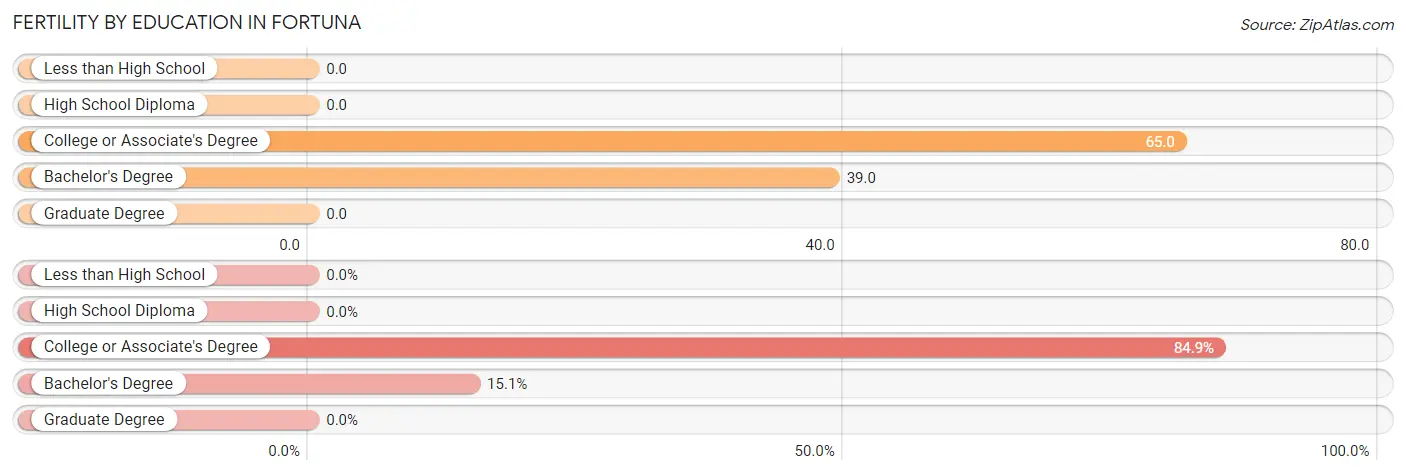
| Educational Attainment | Women with Births | Births / 1,000 Women |
| Less than High School | 0 (0.0%) | 0.0 |
| High School Diploma | 0 (0.0%) | 0.0 |
| College or Associate's Degree | 62 (84.9%) | 65.0 |
| Bachelor's Degree | 11 (15.1%) | 39.0 |
| Graduate Degree | 0 (0.0%) | 0.0 |
| Total | 73 (100.0%) | 25.0 |
Fertility by Education by Marriage Status in Fortuna
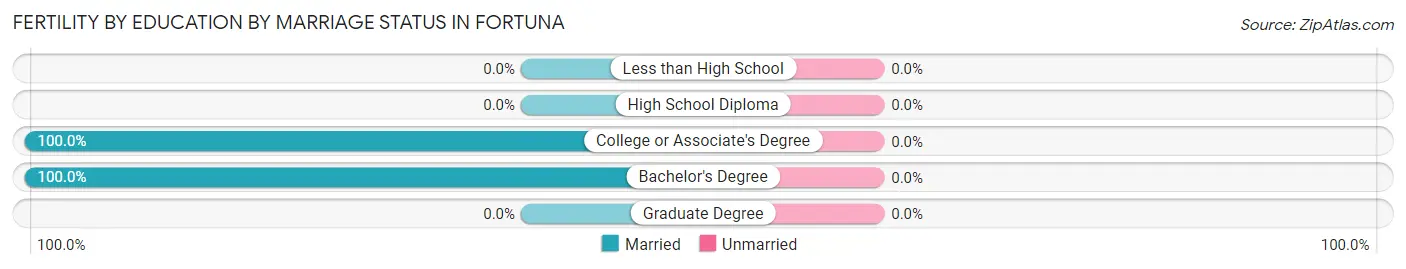
| Educational Attainment | Married | Unmarried |
| Less than High School | 0 (0.0%) | 0 (0.0%) |
| High School Diploma | 0 (0.0%) | 0 (0.0%) |
| College or Associate's Degree | 62 (100.0%) | 0 (0.0%) |
| Bachelor's Degree | 11 (100.0%) | 0 (0.0%) |
| Graduate Degree | 0 (0.0%) | 0 (0.0%) |
| Total | 73 (100.0%) | 0 (0.0%) |
Employment Characteristics in Fortuna
Employment by Class of Employer in Fortuna
Among the 5,526 employed individuals in Fortuna, private company employees (3,590 | 65.0%), local government employees (530 | 9.6%), and self-employed (not incorporated) (524 | 9.5%) make up the most common classes of employment.
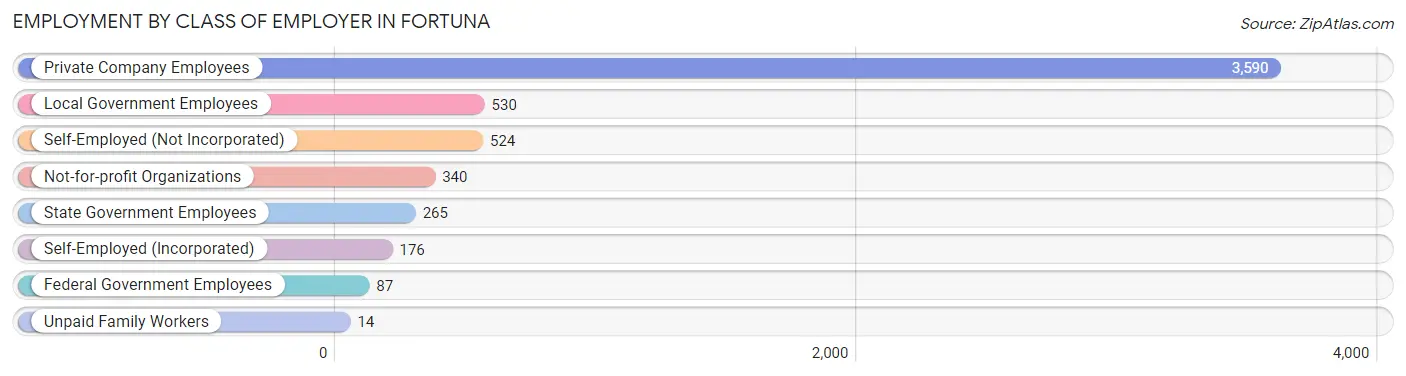
| Employer Class | # Employees | % Employees |
| Private Company Employees | 3,590 | 65.0% |
| Self-Employed (Incorporated) | 176 | 3.2% |
| Self-Employed (Not Incorporated) | 524 | 9.5% |
| Not-for-profit Organizations | 340 | 6.1% |
| Local Government Employees | 530 | 9.6% |
| State Government Employees | 265 | 4.8% |
| Federal Government Employees | 87 | 1.6% |
| Unpaid Family Workers | 14 | 0.3% |
| Total | 5,526 | 100.0% |
Employment Status by Age in Fortuna
According to the labor force statistics for Fortuna, out of the total population over 16 years of age (10,103), 58.8% or 5,941 individuals are in the labor force, with 5.3% or 315 of them unemployed. The age group with the highest labor force participation rate is 30 to 34 years, with 83.4% or 685 individuals in the labor force. Within the labor force, the 25 to 29 years age range has the highest percentage of unemployed individuals, with 10.3% or 72 of them being unemployed.
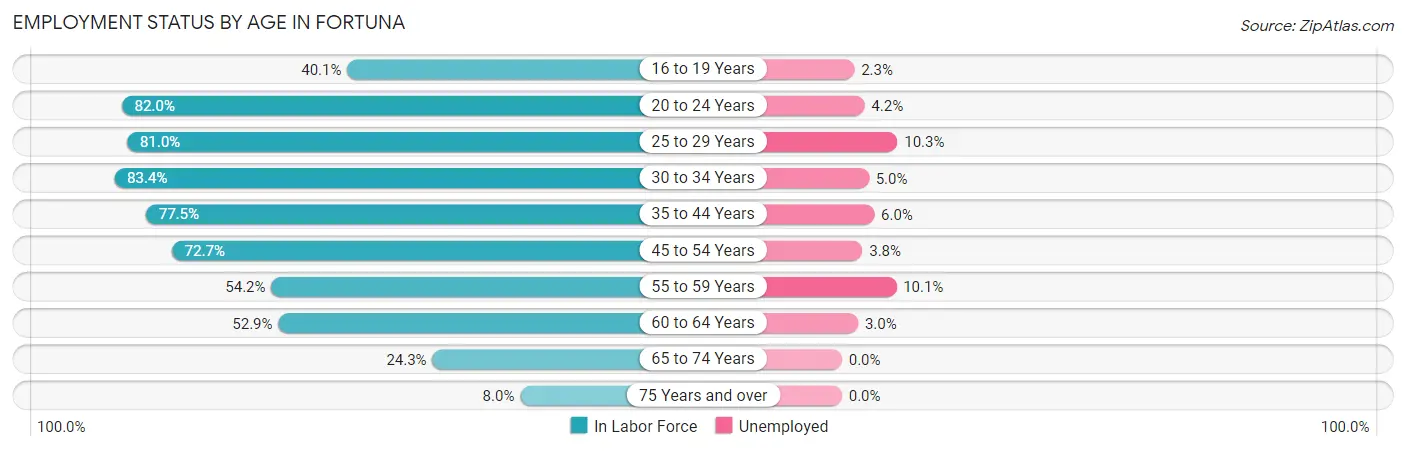
| Age Bracket | In Labor Force | Unemployed |
| 16 to 19 Years | 266 (40.1%) | 6 (2.3%) |
| 20 to 24 Years | 874 (82.0%) | 37 (4.2%) |
| 25 to 29 Years | 697 (81.0%) | 72 (10.3%) |
| 30 to 34 Years | 685 (83.4%) | 34 (5.0%) |
| 35 to 44 Years | 1,104 (77.5%) | 66 (6.0%) |
| 45 to 54 Years | 995 (72.7%) | 38 (3.8%) |
| 55 to 59 Years | 447 (54.2%) | 45 (10.1%) |
| 60 to 64 Years | 537 (52.9%) | 16 (3.0%) |
| 65 to 74 Years | 258 (24.3%) | 0 (0.0%) |
| 75 Years and over | 80 (8.0%) | 0 (0.0%) |
| Total | 5,941 (58.8%) | 315 (5.3%) |
Employment Status by Educational Attainment in Fortuna
According to labor force statistics for Fortuna, 70.7% of individuals (4,463) out of the total population between 25 and 64 years of age (6,313) are in the labor force, with 6.0% or 268 of them being unemployed. The group with the highest labor force participation rate are those with the educational attainment of bachelor's degree or higher, with 83.7% or 1,024 individuals in the labor force. Within the labor force, individuals with college / associate degree education have the highest percentage of unemployment, with 10.1% or 168 of them being unemployed.
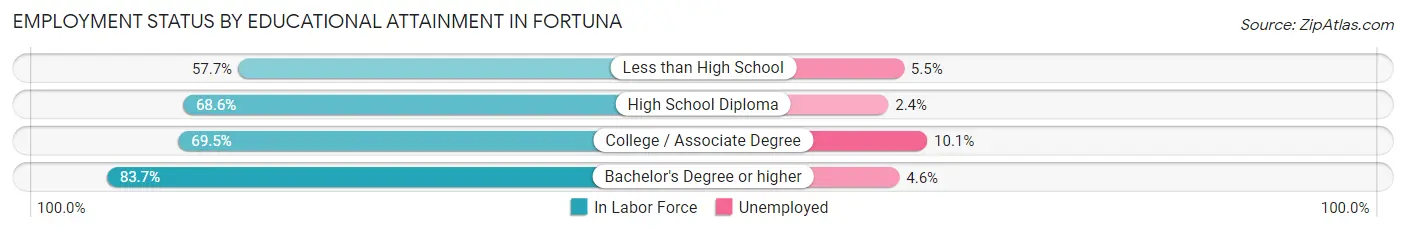
| Educational Attainment | In Labor Force | Unemployed |
| Less than High School | 380 (57.7%) | 36 (5.5%) |
| High School Diploma | 1,396 (68.6%) | 49 (2.4%) |
| College / Associate Degree | 1,665 (69.5%) | 242 (10.1%) |
| Bachelor's Degree or higher | 1,024 (83.7%) | 56 (4.6%) |
| Total | 4,463 (70.7%) | 379 (6.0%) |
Employment Occupations by Sex in Fortuna
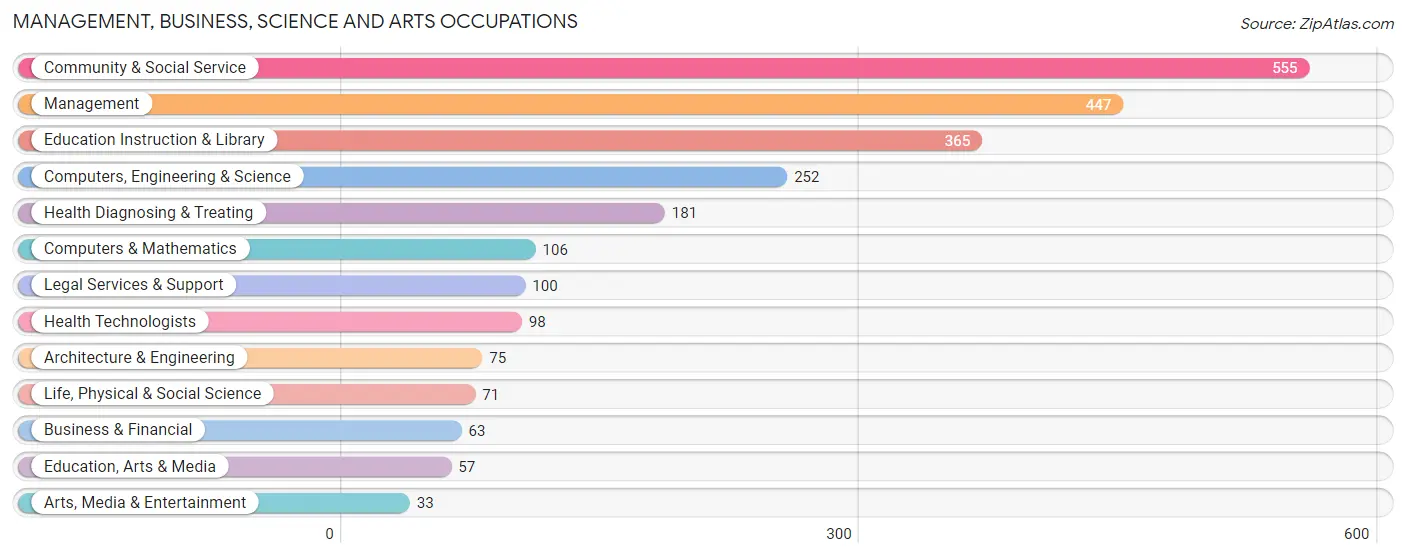
Management, Business, Science and Arts Occupations
The most common Management, Business, Science and Arts occupations in Fortuna are Community & Social Service (555 | 9.9%), Management (447 | 8.0%), Education Instruction & Library (365 | 6.5%), Computers, Engineering & Science (252 | 4.5%), and Health Diagnosing & Treating (181 | 3.2%).
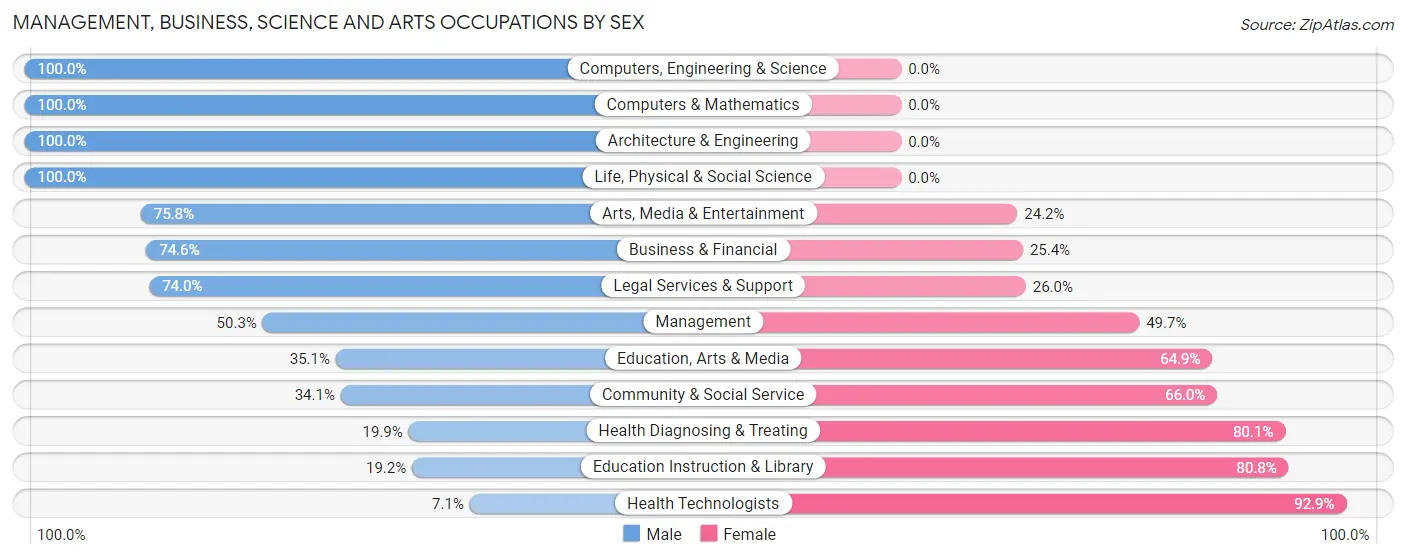
Management, Business, Science and Arts Occupations by Sex
Within the Management, Business, Science and Arts occupations in Fortuna, the most male-oriented occupations are Computers, Engineering & Science (100.0%), Computers & Mathematics (100.0%), and Architecture & Engineering (100.0%), while the most female-oriented occupations are Health Technologists (92.9%), Education Instruction & Library (80.8%), and Health Diagnosing & Treating (80.1%).
| Occupation | Male | Female |
| Management | 225 (50.3%) | 222 (49.7%) |
| Business & Financial | 47 (74.6%) | 16 (25.4%) |
| Computers, Engineering & Science | 252 (100.0%) | 0 (0.0%) |
| Computers & Mathematics | 106 (100.0%) | 0 (0.0%) |
| Architecture & Engineering | 75 (100.0%) | 0 (0.0%) |
| Life, Physical & Social Science | 71 (100.0%) | 0 (0.0%) |
| Community & Social Service | 189 (34.1%) | 366 (65.9%) |
| Education, Arts & Media | 20 (35.1%) | 37 (64.9%) |
| Legal Services & Support | 74 (74.0%) | 26 (26.0%) |
| Education Instruction & Library | 70 (19.2%) | 295 (80.8%) |
| Arts, Media & Entertainment | 25 (75.8%) | 8 (24.2%) |
| Health Diagnosing & Treating | 36 (19.9%) | 145 (80.1%) |
| Health Technologists | 7 (7.1%) | 91 (92.9%) |
| Total (Category) | 749 (50.0%) | 749 (50.0%) |
| Total (Overall) | 3,101 (55.2%) | 2,513 (44.8%) |
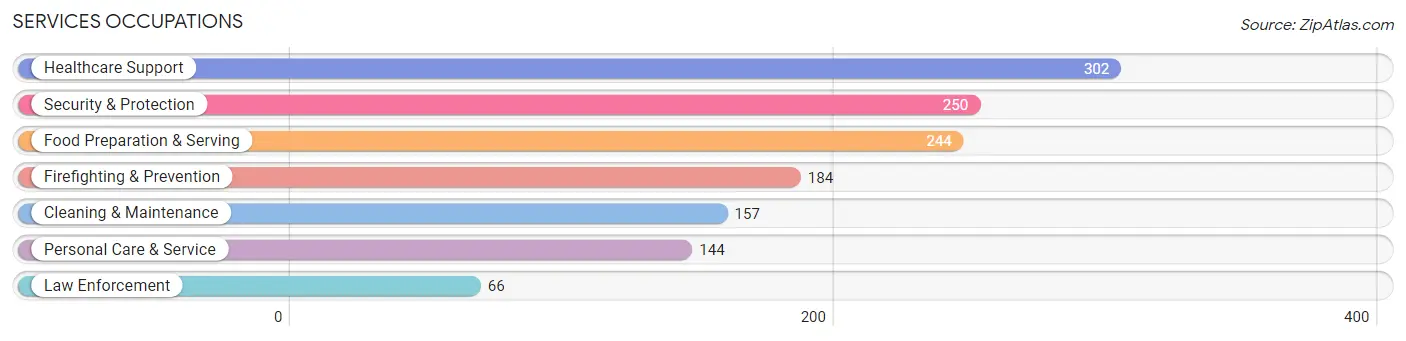
Services Occupations
The most common Services occupations in Fortuna are Healthcare Support (302 | 5.4%), Security & Protection (250 | 4.4%), Food Preparation & Serving (244 | 4.3%), Firefighting & Prevention (184 | 3.3%), and Cleaning & Maintenance (157 | 2.8%).
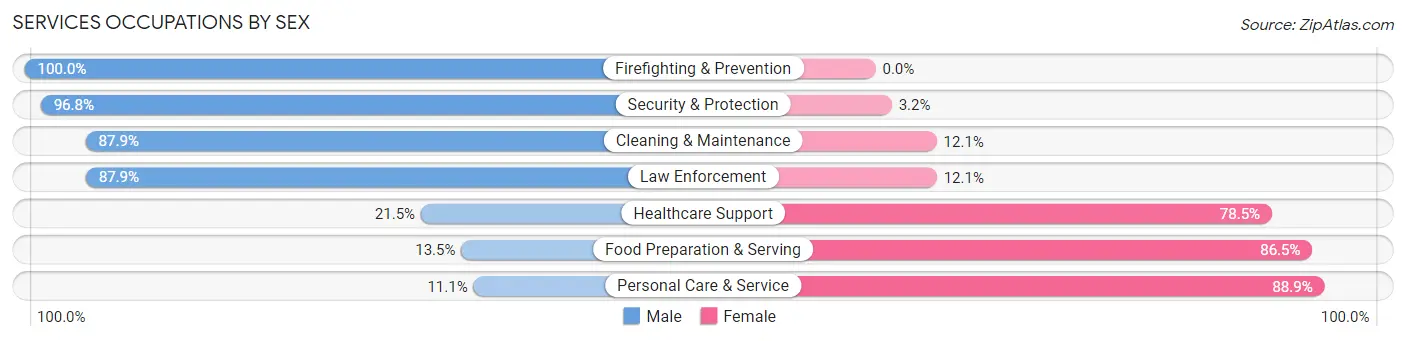
Services Occupations by Sex
Within the Services occupations in Fortuna, the most male-oriented occupations are Firefighting & Prevention (100.0%), Security & Protection (96.8%), and Cleaning & Maintenance (87.9%), while the most female-oriented occupations are Personal Care & Service (88.9%), Food Preparation & Serving (86.5%), and Healthcare Support (78.5%).
| Occupation | Male | Female |
| Healthcare Support | 65 (21.5%) | 237 (78.5%) |
| Security & Protection | 242 (96.8%) | 8 (3.2%) |
| Firefighting & Prevention | 184 (100.0%) | 0 (0.0%) |
| Law Enforcement | 58 (87.9%) | 8 (12.1%) |
| Food Preparation & Serving | 33 (13.5%) | 211 (86.5%) |
| Cleaning & Maintenance | 138 (87.9%) | 19 (12.1%) |
| Personal Care & Service | 16 (11.1%) | 128 (88.9%) |
| Total (Category) | 494 (45.0%) | 603 (55.0%) |
| Total (Overall) | 3,101 (55.2%) | 2,513 (44.8%) |
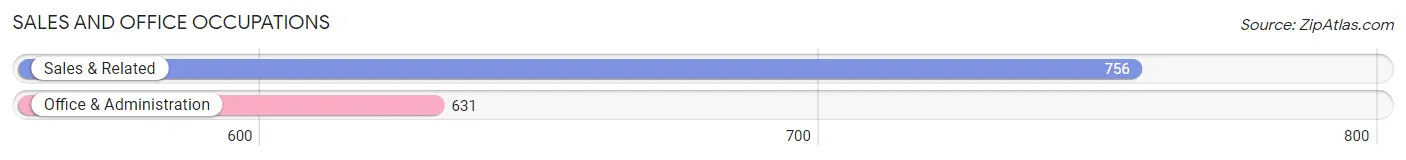
Sales and Office Occupations
The most common Sales and Office occupations in Fortuna are Sales & Related (756 | 13.5%), and Office & Administration (631 | 11.2%).
Sales and Office Occupations by Sex
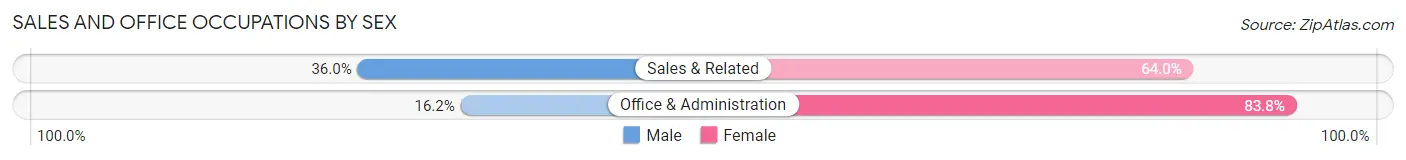
| Occupation | Male | Female |
| Sales & Related | 272 (36.0%) | 484 (64.0%) |
| Office & Administration | 102 (16.2%) | 529 (83.8%) |
| Total (Category) | 374 (27.0%) | 1,013 (73.0%) |
| Total (Overall) | 3,101 (55.2%) | 2,513 (44.8%) |
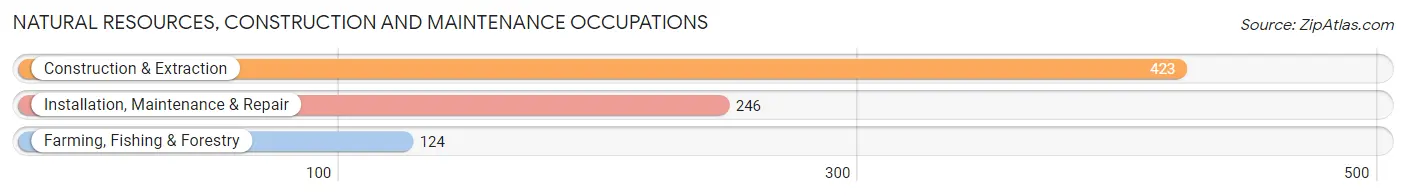
Natural Resources, Construction and Maintenance Occupations
The most common Natural Resources, Construction and Maintenance occupations in Fortuna are Construction & Extraction (423 | 7.5%), Installation, Maintenance & Repair (246 | 4.4%), and Farming, Fishing & Forestry (124 | 2.2%).
Natural Resources, Construction and Maintenance Occupations by Sex
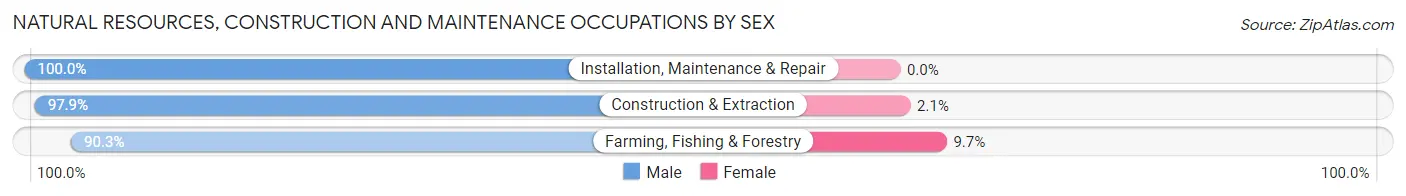
| Occupation | Male | Female |
| Farming, Fishing & Forestry | 112 (90.3%) | 12 (9.7%) |
| Construction & Extraction | 414 (97.9%) | 9 (2.1%) |
| Installation, Maintenance & Repair | 246 (100.0%) | 0 (0.0%) |
| Total (Category) | 772 (97.4%) | 21 (2.6%) |
| Total (Overall) | 3,101 (55.2%) | 2,513 (44.8%) |
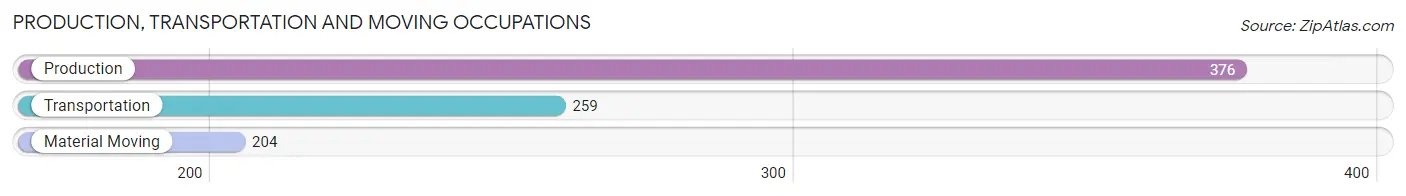
Production, Transportation and Moving Occupations
The most common Production, Transportation and Moving occupations in Fortuna are Production (376 | 6.7%), Transportation (259 | 4.6%), and Material Moving (204 | 3.6%).
Production, Transportation and Moving Occupations by Sex
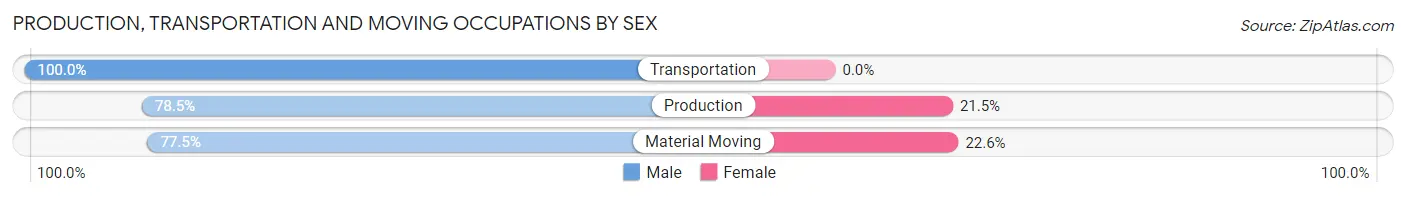
| Occupation | Male | Female |
| Production | 295 (78.5%) | 81 (21.5%) |
| Transportation | 259 (100.0%) | 0 (0.0%) |
| Material Moving | 158 (77.4%) | 46 (22.6%) |
| Total (Category) | 712 (84.9%) | 127 (15.1%) |
| Total (Overall) | 3,101 (55.2%) | 2,513 (44.8%) |
Employment Industries by Sex in Fortuna
Employment Industries in Fortuna
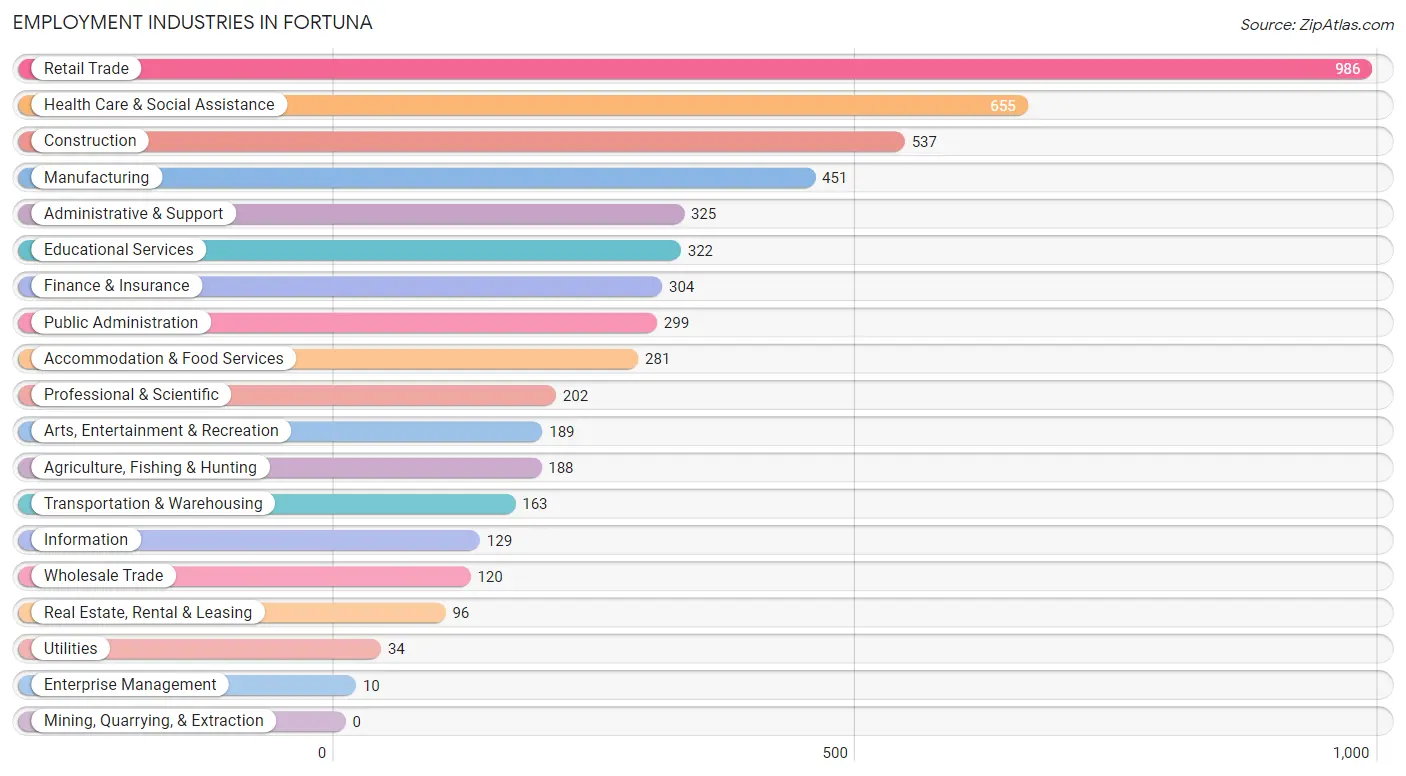
The major employment industries in Fortuna include Retail Trade (986 | 17.6%), Health Care & Social Assistance (655 | 11.7%), Construction (537 | 9.6%), Manufacturing (451 | 8.0%), and Administrative & Support (325 | 5.8%).
Employment Industries by Sex in Fortuna
The Fortuna industries that see more men than women are Utilities (100.0%), Information (100.0%), and Transportation & Warehousing (95.1%), whereas the industries that tend to have a higher number of women are Enterprise Management (100.0%), Real Estate, Rental & Leasing (82.3%), and Health Care & Social Assistance (81.8%).
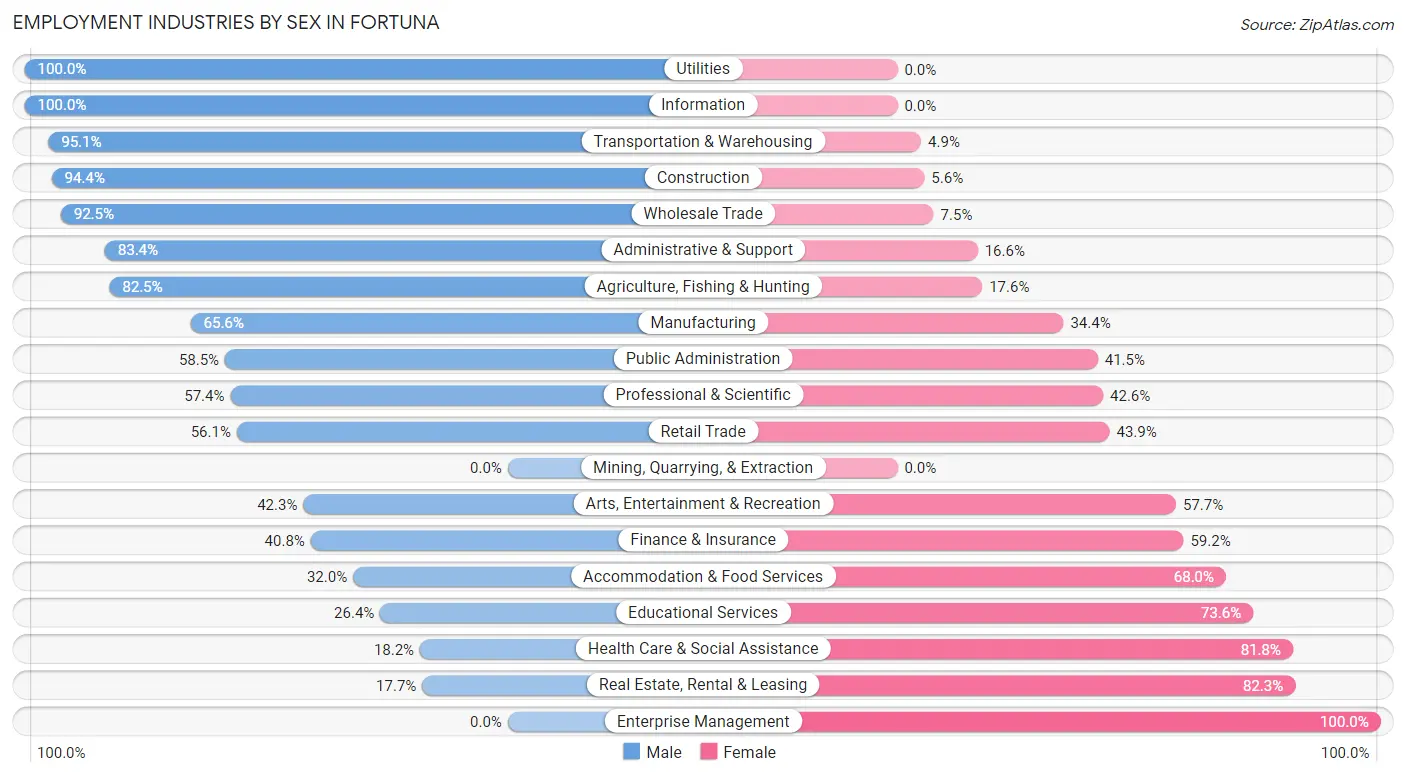
| Industry | Male | Female |
| Agriculture, Fishing & Hunting | 155 (82.5%) | 33 (17.5%) |
| Mining, Quarrying, & Extraction | 0 (0.0%) | 0 (0.0%) |
| Construction | 507 (94.4%) | 30 (5.6%) |
| Manufacturing | 296 (65.6%) | 155 (34.4%) |
| Wholesale Trade | 111 (92.5%) | 9 (7.5%) |
| Retail Trade | 553 (56.1%) | 433 (43.9%) |
| Transportation & Warehousing | 155 (95.1%) | 8 (4.9%) |
| Utilities | 34 (100.0%) | 0 (0.0%) |
| Information | 129 (100.0%) | 0 (0.0%) |
| Finance & Insurance | 124 (40.8%) | 180 (59.2%) |
| Real Estate, Rental & Leasing | 17 (17.7%) | 79 (82.3%) |
| Professional & Scientific | 116 (57.4%) | 86 (42.6%) |
| Enterprise Management | 0 (0.0%) | 10 (100.0%) |
| Administrative & Support | 271 (83.4%) | 54 (16.6%) |
| Educational Services | 85 (26.4%) | 237 (73.6%) |
| Health Care & Social Assistance | 119 (18.2%) | 536 (81.8%) |
| Arts, Entertainment & Recreation | 80 (42.3%) | 109 (57.7%) |
| Accommodation & Food Services | 90 (32.0%) | 191 (68.0%) |
| Public Administration | 175 (58.5%) | 124 (41.5%) |
| Total | 3,101 (55.2%) | 2,513 (44.8%) |
Education in Fortuna
School Enrollment in Fortuna
The most common levels of schooling among the 2,943 students in Fortuna are elementary school (673 | 22.9%), college / undergraduate (649 | 22.1%), and high school (629 | 21.4%).
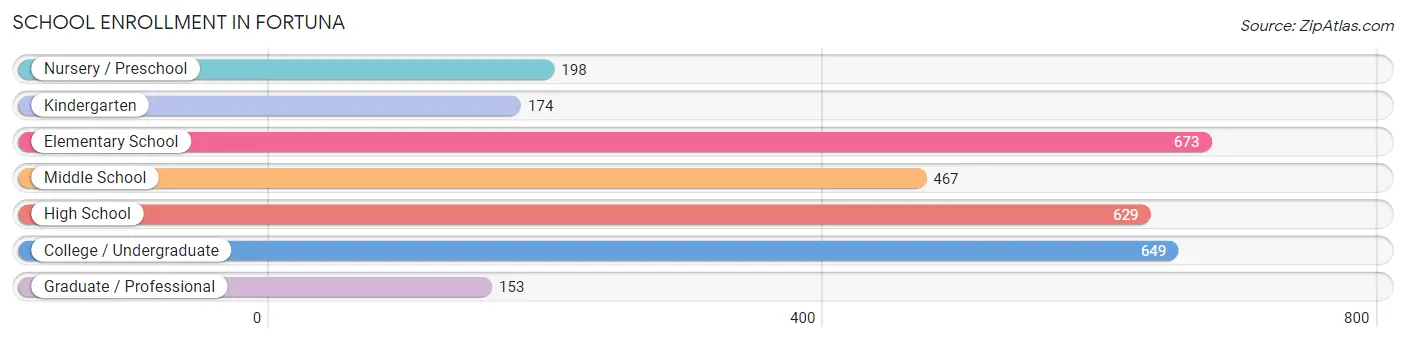
| School Level | # Students | % Students |
| Nursery / Preschool | 198 | 6.7% |
| Kindergarten | 174 | 5.9% |
| Elementary School | 673 | 22.9% |
| Middle School | 467 | 15.9% |
| High School | 629 | 21.4% |
| College / Undergraduate | 649 | 22.1% |
| Graduate / Professional | 153 | 5.2% |
| Total | 2,943 | 100.0% |
School Enrollment by Age by Funding Source in Fortuna
Out of a total of 2,943 students who are enrolled in schools in Fortuna, 250 (8.5%) attend a private institution, while the remaining 2,693 (91.5%) are enrolled in public schools. The age group of 3 to 4 year olds has the highest likelihood of being enrolled in private schools, with 95 (69.9% in the age bracket) enrolled. Conversely, the age group of 15 to 17 year olds has the lowest likelihood of being enrolled in a private school, with 512 (100.0% in the age bracket) attending a public institution.
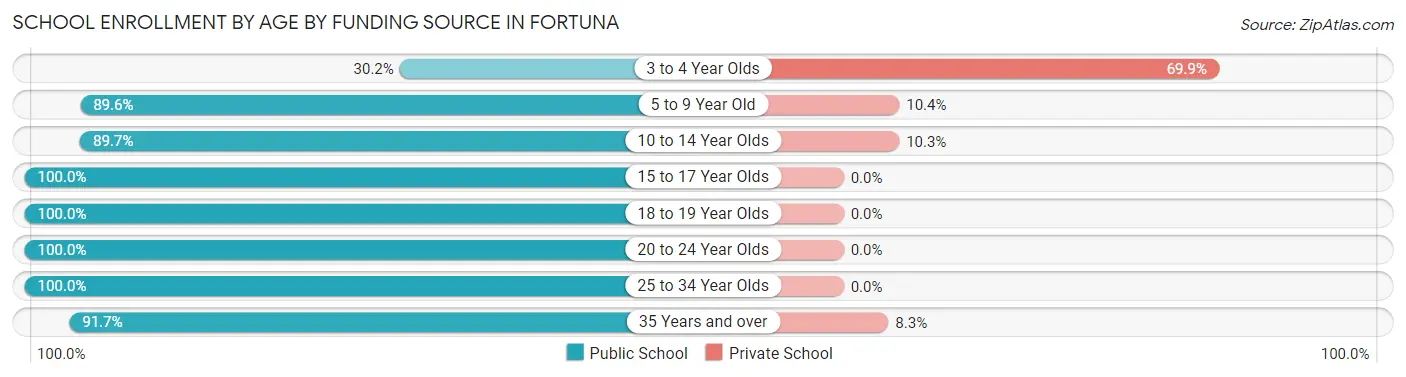
| Age Bracket | Public School | Private School |
| 3 to 4 Year Olds | 41 (30.1%) | 95 (69.9%) |
| 5 to 9 Year Old | 744 (89.6%) | 86 (10.4%) |
| 10 to 14 Year Olds | 529 (89.7%) | 61 (10.3%) |
| 15 to 17 Year Olds | 512 (100.0%) | 0 (0.0%) |
| 18 to 19 Year Olds | 225 (100.0%) | 0 (0.0%) |
| 20 to 24 Year Olds | 411 (100.0%) | 0 (0.0%) |
| 25 to 34 Year Olds | 143 (100.0%) | 0 (0.0%) |
| 35 Years and over | 88 (91.7%) | 8 (8.3%) |
| Total | 2,693 (91.5%) | 250 (8.5%) |
Educational Attainment by Field of Study in Fortuna
Business (261 | 14.6%), bio, nature & agricultural (242 | 13.5%), education (227 | 12.7%), science & technology (168 | 9.4%), and psychology (127 | 7.1%) are the most common fields of study among 1,791 individuals in Fortuna who have obtained a bachelor's degree or higher.
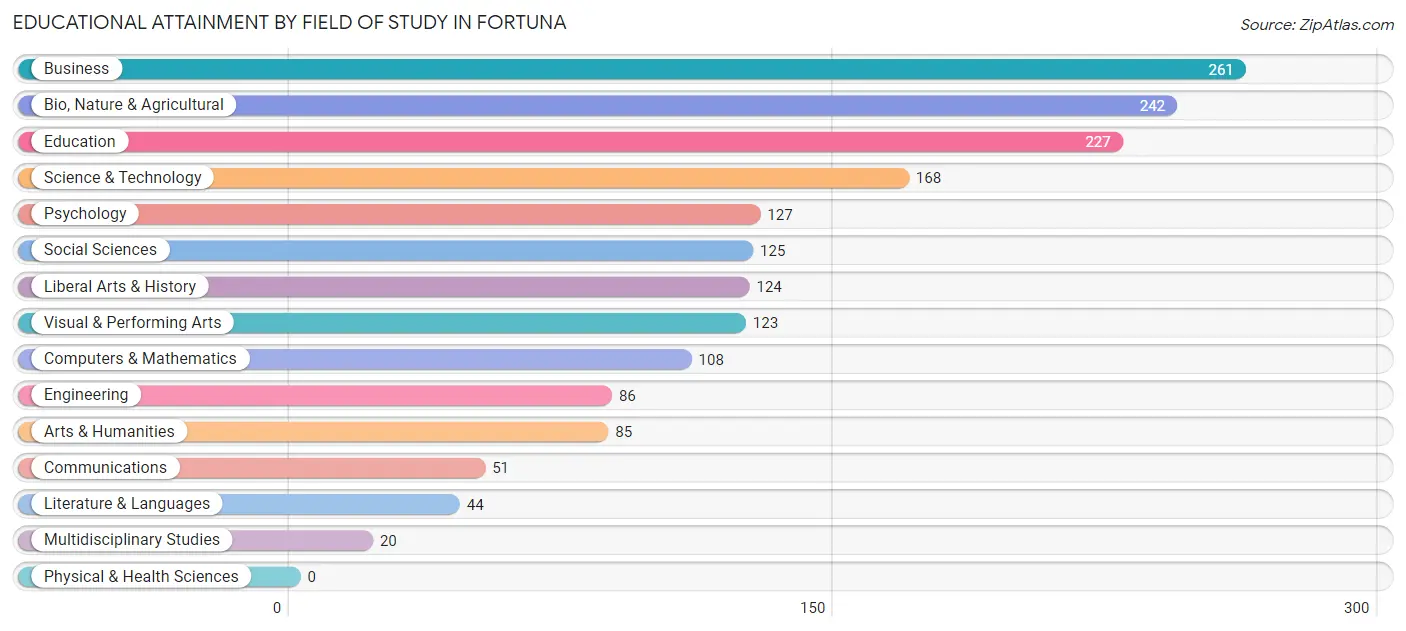
| Field of Study | # Graduates | % Graduates |
| Computers & Mathematics | 108 | 6.0% |
| Bio, Nature & Agricultural | 242 | 13.5% |
| Physical & Health Sciences | 0 | 0.0% |
| Psychology | 127 | 7.1% |
| Social Sciences | 125 | 7.0% |
| Engineering | 86 | 4.8% |
| Multidisciplinary Studies | 20 | 1.1% |
| Science & Technology | 168 | 9.4% |
| Business | 261 | 14.6% |
| Education | 227 | 12.7% |
| Literature & Languages | 44 | 2.5% |
| Liberal Arts & History | 124 | 6.9% |
| Visual & Performing Arts | 123 | 6.9% |
| Communications | 51 | 2.9% |
| Arts & Humanities | 85 | 4.8% |
| Total | 1,791 | 100.0% |
Transportation & Commute in Fortuna
Vehicle Availability by Sex in Fortuna
The most prevalent vehicle ownership categories in Fortuna are males with 2 vehicles (1,252, accounting for 40.7%) and females with 2 vehicles (988, making up 51.2%).
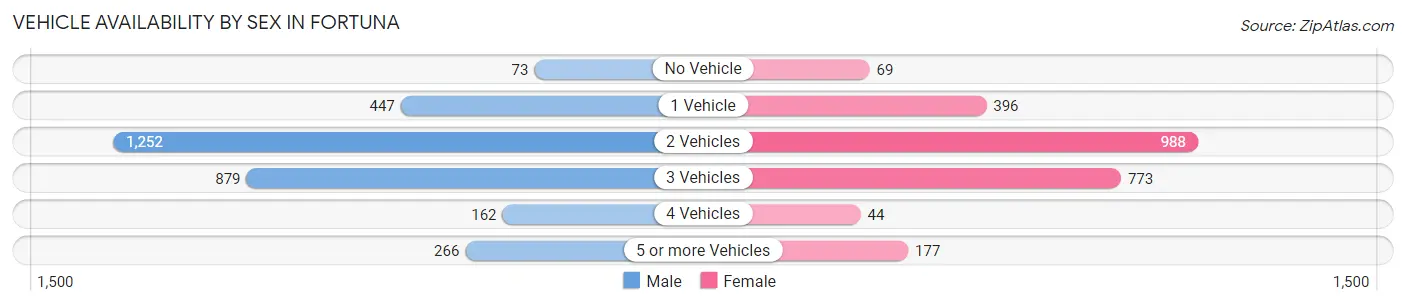
| Vehicles Available | Male | Female |
| No Vehicle | 73 (2.4%) | 69 (2.8%) |
| 1 Vehicle | 447 (14.5%) | 396 (16.2%) |
| 2 Vehicles | 1,252 (40.7%) | 988 (40.4%) |
| 3 Vehicles | 879 (28.5%) | 773 (31.6%) |
| 4 Vehicles | 162 (5.3%) | 44 (1.8%) |
| 5 or more Vehicles | 266 (8.6%) | 177 (7.2%) |
| Total | 3,079 (100.0%) | 2,447 (100.0%) |
Commute Time in Fortuna
The most frequently occuring commute durations in Fortuna are 5 to 9 minutes (1,638 commuters, 31.1%), 10 to 14 minutes (707 commuters, 13.4%), and 30 to 34 minutes (575 commuters, 10.9%).
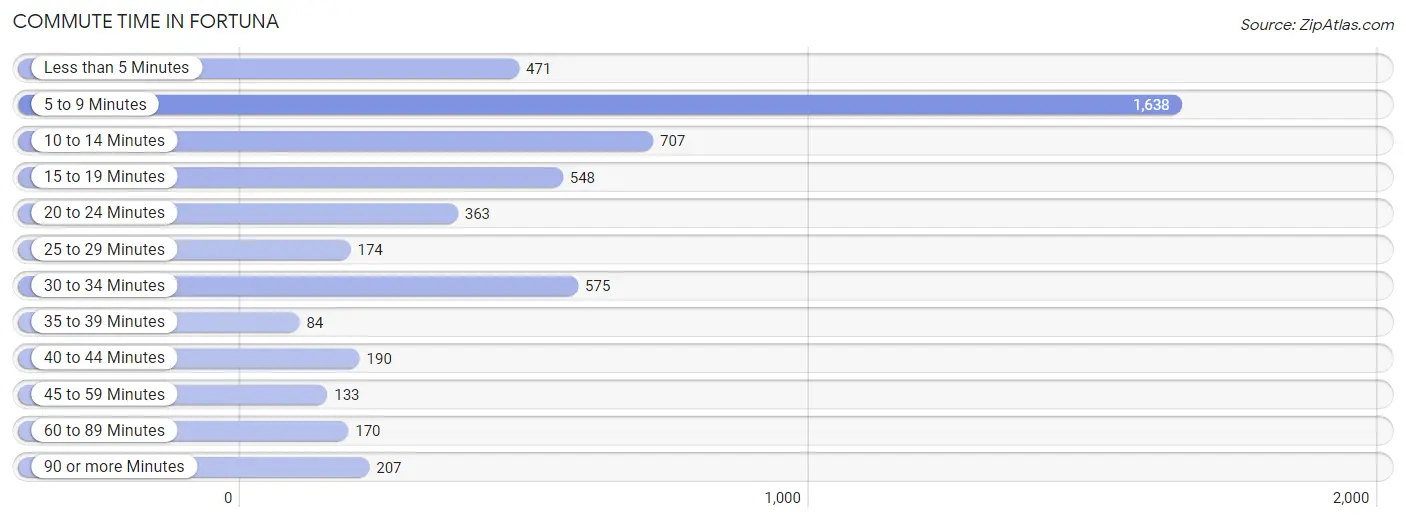
| Commute Time | # Commuters | % Commuters |
| Less than 5 Minutes | 471 | 8.9% |
| 5 to 9 Minutes | 1,638 | 31.1% |
| 10 to 14 Minutes | 707 | 13.4% |
| 15 to 19 Minutes | 548 | 10.4% |
| 20 to 24 Minutes | 363 | 6.9% |
| 25 to 29 Minutes | 174 | 3.3% |
| 30 to 34 Minutes | 575 | 10.9% |
| 35 to 39 Minutes | 84 | 1.6% |
| 40 to 44 Minutes | 190 | 3.6% |
| 45 to 59 Minutes | 133 | 2.5% |
| 60 to 89 Minutes | 170 | 3.2% |
| 90 or more Minutes | 207 | 3.9% |
Commute Time by Sex in Fortuna
The most common commute times in Fortuna are 5 to 9 minutes (684 commuters, 23.2%) for males and 5 to 9 minutes (954 commuters, 41.2%) for females.
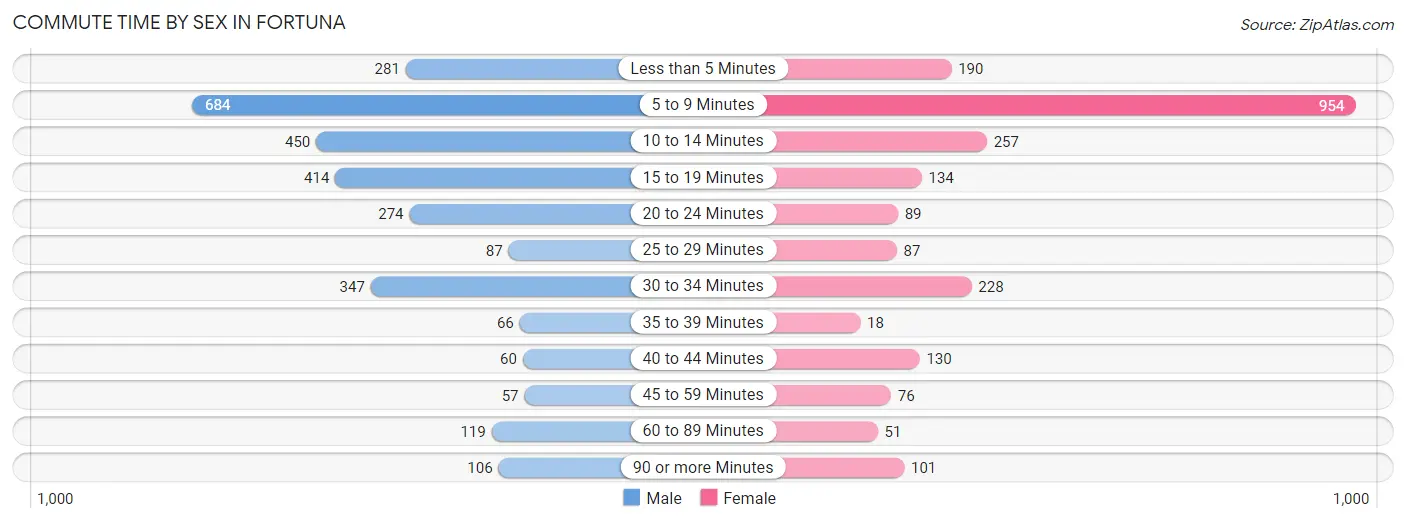
| Commute Time | Male | Female |
| Less than 5 Minutes | 281 (9.5%) | 190 (8.2%) |
| 5 to 9 Minutes | 684 (23.2%) | 954 (41.2%) |
| 10 to 14 Minutes | 450 (15.3%) | 257 (11.1%) |
| 15 to 19 Minutes | 414 (14.1%) | 134 (5.8%) |
| 20 to 24 Minutes | 274 (9.3%) | 89 (3.8%) |
| 25 to 29 Minutes | 87 (2.9%) | 87 (3.8%) |
| 30 to 34 Minutes | 347 (11.8%) | 228 (9.9%) |
| 35 to 39 Minutes | 66 (2.2%) | 18 (0.8%) |
| 40 to 44 Minutes | 60 (2.0%) | 130 (5.6%) |
| 45 to 59 Minutes | 57 (1.9%) | 76 (3.3%) |
| 60 to 89 Minutes | 119 (4.0%) | 51 (2.2%) |
| 90 or more Minutes | 106 (3.6%) | 101 (4.4%) |
Time of Departure to Work by Sex in Fortuna
The most frequent times of departure to work in Fortuna are 7:30 AM to 7:59 AM (442, 15.0%) for males and 8:00 AM to 8:29 AM (357, 15.4%) for females.
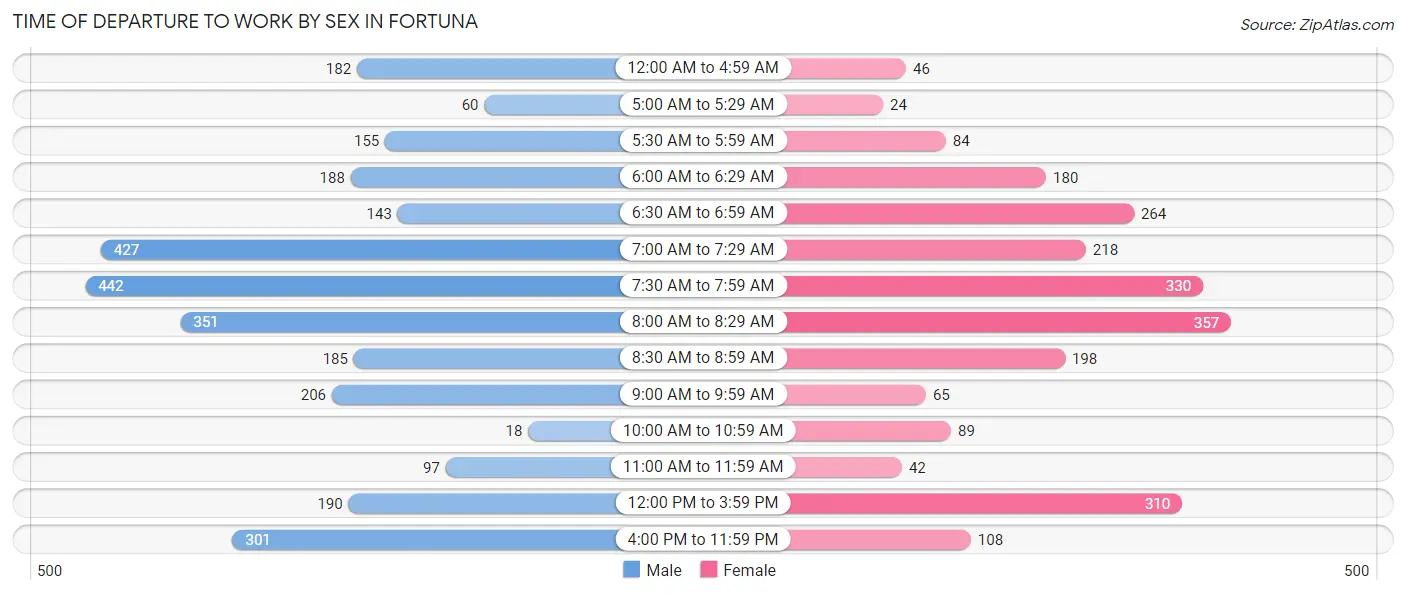
| Time of Departure | Male | Female |
| 12:00 AM to 4:59 AM | 182 (6.2%) | 46 (2.0%) |
| 5:00 AM to 5:29 AM | 60 (2.0%) | 24 (1.0%) |
| 5:30 AM to 5:59 AM | 155 (5.3%) | 84 (3.6%) |
| 6:00 AM to 6:29 AM | 188 (6.4%) | 180 (7.8%) |
| 6:30 AM to 6:59 AM | 143 (4.9%) | 264 (11.4%) |
| 7:00 AM to 7:29 AM | 427 (14.5%) | 218 (9.4%) |
| 7:30 AM to 7:59 AM | 442 (15.0%) | 330 (14.2%) |
| 8:00 AM to 8:29 AM | 351 (11.9%) | 357 (15.4%) |
| 8:30 AM to 8:59 AM | 185 (6.3%) | 198 (8.6%) |
| 9:00 AM to 9:59 AM | 206 (7.0%) | 65 (2.8%) |
| 10:00 AM to 10:59 AM | 18 (0.6%) | 89 (3.8%) |
| 11:00 AM to 11:59 AM | 97 (3.3%) | 42 (1.8%) |
| 12:00 PM to 3:59 PM | 190 (6.5%) | 310 (13.4%) |
| 4:00 PM to 11:59 PM | 301 (10.2%) | 108 (4.7%) |
| Total | 2,945 (100.0%) | 2,315 (100.0%) |
Housing Occupancy in Fortuna
Occupancy by Ownership in Fortuna
Of the total 4,955 dwellings in Fortuna, owner-occupied units account for 2,811 (56.7%), while renter-occupied units make up 2,144 (43.3%).
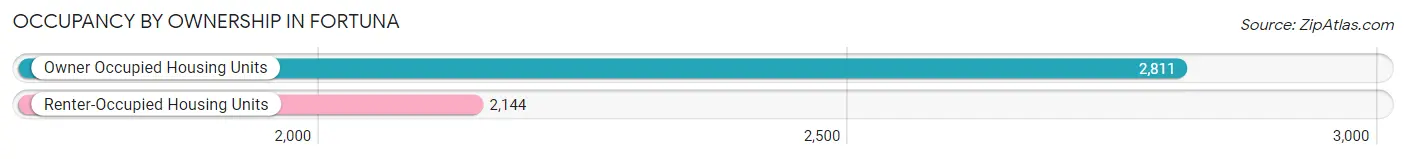
| Occupancy | # Housing Units | % Housing Units |
| Owner Occupied Housing Units | 2,811 | 56.7% |
| Renter-Occupied Housing Units | 2,144 | 43.3% |
| Total Occupied Housing Units | 4,955 | 100.0% |
Occupancy by Household Size in Fortuna
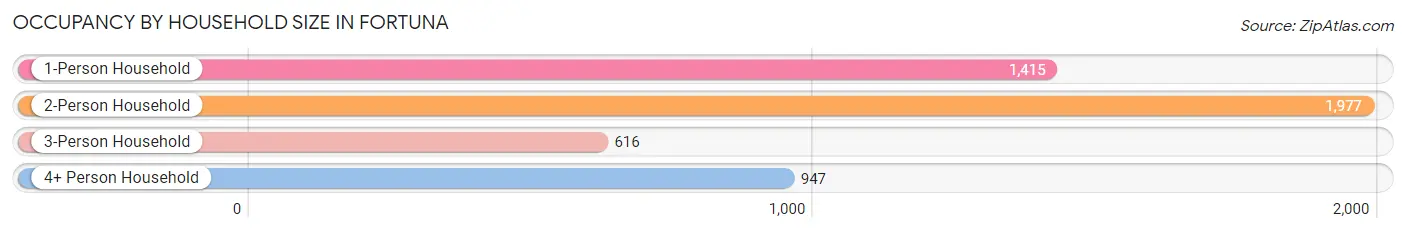
| Household Size | # Housing Units | % Housing Units |
| 1-Person Household | 1,415 | 28.6% |
| 2-Person Household | 1,977 | 39.9% |
| 3-Person Household | 616 | 12.4% |
| 4+ Person Household | 947 | 19.1% |
| Total Housing Units | 4,955 | 100.0% |
Occupancy by Ownership by Household Size in Fortuna
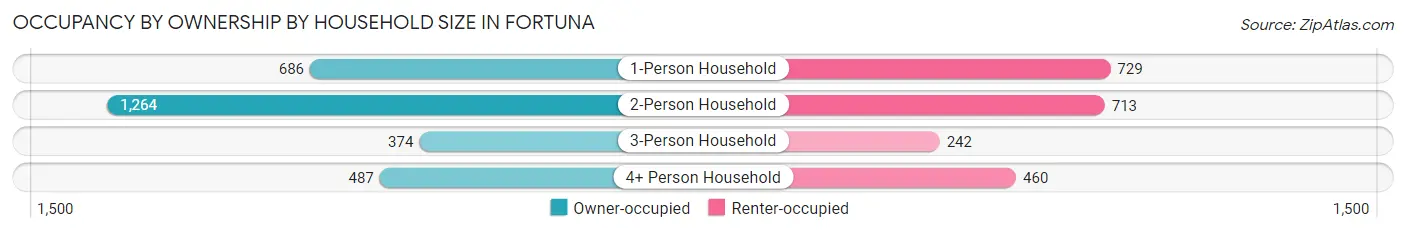
| Household Size | Owner-occupied | Renter-occupied |
| 1-Person Household | 686 (48.5%) | 729 (51.5%) |
| 2-Person Household | 1,264 (63.9%) | 713 (36.1%) |
| 3-Person Household | 374 (60.7%) | 242 (39.3%) |
| 4+ Person Household | 487 (51.4%) | 460 (48.6%) |
| Total Housing Units | 2,811 (56.7%) | 2,144 (43.3%) |
Occupancy by Educational Attainment in Fortuna
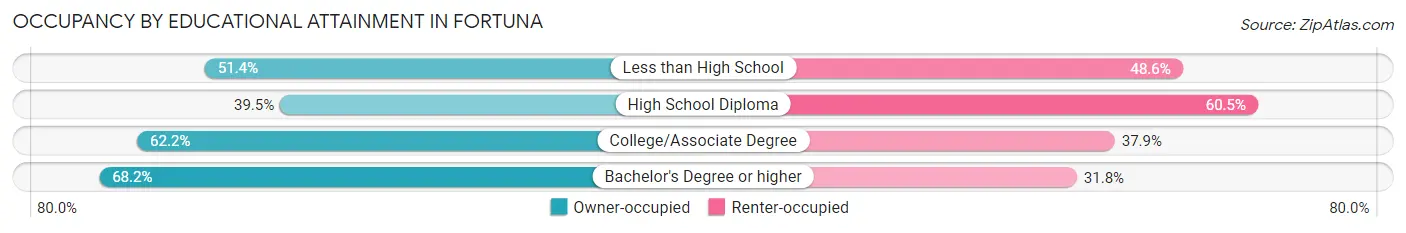
| Household Size | Owner-occupied | Renter-occupied |
| Less than High School | 237 (51.4%) | 224 (48.6%) |
| High School Diploma | 503 (39.5%) | 771 (60.5%) |
| College/Associate Degree | 1,281 (62.2%) | 780 (37.9%) |
| Bachelor's Degree or higher | 790 (68.2%) | 369 (31.8%) |
Occupancy by Age of Householder in Fortuna
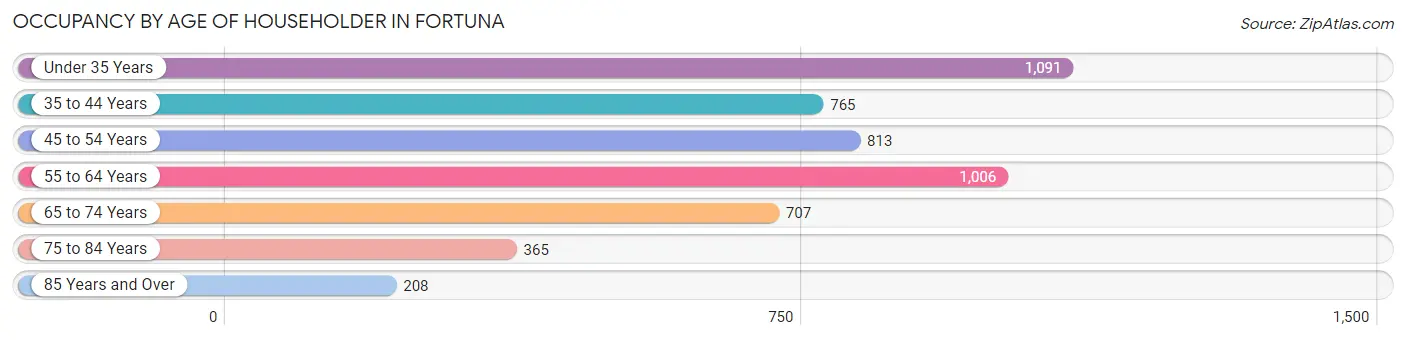
| Age Bracket | # Households | % Households |
| Under 35 Years | 1,091 | 22.0% |
| 35 to 44 Years | 765 | 15.4% |
| 45 to 54 Years | 813 | 16.4% |
| 55 to 64 Years | 1,006 | 20.3% |
| 65 to 74 Years | 707 | 14.3% |
| 75 to 84 Years | 365 | 7.4% |
| 85 Years and Over | 208 | 4.2% |
| Total | 4,955 | 100.0% |
Housing Finances in Fortuna
Median Income by Occupancy in Fortuna
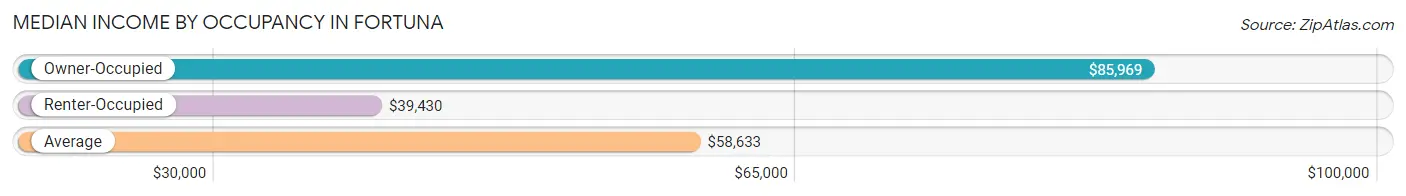
| Occupancy Type | # Households | Median Income |
| Owner-Occupied | 2,811 (56.7%) | $85,969 |
| Renter-Occupied | 2,144 (43.3%) | $39,430 |
| Average | 4,955 (100.0%) | $58,633 |
Occupancy by Householder Income Bracket in Fortuna
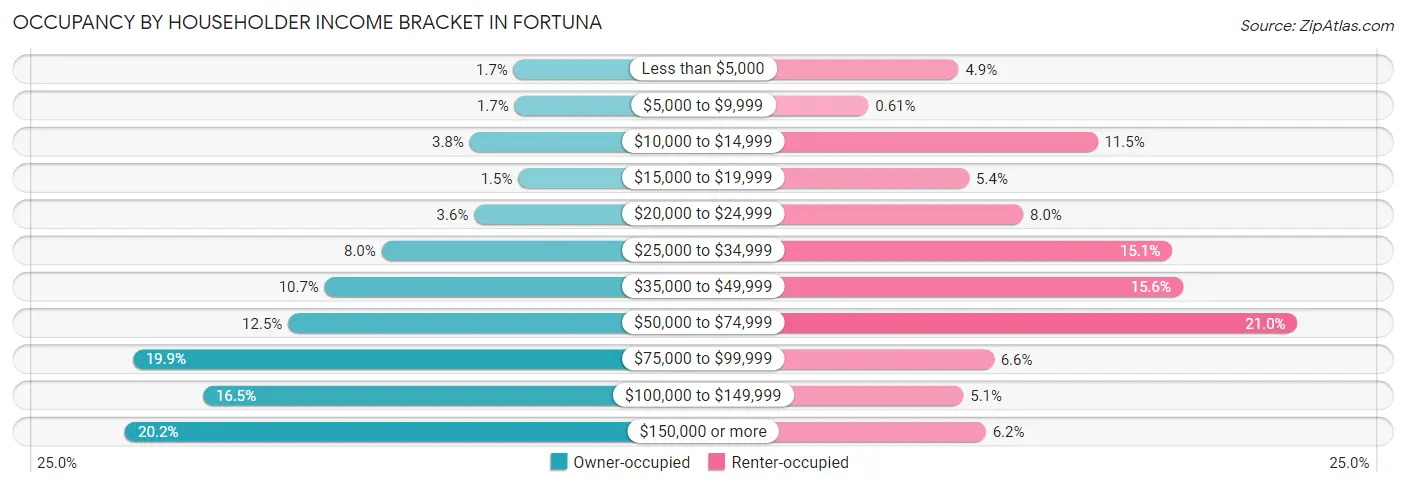
| Income Bracket | Owner-occupied | Renter-occupied |
| Less than $5,000 | 48 (1.7%) | 105 (4.9%) |
| $5,000 to $9,999 | 47 (1.7%) | 13 (0.6%) |
| $10,000 to $14,999 | 107 (3.8%) | 247 (11.5%) |
| $15,000 to $19,999 | 42 (1.5%) | 116 (5.4%) |
| $20,000 to $24,999 | 101 (3.6%) | 171 (8.0%) |
| $25,000 to $34,999 | 225 (8.0%) | 323 (15.1%) |
| $35,000 to $49,999 | 301 (10.7%) | 334 (15.6%) |
| $50,000 to $74,999 | 350 (12.4%) | 451 (21.0%) |
| $75,000 to $99,999 | 558 (19.9%) | 141 (6.6%) |
| $100,000 to $149,999 | 464 (16.5%) | 110 (5.1%) |
| $150,000 or more | 568 (20.2%) | 133 (6.2%) |
| Total | 2,811 (100.0%) | 2,144 (100.0%) |
Monthly Housing Cost Tiers in Fortuna
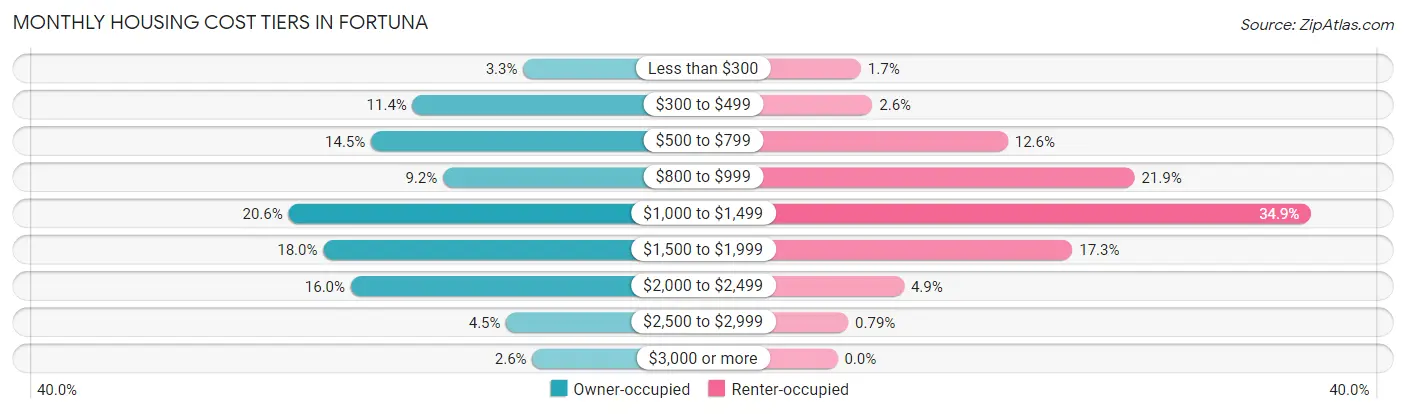
| Monthly Cost | Owner-occupied | Renter-occupied |
| Less than $300 | 92 (3.3%) | 37 (1.7%) |
| $300 to $499 | 321 (11.4%) | 55 (2.6%) |
| $500 to $799 | 407 (14.5%) | 269 (12.6%) |
| $800 to $999 | 258 (9.2%) | 469 (21.9%) |
| $1,000 to $1,499 | 578 (20.6%) | 748 (34.9%) |
| $1,500 to $1,999 | 506 (18.0%) | 371 (17.3%) |
| $2,000 to $2,499 | 449 (16.0%) | 105 (4.9%) |
| $2,500 to $2,999 | 127 (4.5%) | 17 (0.8%) |
| $3,000 or more | 73 (2.6%) | 0 (0.0%) |
| Total | 2,811 (100.0%) | 2,144 (100.0%) |
Physical Housing Characteristics in Fortuna
Housing Structures in Fortuna
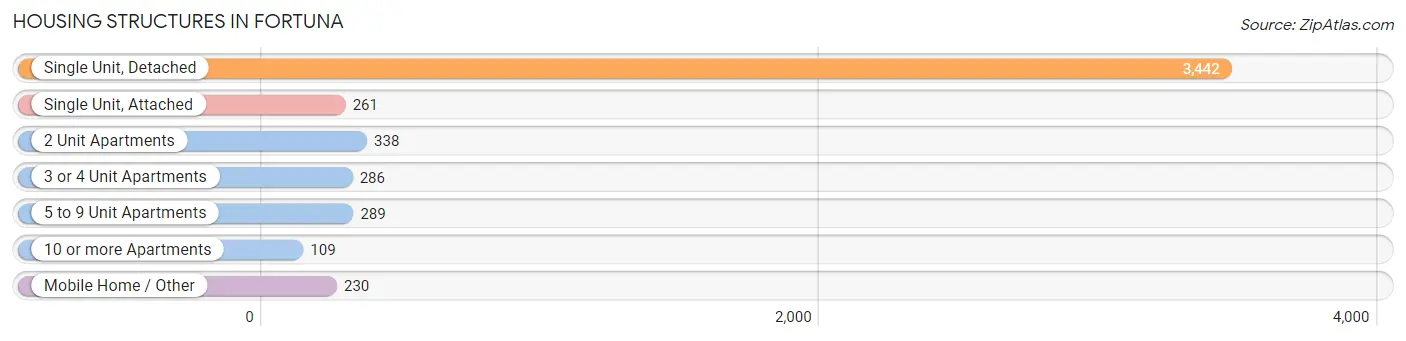
| Structure Type | # Housing Units | % Housing Units |
| Single Unit, Detached | 3,442 | 69.5% |
| Single Unit, Attached | 261 | 5.3% |
| 2 Unit Apartments | 338 | 6.8% |
| 3 or 4 Unit Apartments | 286 | 5.8% |
| 5 to 9 Unit Apartments | 289 | 5.8% |
| 10 or more Apartments | 109 | 2.2% |
| Mobile Home / Other | 230 | 4.6% |
| Total | 4,955 | 100.0% |
Housing Structures by Occupancy in Fortuna
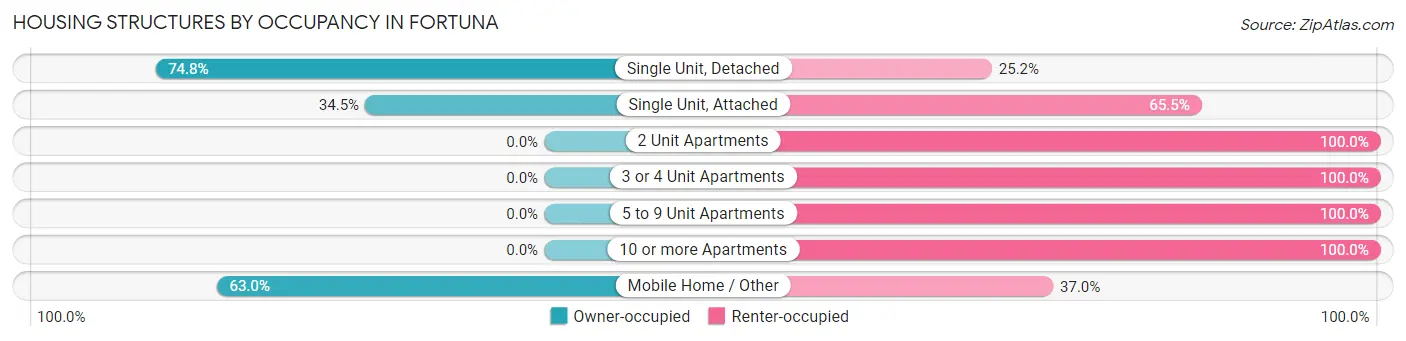
| Structure Type | Owner-occupied | Renter-occupied |
| Single Unit, Detached | 2,576 (74.8%) | 866 (25.2%) |
| Single Unit, Attached | 90 (34.5%) | 171 (65.5%) |
| 2 Unit Apartments | 0 (0.0%) | 338 (100.0%) |
| 3 or 4 Unit Apartments | 0 (0.0%) | 286 (100.0%) |
| 5 to 9 Unit Apartments | 0 (0.0%) | 289 (100.0%) |
| 10 or more Apartments | 0 (0.0%) | 109 (100.0%) |
| Mobile Home / Other | 145 (63.0%) | 85 (37.0%) |
| Total | 2,811 (56.7%) | 2,144 (43.3%) |
Housing Structures by Number of Rooms in Fortuna
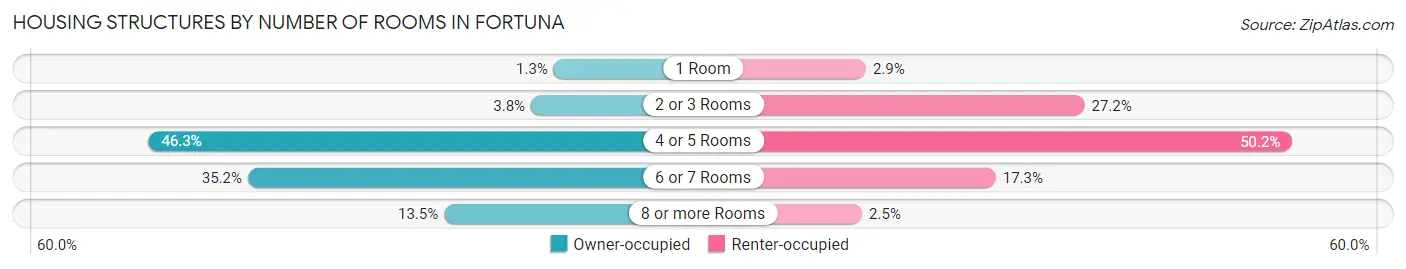
| Number of Rooms | Owner-occupied | Renter-occupied |
| 1 Room | 36 (1.3%) | 62 (2.9%) |
| 2 or 3 Rooms | 107 (3.8%) | 582 (27.2%) |
| 4 or 5 Rooms | 1,300 (46.3%) | 1,076 (50.2%) |
| 6 or 7 Rooms | 990 (35.2%) | 371 (17.3%) |
| 8 or more Rooms | 378 (13.5%) | 53 (2.5%) |
| Total | 2,811 (100.0%) | 2,144 (100.0%) |
Housing Structure by Heating Type in Fortuna
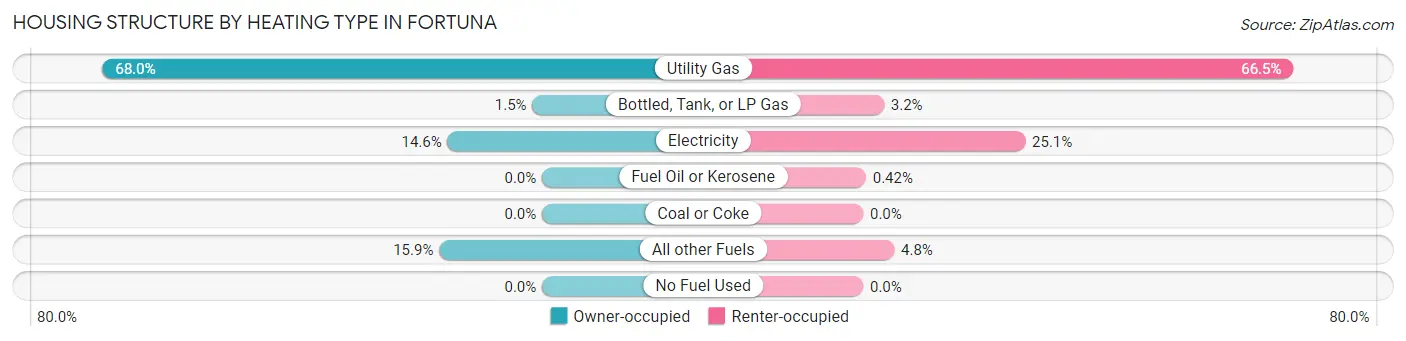
| Heating Type | Owner-occupied | Renter-occupied |
| Utility Gas | 1,911 (68.0%) | 1,426 (66.5%) |
| Bottled, Tank, or LP Gas | 42 (1.5%) | 69 (3.2%) |
| Electricity | 411 (14.6%) | 537 (25.1%) |
| Fuel Oil or Kerosene | 0 (0.0%) | 9 (0.4%) |
| Coal or Coke | 0 (0.0%) | 0 (0.0%) |
| All other Fuels | 447 (15.9%) | 103 (4.8%) |
| No Fuel Used | 0 (0.0%) | 0 (0.0%) |
| Total | 2,811 (100.0%) | 2,144 (100.0%) |
Household Vehicle Usage in Fortuna
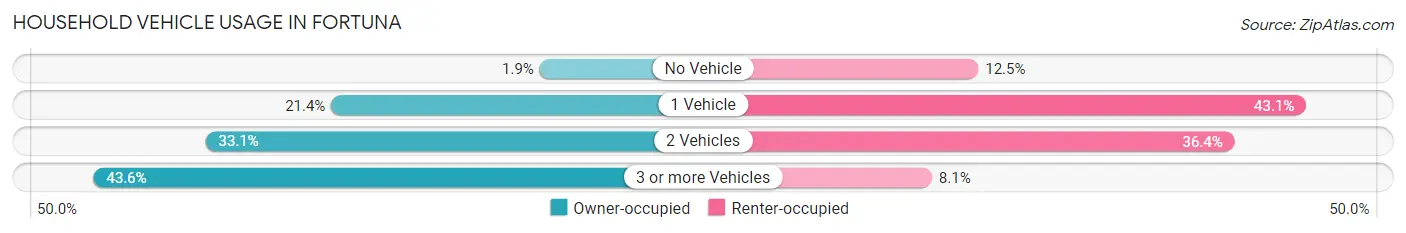
| Vehicles per Household | Owner-occupied | Renter-occupied |
| No Vehicle | 54 (1.9%) | 267 (12.4%) |
| 1 Vehicle | 601 (21.4%) | 923 (43.0%) |
| 2 Vehicles | 931 (33.1%) | 780 (36.4%) |
| 3 or more Vehicles | 1,225 (43.6%) | 174 (8.1%) |
| Total | 2,811 (100.0%) | 2,144 (100.0%) |
Real Estate & Mortgages in Fortuna
Real Estate and Mortgage Overview in Fortuna
| Characteristic | Without Mortgage | With Mortgage |
| Housing Units | 1,004 | 1,807 |
| Median Property Value | $343,700 | $342,300 |
| Median Household Income | $53,750 | $427 |
| Monthly Housing Costs | $542 | $63 |
| Real Estate Taxes | $2,244 | $0 |
Property Value by Mortgage Status in Fortuna
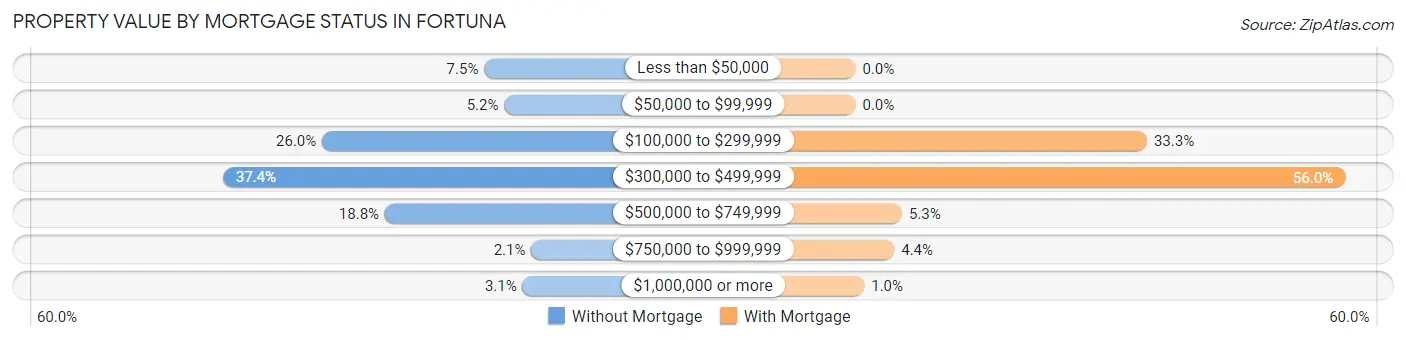
| Property Value | Without Mortgage | With Mortgage |
| Less than $50,000 | 75 (7.5%) | 0 (0.0%) |
| $50,000 to $99,999 | 52 (5.2%) | 0 (0.0%) |
| $100,000 to $299,999 | 261 (26.0%) | 602 (33.3%) |
| $300,000 to $499,999 | 375 (37.3%) | 1,011 (55.9%) |
| $500,000 to $749,999 | 189 (18.8%) | 96 (5.3%) |
| $750,000 to $999,999 | 21 (2.1%) | 80 (4.4%) |
| $1,000,000 or more | 31 (3.1%) | 18 (1.0%) |
| Total | 1,004 (100.0%) | 1,807 (100.0%) |
Household Income by Mortgage Status in Fortuna
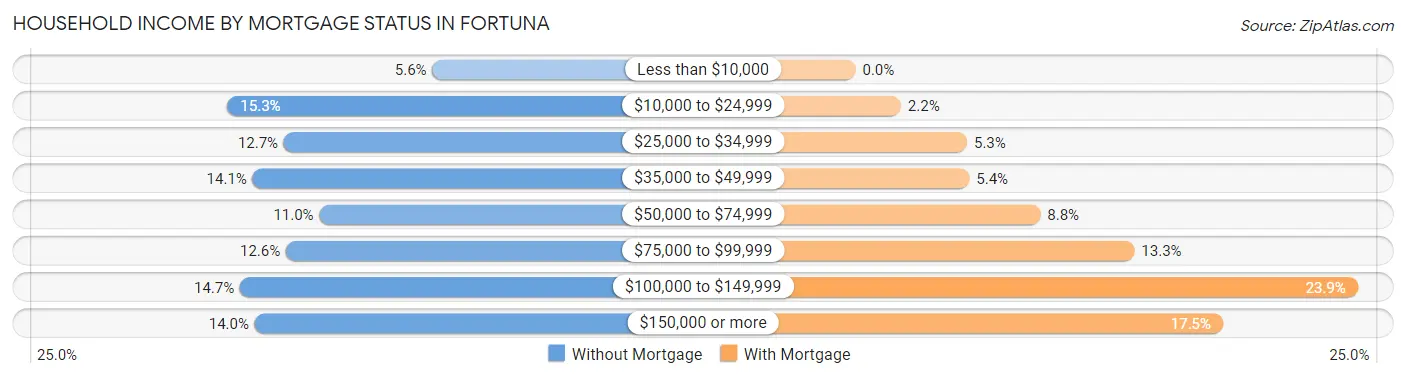
| Household Income | Without Mortgage | With Mortgage |
| Less than $10,000 | 56 (5.6%) | 0 (0.0%) |
| $10,000 to $24,999 | 154 (15.3%) | 39 (2.2%) |
| $25,000 to $34,999 | 127 (12.7%) | 96 (5.3%) |
| $35,000 to $49,999 | 142 (14.1%) | 98 (5.4%) |
| $50,000 to $74,999 | 110 (11.0%) | 159 (8.8%) |
| $75,000 to $99,999 | 126 (12.6%) | 240 (13.3%) |
| $100,000 to $149,999 | 148 (14.7%) | 432 (23.9%) |
| $150,000 or more | 141 (14.0%) | 316 (17.5%) |
| Total | 1,004 (100.0%) | 1,807 (100.0%) |
Property Value to Household Income Ratio in Fortuna
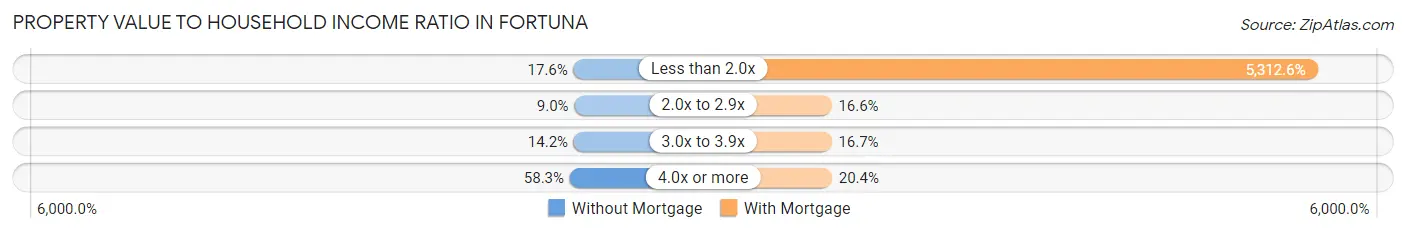
| Value-to-Income Ratio | Without Mortgage | With Mortgage |
| Less than 2.0x | 177 (17.6%) | 95,998 (5,312.6%) |
| 2.0x to 2.9x | 90 (9.0%) | 299 (16.6%) |
| 3.0x to 3.9x | 143 (14.2%) | 302 (16.7%) |
| 4.0x or more | 585 (58.3%) | 369 (20.4%) |
| Total | 1,004 (100.0%) | 1,807 (100.0%) |
Real Estate Taxes by Mortgage Status in Fortuna
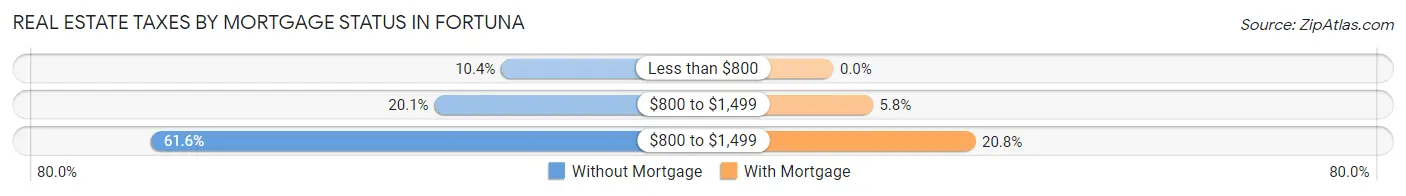
| Property Taxes | Without Mortgage | With Mortgage |
| Less than $800 | 104 (10.4%) | 0 (0.0%) |
| $800 to $1,499 | 202 (20.1%) | 104 (5.8%) |
| $800 to $1,499 | 618 (61.6%) | 375 (20.7%) |
| Total | 1,004 (100.0%) | 1,807 (100.0%) |
Health & Disability in Fortuna
Health Insurance Coverage by Age in Fortuna
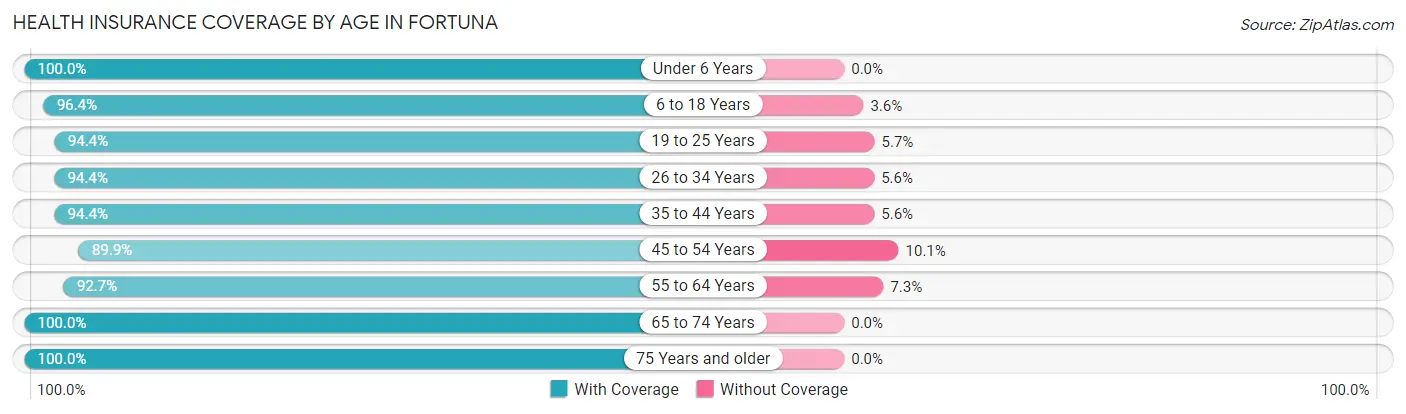
| Age Bracket | With Coverage | Without Coverage |
| Under 6 Years | 947 (100.0%) | 0 (0.0%) |
| 6 to 18 Years | 1,915 (96.4%) | 71 (3.6%) |
| 19 to 25 Years | 1,402 (94.4%) | 84 (5.7%) |
| 26 to 34 Years | 1,320 (94.4%) | 78 (5.6%) |
| 35 to 44 Years | 1,345 (94.4%) | 80 (5.6%) |
| 45 to 54 Years | 1,224 (89.9%) | 138 (10.1%) |
| 55 to 64 Years | 1,700 (92.7%) | 134 (7.3%) |
| 65 to 74 Years | 1,038 (100.0%) | 0 (0.0%) |
| 75 Years and older | 953 (100.0%) | 0 (0.0%) |
| Total | 11,844 (95.3%) | 585 (4.7%) |
Health Insurance Coverage by Citizenship Status in Fortuna
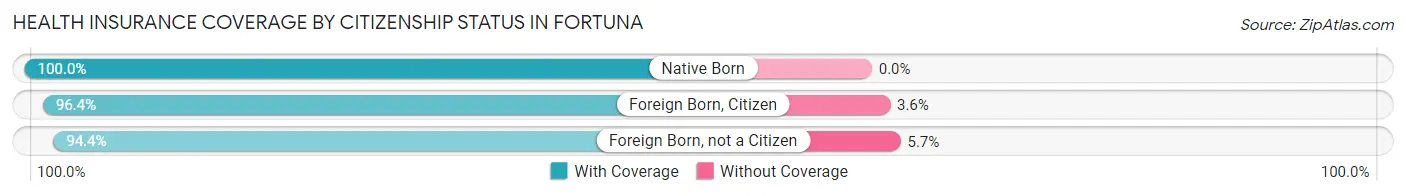
| Citizenship Status | With Coverage | Without Coverage |
| Native Born | 947 (100.0%) | 0 (0.0%) |
| Foreign Born, Citizen | 1,915 (96.4%) | 71 (3.6%) |
| Foreign Born, not a Citizen | 1,402 (94.4%) | 84 (5.7%) |
Health Insurance Coverage by Household Income in Fortuna
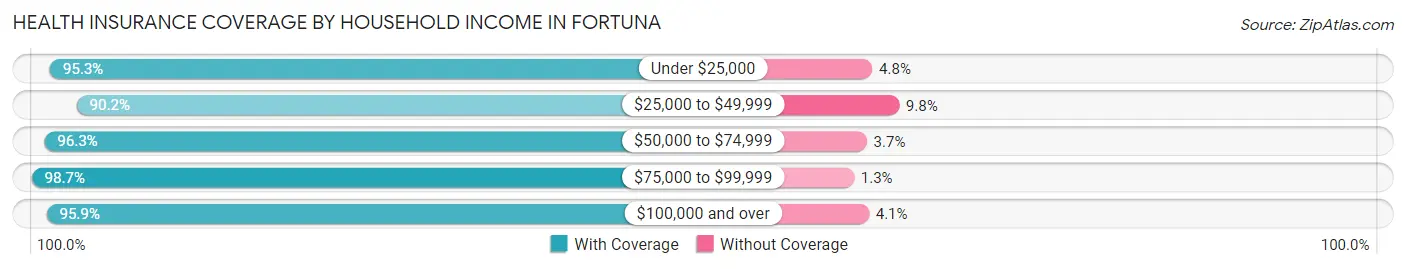
| Household Income | With Coverage | Without Coverage |
| Under $25,000 | 1,624 (95.3%) | 81 (4.8%) |
| $25,000 to $49,999 | 2,107 (90.2%) | 228 (9.8%) |
| $50,000 to $74,999 | 1,942 (96.3%) | 75 (3.7%) |
| $75,000 to $99,999 | 2,024 (98.7%) | 27 (1.3%) |
| $100,000 and over | 4,046 (95.9%) | 174 (4.1%) |
Public vs Private Health Insurance Coverage by Age in Fortuna
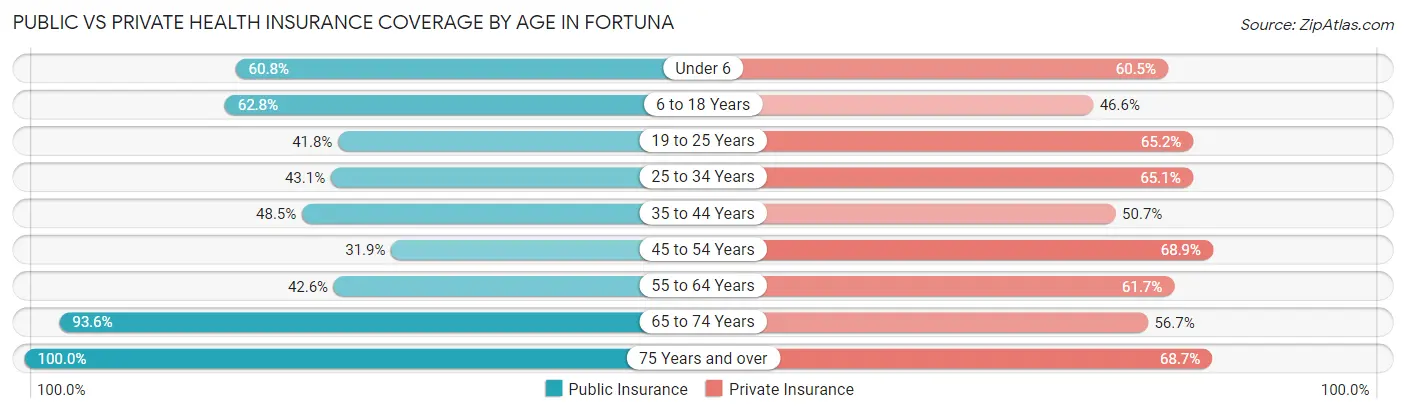
| Age Bracket | Public Insurance | Private Insurance |
| Under 6 | 576 (60.8%) | 573 (60.5%) |
| 6 to 18 Years | 1,248 (62.8%) | 925 (46.6%) |
| 19 to 25 Years | 621 (41.8%) | 969 (65.2%) |
| 25 to 34 Years | 603 (43.1%) | 910 (65.1%) |
| 35 to 44 Years | 691 (48.5%) | 723 (50.7%) |
| 45 to 54 Years | 435 (31.9%) | 938 (68.9%) |
| 55 to 64 Years | 781 (42.6%) | 1,131 (61.7%) |
| 65 to 74 Years | 971 (93.5%) | 589 (56.7%) |
| 75 Years and over | 953 (100.0%) | 655 (68.7%) |
| Total | 6,879 (55.3%) | 7,413 (59.6%) |
Disability Status by Sex by Age in Fortuna
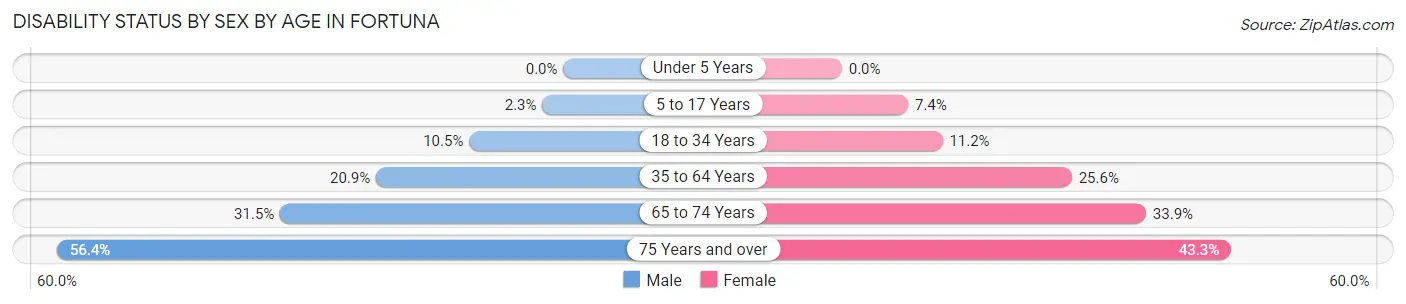
| Age Bracket | Male | Female |
| Under 5 Years | 0 (0.0%) | 0 (0.0%) |
| 5 to 17 Years | 21 (2.3%) | 85 (7.4%) |
| 18 to 34 Years | 155 (10.5%) | 176 (11.2%) |
| 35 to 64 Years | 501 (20.8%) | 568 (25.6%) |
| 65 to 74 Years | 170 (31.5%) | 169 (33.9%) |
| 75 Years and over | 207 (56.4%) | 254 (43.3%) |
Disability Class by Sex by Age in Fortuna
Disability Class: Hearing Difficulty
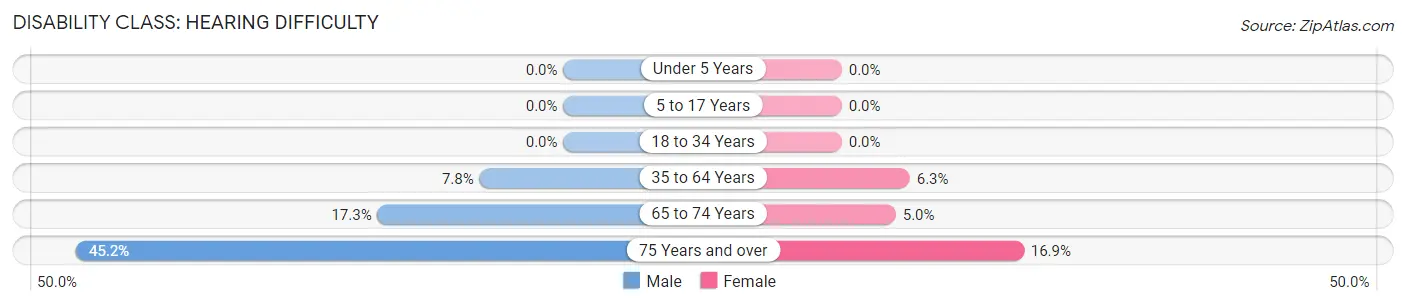
| Age Bracket | Male | Female |
| Under 5 Years | 0 (0.0%) | 0 (0.0%) |
| 5 to 17 Years | 0 (0.0%) | 0 (0.0%) |
| 18 to 34 Years | 0 (0.0%) | 0 (0.0%) |
| 35 to 64 Years | 187 (7.8%) | 140 (6.3%) |
| 65 to 74 Years | 93 (17.2%) | 25 (5.0%) |
| 75 Years and over | 166 (45.2%) | 99 (16.9%) |
Disability Class: Vision Difficulty
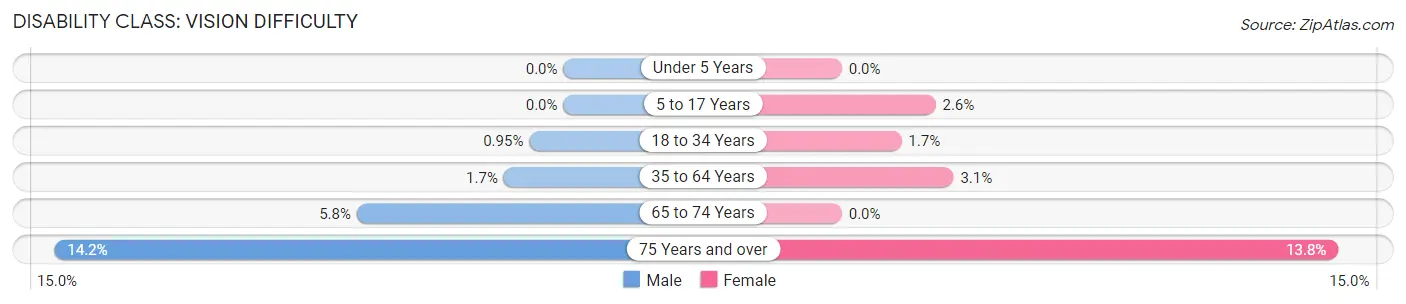
| Age Bracket | Male | Female |
| Under 5 Years | 0 (0.0%) | 0 (0.0%) |
| 5 to 17 Years | 0 (0.0%) | 30 (2.6%) |
| 18 to 34 Years | 14 (0.9%) | 26 (1.7%) |
| 35 to 64 Years | 40 (1.7%) | 69 (3.1%) |
| 65 to 74 Years | 31 (5.8%) | 0 (0.0%) |
| 75 Years and over | 52 (14.2%) | 81 (13.8%) |
Disability Class: Cognitive Difficulty
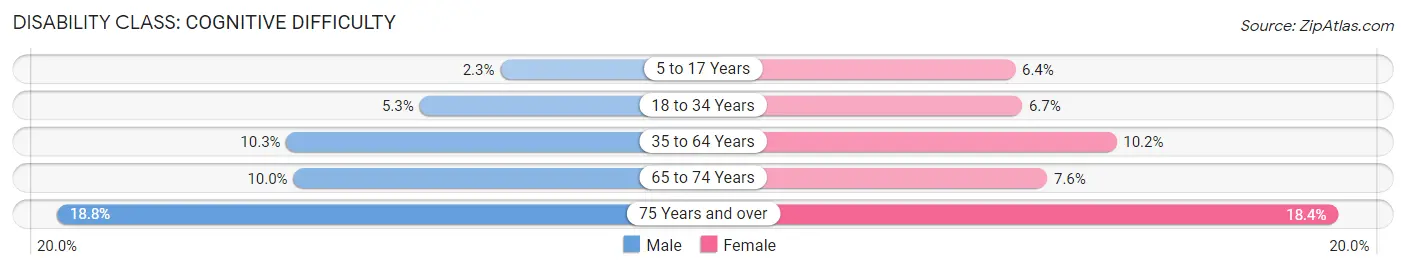
| Age Bracket | Male | Female |
| 5 to 17 Years | 21 (2.3%) | 74 (6.4%) |
| 18 to 34 Years | 79 (5.3%) | 105 (6.7%) |
| 35 to 64 Years | 247 (10.3%) | 226 (10.2%) |
| 65 to 74 Years | 54 (10.0%) | 38 (7.6%) |
| 75 Years and over | 69 (18.8%) | 108 (18.4%) |
Disability Class: Ambulatory Difficulty
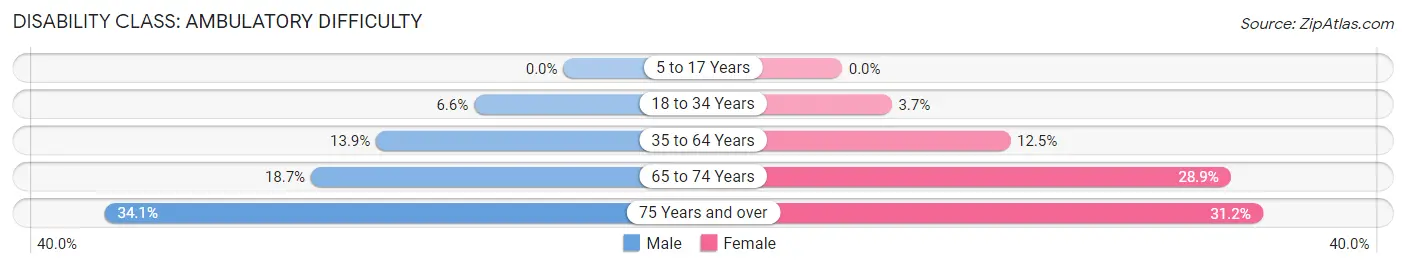
| Age Bracket | Male | Female |
| 5 to 17 Years | 0 (0.0%) | 0 (0.0%) |
| 18 to 34 Years | 98 (6.6%) | 58 (3.7%) |
| 35 to 64 Years | 334 (13.9%) | 277 (12.5%) |
| 65 to 74 Years | 101 (18.7%) | 144 (28.9%) |
| 75 Years and over | 125 (34.1%) | 183 (31.2%) |
Disability Class: Self-Care Difficulty
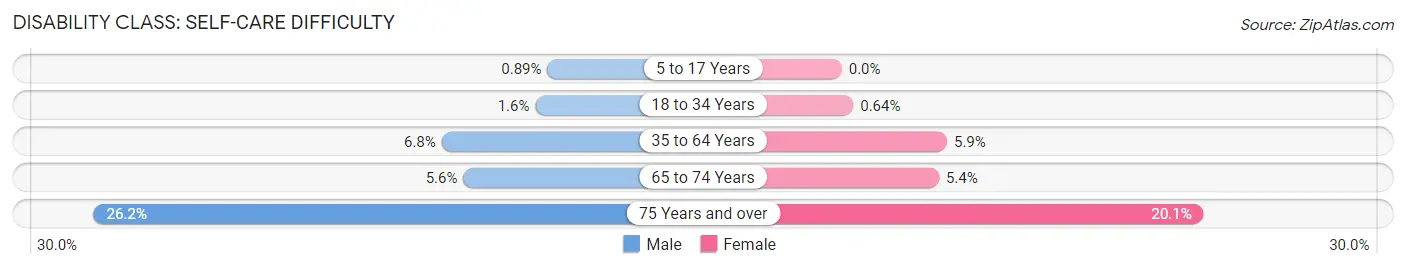
| Age Bracket | Male | Female |
| 5 to 17 Years | 8 (0.9%) | 0 (0.0%) |
| 18 to 34 Years | 23 (1.6%) | 10 (0.6%) |
| 35 to 64 Years | 163 (6.8%) | 130 (5.9%) |
| 65 to 74 Years | 30 (5.6%) | 27 (5.4%) |
| 75 Years and over | 96 (26.2%) | 118 (20.1%) |
Technology Access in Fortuna
Computing Device Access in Fortuna
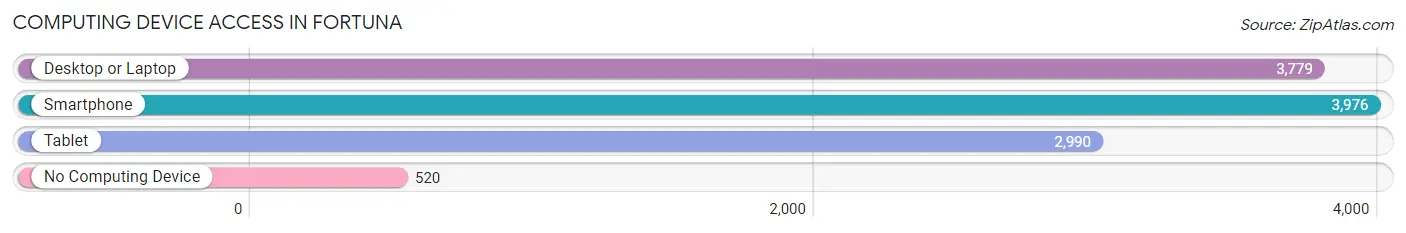
| Device Type | # Households | % Households |
| Desktop or Laptop | 3,779 | 76.3% |
| Smartphone | 3,976 | 80.2% |
| Tablet | 2,990 | 60.3% |
| No Computing Device | 520 | 10.5% |
| Total | 4,955 | 100.0% |
Internet Access in Fortuna
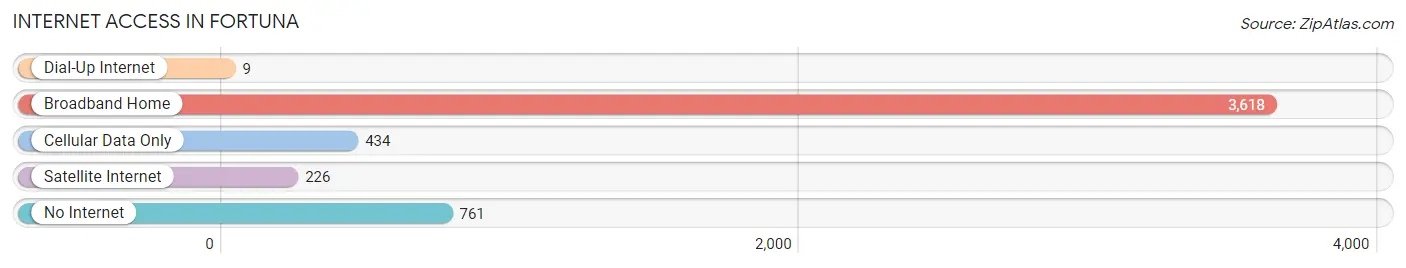
| Internet Type | # Households | % Households |
| Dial-Up Internet | 9 | 0.2% |
| Broadband Home | 3,618 | 73.0% |
| Cellular Data Only | 434 | 8.8% |
| Satellite Internet | 226 | 4.6% |
| No Internet | 761 | 15.4% |
| Total | 4,955 | 100.0% |
Fortuna Summary
Fortuna is a small city located in Humboldt County, California, United States. It is situated on the banks of the Eel River, approximately 10 miles (16 km) south of Eureka, the county seat. The population was 11,926 at the 2010 census, up from 10,497 at the 2000 census.
Geography
Fortuna is located at 40°55′32″N 124°12′16″W (40.925556, -124.204444). According to the United States Census Bureau, the city has a total area of 4.8 square miles (12.4 km2), all of it land.
Fortuna is located on the Eel River, and is surrounded by the hills of the Coast Range. The Eel River is the largest river in Humboldt County, and is known for its salmon and steelhead runs. The river is also home to a variety of other wildlife, including otters, beavers, and ospreys.
Climate
Fortuna has a mild, temperate climate, with warm summers and cool winters. The average annual temperature is 54°F (12°C). The average annual precipitation is 44.5 inches (113 cm).
Demographics
As of the census of 2000, there were 10,497 people, 4,164 households, and 2,619 families residing in the city. The population density was 2,183.3 people per square mile (843.7/km2). There were 4,521 housing units at an average density of 937.2 per square mile (361.7/km2). The racial makeup of the city was 81.2% White, 0.5% African American, 4.2% Native American, 1.2% Asian, 0.2% Pacific Islander, 8.7% from other races, and 4.0% from two or more races. Hispanic or Latino of any race were 16.2% of the population.
Economy
Fortuna is the economic center of Humboldt County, and is home to a variety of businesses and industries. The city is home to a number of lumber mills, as well as a number of other manufacturing and service businesses. The city is also home to a number of retail stores, restaurants, and other businesses.
Fortuna is also home to a number of agricultural businesses, including dairy farms, cattle ranches, and vegetable farms. The city is also home to a number of wineries and breweries.
The city is also home to a number of tourist attractions, including the Fortuna Riverwalk, the Sequoia Park Zoo, and the Fortuna Redwood State Park.
Conclusion
Fortuna is a small city located in Humboldt County, California, United States. It is situated on the banks of the Eel River, approximately 10 miles (16 km) south of Eureka, the county seat. The population was 11,926 at the 2010 census, up from 10,497 at the 2000 census. Fortuna has a mild, temperate climate, with warm summers and cool winters. The city is home to a variety of businesses and industries, including lumber mills, manufacturing and service businesses, retail stores, restaurants, agricultural businesses, wineries, and breweries. The city is also home to a number of tourist attractions, including the Fortuna Riverwalk, the Sequoia Park Zoo, and the Fortuna Redwood State Park.
Common Questions
What is Per Capita Income in Fortuna?
Per Capita income in Fortuna is $32,543.
What is the Median Family Income in Fortuna?
Median Family Income in Fortuna is $68,009.
What is the Median Household income in Fortuna?
Median Household Income in Fortuna is $58,633.
What is Income or Wage Gap in Fortuna?
Income or Wage Gap in Fortuna is 47.4%.
Women in Fortuna earn 52.6 cents for every dollar earned by a man.
What is Inequality or Gini Index in Fortuna?
Inequality or Gini Index in Fortuna is 0.46.
What is the Total Population of Fortuna?
Total Population of Fortuna is 12,527.
What is the Total Male Population of Fortuna?
Total Male Population of Fortuna is 6,040.
What is the Total Female Population of Fortuna?
Total Female Population of Fortuna is 6,487.
What is the Ratio of Males per 100 Females in Fortuna?
There are 93.11 Males per 100 Females in Fortuna.
What is the Ratio of Females per 100 Males in Fortuna?
There are 107.40 Females per 100 Males in Fortuna.
What is the Median Population Age in Fortuna?
Median Population Age in Fortuna is 37.5 Years.
What is the Average Family Size in Fortuna
Average Family Size in Fortuna is 3.1 People.
What is the Average Household Size in Fortuna
Average Household Size in Fortuna is 2.5 People.
How Large is the Labor Force in Fortuna?
There are 5,941 People in the Labor Forcein in Fortuna.
What is the Percentage of People in the Labor Force in Fortuna?
58.8% of People are in the Labor Force in Fortuna.
What is the Unemployment Rate in Fortuna?
Unemployment Rate in Fortuna is 5.3%.