Cities with the Highest Percentage of Immigrants from Pakistan in Pennsylvania
RELATED REPORTS & OPTIONS
Pakistan
Pennsylvania
Compare Cities
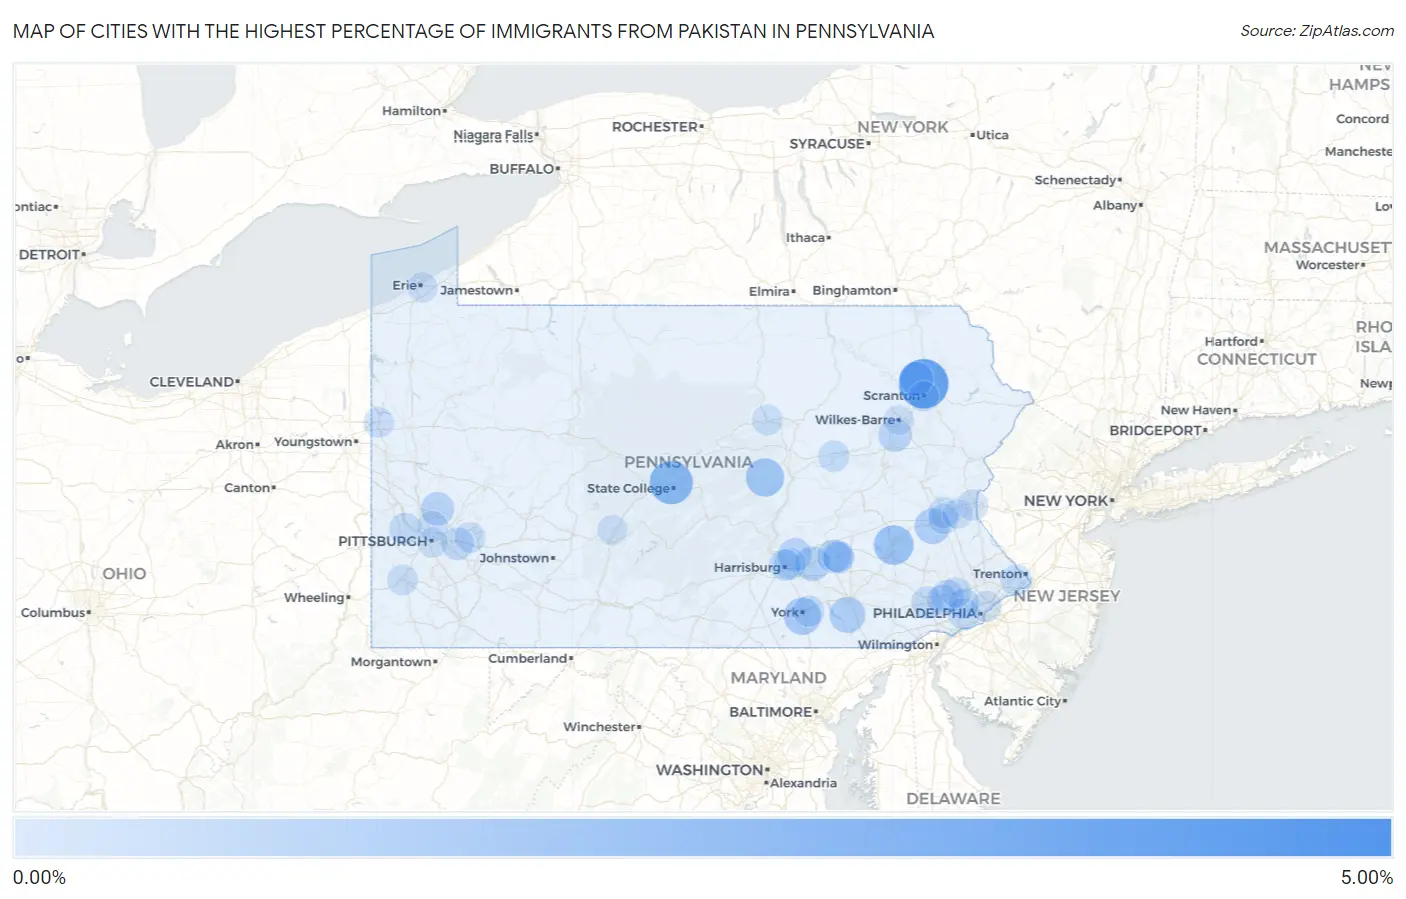
Map of Cities with the Highest Percentage of Immigrants from Pakistan in Pennsylvania
0.00%
5.00%
Cities with the Highest Percentage of Immigrants from Pakistan in Pennsylvania
| City | Pakistan | vs State | vs National | |
| 1. | Mcadoo Borough | 4.88% | 0.086%(+4.79)#-1 | 0.12%(+4.76)#0 |
| 2. | Danville Borough | 4.08% | 0.086%(+3.99)#0 | 0.12%(+3.96)#1 |
| 3. | Chinchilla | 3.71% | 0.086%(+3.62)#1 | 0.12%(+3.59)#2 |
| 4. | Bridgewater Borough | 3.30% | 0.086%(+3.21)#2 | 0.12%(+3.18)#3 |
| 5. | Hulmeville Borough | 2.73% | 0.086%(+2.64)#3 | 0.12%(+2.61)#4 |
| 6. | Toftrees | 2.51% | 0.086%(+2.42)#4 | 0.12%(+2.39)#5 |
| 7. | Temple | 1.78% | 0.086%(+1.69)#5 | 0.12%(+1.66)#6 |
| 8. | North York Borough | 1.52% | 0.086%(+1.43)#6 | 0.12%(+1.40)#7 |
| 9. | Penns Creek | 1.51% | 0.086%(+1.43)#7 | 0.12%(+1.39)#8 |
| 10. | Chalfont Borough | 1.50% | 0.086%(+1.42)#20 | 0.12%(+1.38)#167 |
| 11. | Millbourne Borough | 1.40% | 0.086%(+1.32)#21 | 0.12%(+1.28)#168 |
| 12. | Grantley | 1.33% | 0.086%(+1.24)#22 | 0.12%(+1.21)#169 |
| 13. | Conestoga | 1.06% | 0.086%(+0.972)#23 | 0.12%(+0.940)#170 |
| 14. | Folcroft Borough | 1.02% | 0.086%(+0.935)#24 | 0.12%(+0.902)#171 |
| 15. | Ancient Oaks | 1.02% | 0.086%(+0.932)#25 | 0.12%(+0.900)#172 |
| 16. | Lemoyne Borough | 0.92% | 0.086%(+0.836)#26 | 0.12%(+0.803)#173 |
| 17. | Beaver Borough | 0.86% | 0.086%(+0.776)#27 | 0.12%(+0.743)#174 |
| 18. | Hershey | 0.85% | 0.086%(+0.765)#28 | 0.12%(+0.732)#175 |
| 19. | Chestnut Hill | 0.79% | 0.086%(+0.699)#29 | 0.12%(+0.667)#176 |
| 20. | Glenburn | 0.72% | 0.086%(+0.633)#30 | 0.12%(+0.600)#177 |
| 21. | Linglestown | 0.68% | 0.086%(+0.592)#37 | 0.12%(+0.559)#437 |
| 22. | Bakerstown | 0.63% | 0.086%(+0.543)#38 | 0.12%(+0.511)#438 |
| 23. | Malvern Borough | 0.62% | 0.086%(+0.533)#39 | 0.12%(+0.501)#439 |
| 24. | Pleasant Hill | 0.61% | 0.086%(+0.527)#40 | 0.12%(+0.494)#440 |
| 25. | Mountain Top | 0.61% | 0.086%(+0.524)#41 | 0.12%(+0.492)#441 |
| 26. | Industry Borough | 0.60% | 0.086%(+0.510)#42 | 0.12%(+0.477)#442 |
| 27. | Hatfield Borough | 0.57% | 0.086%(+0.487)#43 | 0.12%(+0.454)#443 |
| 28. | Pleasant Hills Borough | 0.56% | 0.086%(+0.470)#44 | 0.12%(+0.437)#444 |
| 29. | Penn Farms | 0.52% | 0.086%(+0.434)#45 | 0.12%(+0.401)#445 |
| 30. | Clarks Green Borough | 0.50% | 0.086%(+0.416)#46 | 0.12%(+0.383)#446 |
| 31. | Bath Borough | 0.50% | 0.086%(+0.411)#47 | 0.12%(+0.379)#447 |
| 32. | Frazer | 0.49% | 0.086%(+0.401)#48 | 0.12%(+0.368)#448 |
| 33. | Chesterbrook | 0.48% | 0.086%(+0.393)#49 | 0.12%(+0.360)#449 |
| 34. | Monroeville | 0.44% | 0.086%(+0.356)#50 | 0.12%(+0.323)#1,083 |
| 35. | Camp Hill Borough | 0.43% | 0.086%(+0.344)#51 | 0.12%(+0.311)#1,084 |
| 36. | Bloomfield Borough | 0.42% | 0.086%(+0.336)#52 | 0.12%(+0.304)#1,085 |
| 37. | Exton | 0.41% | 0.086%(+0.328)#53 | 0.12%(+0.296)#1,086 |
| 38. | East Washington Borough | 0.41% | 0.086%(+0.324)#54 | 0.12%(+0.291)#1,087 |
| 39. | Brentwood Borough | 0.37% | 0.086%(+0.284)#55 | 0.12%(+0.252)#1,088 |
| 40. | Oxford Borough | 0.37% | 0.086%(+0.281)#56 | 0.12%(+0.248)#1,089 |
| 41. | Carnot Moon | 0.34% | 0.086%(+0.258)#57 | 0.12%(+0.226)#1,090 |
| 42. | Blawnox Borough | 0.33% | 0.086%(+0.240)#58 | 0.12%(+0.207)#1,091 |
| 43. | Lebanon | 0.32% | 0.086%(+0.232)#59 | 0.12%(+0.200)#1,092 |
| 44. | Progress | 0.32% | 0.086%(+0.230)#60 | 0.12%(+0.198)#1,093 |
| 45. | Harrisburg | 0.32% | 0.086%(+0.229)#61 | 0.12%(+0.197)#1,094 |
| 46. | Merion Station | 0.32% | 0.086%(+0.229)#62 | 0.12%(+0.196)#1,095 |
| 47. | Trappe Borough | 0.30% | 0.086%(+0.216)#63 | 0.12%(+0.183)#1,096 |
| 48. | Rosemont | 0.28% | 0.086%(+0.199)#64 | 0.12%(+0.166)#1,097 |
| 49. | Nescopeck Borough | 0.28% | 0.086%(+0.194)#65 | 0.12%(+0.162)#1,098 |
| 50. | Zelienople Borough | 0.26% | 0.086%(+0.172)#66 | 0.12%(+0.139)#1,099 |
| 51. | Franklin Park Borough | 0.25% | 0.086%(+0.169)#67 | 0.12%(+0.136)#1,100 |
| 52. | Punxsutawney Borough | 0.24% | 0.086%(+0.158)#68 | 0.12%(+0.125)#1,101 |
| 53. | Drexel Hill | 0.24% | 0.086%(+0.157)#69 | 0.12%(+0.124)#1,102 |
| 54. | Lebanon South | 0.24% | 0.086%(+0.154)#70 | 0.12%(+0.121)#1,103 |
| 55. | Collegeville Borough | 0.23% | 0.086%(+0.146)#71 | 0.12%(+0.113)#1,104 |
| 56. | Brookhaven Borough | 0.23% | 0.086%(+0.143)#72 | 0.12%(+0.111)#1,105 |
| 57. | Elizabethtown Borough | 0.23% | 0.086%(+0.142)#73 | 0.12%(+0.110)#1,106 |
| 58. | Morrisville Borough | 0.22% | 0.086%(+0.130)#74 | 0.12%(+0.097)#1,107 |
| 59. | Fullerton | 0.21% | 0.086%(+0.128)#75 | 0.12%(+0.095)#1,108 |
| 60. | Ben Avon Borough | 0.21% | 0.086%(+0.127)#76 | 0.12%(+0.094)#1,109 |
| 61. | Bloomsburg | 0.21% | 0.086%(+0.124)#77 | 0.12%(+0.091)#1,110 |
| 62. | Fairless Hills | 0.21% | 0.086%(+0.122)#78 | 0.12%(+0.090)#1,111 |
| 63. | Millvale Borough | 0.21% | 0.086%(+0.121)#79 | 0.12%(+0.088)#1,112 |
| 64. | East York | 0.20% | 0.086%(+0.117)#80 | 0.12%(+0.084)#1,113 |
| 65. | Easton | 0.20% | 0.086%(+0.111)#81 | 0.12%(+0.078)#1,114 |
| 66. | Paoli | 0.20% | 0.086%(+0.110)#82 | 0.12%(+0.077)#1,115 |
| 67. | Swarthmore Borough | 0.18% | 0.086%(+0.098)#83 | 0.12%(+0.065)#1,116 |
| 68. | Murrysville | 0.18% | 0.086%(+0.091)#84 | 0.12%(+0.059)#1,117 |
| 69. | Philadelphia | 0.17% | 0.086%(+0.084)#85 | 0.12%(+0.051)#1,118 |
| 70. | Sinking Spring Borough | 0.16% | 0.086%(+0.078)#86 | 0.12%(+0.045)#1,119 |
| 71. | Bryn Mawr | 0.15% | 0.086%(+0.059)#87 | 0.12%(+0.026)#1,120 |
| 72. | Lansdowne Borough | 0.14% | 0.086%(+0.058)#88 | 0.12%(+0.026)#1,121 |
| 73. | King Of Prussia | 0.13% | 0.086%(+0.045)#89 | 0.12%(+0.012)#1,122 |
| 74. | Washington | 0.13% | 0.086%(+0.041)#90 | 0.12%(+0.008)#1,123 |
| 75. | Williamsport | 0.12% | 0.086%(+0.033)#91 | 0.12%(-0.000)#1,124 |
| 76. | Old Forge Borough | 0.12% | 0.086%(+0.031)#92 | 0.12%(-0.001)#1,125 |
| 77. | Chambersburg Borough | 0.11% | 0.086%(+0.028)#93 | 0.12%(-0.005)#1,126 |
| 78. | Villanova | 0.099% | 0.086%(+0.013)#94 | 0.12%(-0.020)#1,127 |
| 79. | Bellevue Borough | 0.097% | 0.086%(+0.011)#95 | 0.12%(-0.022)#1,128 |
| 80. | Glenshaw | 0.096% | 0.086%(+0.009)#96 | 0.12%(-0.023)#1,129 |
| 81. | Allentown | 0.094% | 0.086%(+0.008)#97 | 0.12%(-0.025)#1,130 |
| 82. | Carnegie Borough | 0.087% | 0.086%(+0.000)#98 | 0.12%(-0.032)#1,131 |
| 83. | Hermitage | 0.080% | 0.086%(-0.006)#99 | 0.12%(-0.039)#1,132 |
| 84. | Baldwin Borough | 0.080% | 0.086%(-0.006)#100 | 0.12%(-0.039)#1,133 |
| 85. | Langhorne Manor Borough | 0.064% | 0.086%(-0.022)#101 | 0.12%(-0.055)#1,134 |
| 86. | Scranton | 0.042% | 0.086%(-0.044)#102 | 0.12%(-0.077)#1,135 |
| 87. | Wilkinsburg Borough | 0.042% | 0.086%(-0.044)#103 | 0.12%(-0.077)#1,136 |
| 88. | Erie | 0.041% | 0.086%(-0.045)#104 | 0.12%(-0.078)#1,137 |
| 89. | Pittsburgh | 0.039% | 0.086%(-0.047)#105 | 0.12%(-0.080)#1,138 |
| 90. | Bethlehem | 0.017% | 0.086%(-0.069)#106 | 0.12%(-0.102)#1,139 |
| 91. | Wilkes Barre | 0.016% | 0.086%(-0.070)#107 | 0.12%(-0.103)#1,140 |
| 92. | State College Borough | 0.012% | 0.086%(-0.074)#108 | 0.12%(-0.107)#1,141 |
| 93. | Altoona | 0.011% | 0.086%(-0.075)#109 | 0.12%(-0.108)#1,142 |
Common Questions
What are the Top 10 Cities with the Highest Percentage of Immigrants from Pakistan in Pennsylvania?
Top 10 Cities with the Highest Percentage of Immigrants from Pakistan in Pennsylvania are:
#1
3.71%
#2
2.51%
#3
1.78%
#4
1.51%
#5
1.33%
#6
1.06%
#7
1.02%
#8
0.85%
#9
0.72%
#10
0.68%
What city has the Highest Percentage of Immigrants from Pakistan in Pennsylvania?
Chinchilla has the Highest Percentage of Immigrants from Pakistan in Pennsylvania with 3.71%.
What is the Percentage of Immigrants from Pakistan in the State of Pennsylvania?
Percentage of Immigrants from Pakistan in Pennsylvania is 0.086%.
What is the Percentage of Immigrants from Pakistan in the United States?
Percentage of Immigrants from Pakistan in the United States is 0.12%.