Gridley, CA Map & Demographics
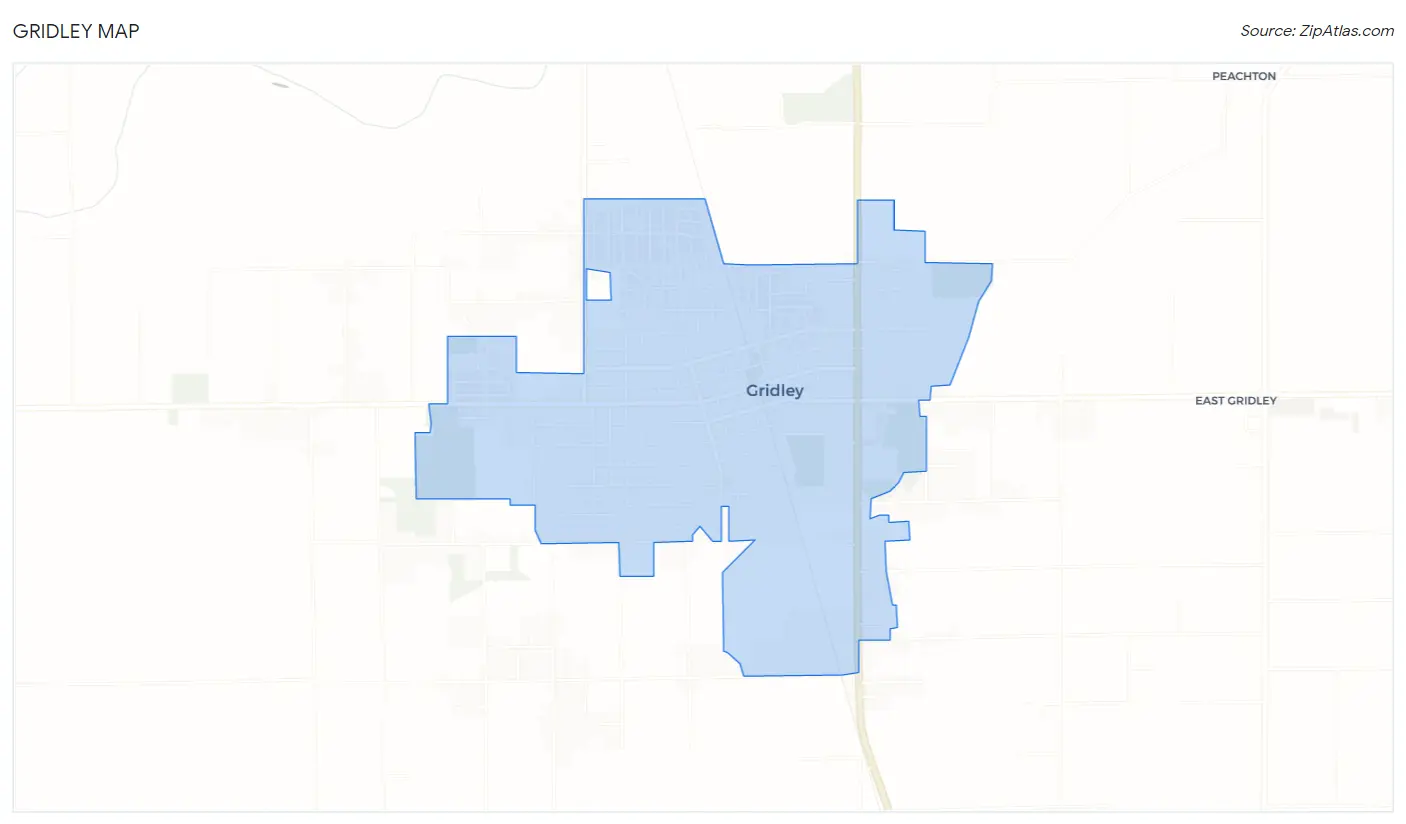
Gridley Map
Gridley Overview
$25,950
PER CAPITA INCOME
$65,463
AVG FAMILY INCOME
$56,428
AVG HOUSEHOLD INCOME
13.0%
WAGE / INCOME GAP [ % ]
87.0¢/ $1
WAGE / INCOME GAP [ $ ]
0.42
INEQUALITY / GINI INDEX
7,444
TOTAL POPULATION
3,554
MALE POPULATION
3,890
FEMALE POPULATION
91.36
MALES / 100 FEMALES
109.45
FEMALES / 100 MALES
32.3
MEDIAN AGE
3.6
AVG FAMILY SIZE
3.0
AVG HOUSEHOLD SIZE
3,332
LABOR FORCE [ PEOPLE ]
62.9%
PERCENT IN LABOR FORCE
10.8%
UNEMPLOYMENT RATE
Gridley Zip Codes
Gridley Area Codes
Income in Gridley
Income Overview in Gridley
Per Capita Income in Gridley is $25,950, while median incomes of families and households are $65,463 and $56,428 respectively.
| Characteristic | Number | Measure |
| Per Capita Income | 7,444 | $25,950 |
| Median Family Income | 1,804 | $65,463 |
| Mean Family Income | 1,804 | $90,294 |
| Median Household Income | 2,401 | $56,428 |
| Mean Household Income | 2,401 | $81,497 |
| Income Deficit | 1,804 | $0 |
| Wage / Income Gap (%) | 7,444 | 12.97% |
| Wage / Income Gap ($) | 7,444 | 87.03¢ per $1 |
| Gini / Inequality Index | 7,444 | 0.42 |
Earnings by Sex in Gridley
Average Earnings in Gridley are $36,098, $38,210 for men and $33,255 for women, a difference of 13.0%.
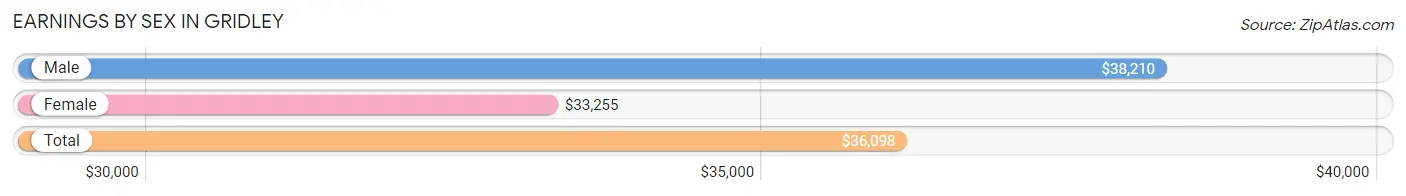
| Sex | Number | Average Earnings |
| Male | 1,572 (47.5%) | $38,210 |
| Female | 1,736 (52.5%) | $33,255 |
| Total | 3,308 (100.0%) | $36,098 |
Earnings by Sex by Income Bracket in Gridley
The most common earnings brackets in Gridley are $15,000 to $17,499 for men (193 | 12.3%) and $35,000 to $39,999 for women (246 | 14.2%).
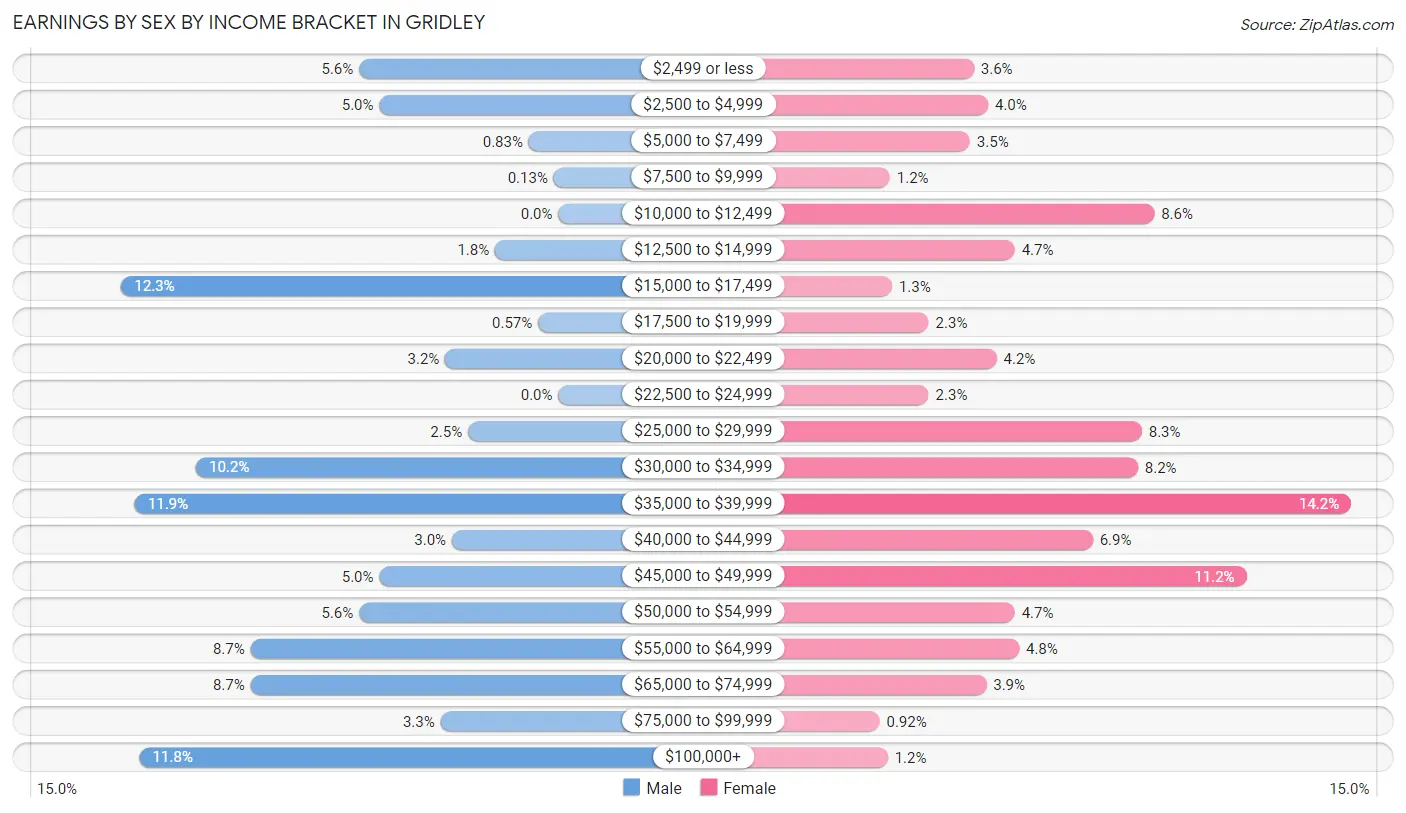
| Income | Male | Female |
| $2,499 or less | 88 (5.6%) | 62 (3.6%) |
| $2,500 to $4,999 | 79 (5.0%) | 69 (4.0%) |
| $5,000 to $7,499 | 13 (0.8%) | 60 (3.5%) |
| $7,500 to $9,999 | 2 (0.1%) | 21 (1.2%) |
| $10,000 to $12,499 | 0 (0.0%) | 150 (8.6%) |
| $12,500 to $14,999 | 28 (1.8%) | 82 (4.7%) |
| $15,000 to $17,499 | 193 (12.3%) | 22 (1.3%) |
| $17,500 to $19,999 | 9 (0.6%) | 40 (2.3%) |
| $20,000 to $22,499 | 50 (3.2%) | 73 (4.2%) |
| $22,500 to $24,999 | 0 (0.0%) | 40 (2.3%) |
| $25,000 to $29,999 | 40 (2.5%) | 144 (8.3%) |
| $30,000 to $34,999 | 160 (10.2%) | 142 (8.2%) |
| $35,000 to $39,999 | 187 (11.9%) | 246 (14.2%) |
| $40,000 to $44,999 | 47 (3.0%) | 120 (6.9%) |
| $45,000 to $49,999 | 79 (5.0%) | 195 (11.2%) |
| $50,000 to $54,999 | 88 (5.6%) | 82 (4.7%) |
| $55,000 to $64,999 | 136 (8.6%) | 84 (4.8%) |
| $65,000 to $74,999 | 136 (8.6%) | 68 (3.9%) |
| $75,000 to $99,999 | 52 (3.3%) | 16 (0.9%) |
| $100,000+ | 185 (11.8%) | 20 (1.1%) |
| Total | 1,572 (100.0%) | 1,736 (100.0%) |
Earnings by Sex by Educational Attainment in Gridley
Average earnings in Gridley are $39,560 for men and $37,823 for women, a difference of 4.4%. Men with an educational attainment of bachelor's degree enjoy the highest average annual earnings of $160,230, while those with less than high school education earn the least with $31,614. Women with an educational attainment of college or associate's degree earn the most with the average annual earnings of $38,937, while those with high school diploma education have the smallest earnings of $37,386.
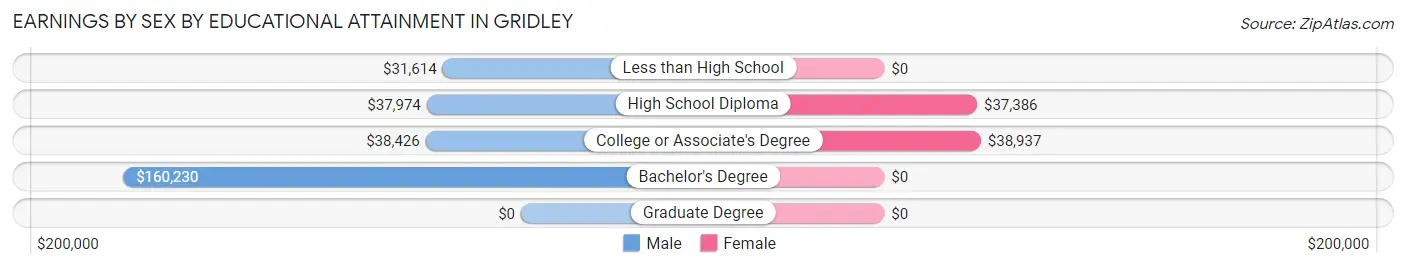
| Educational Attainment | Male Income | Female Income |
| Less than High School | $31,614 | $0 |
| High School Diploma | $37,974 | $37,386 |
| College or Associate's Degree | $38,426 | $38,937 |
| Bachelor's Degree | $160,230 | $0 |
| Graduate Degree | - | - |
| Total | $39,560 | $37,823 |
Family Income in Gridley
Family Income Brackets in Gridley
According to the Gridley family income data, there are 343 families falling into the $35,000 to $49,999 income range, which is the most common income bracket and makes up 19.0% of all families.
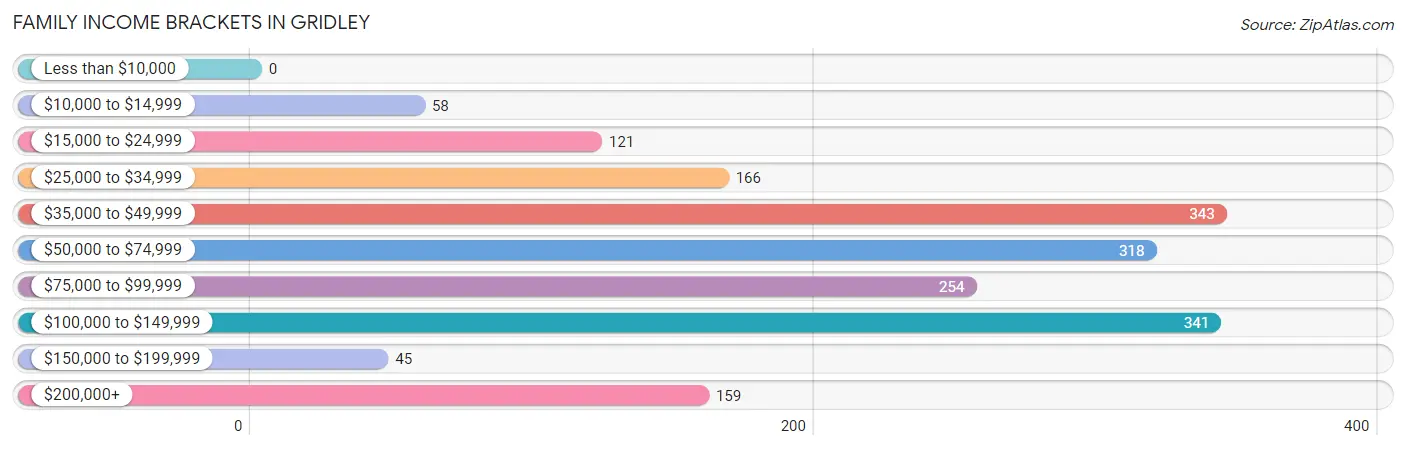
| Income Bracket | # Families | % Families |
| Less than $10,000 | 0 | 0.0% |
| $10,000 to $14,999 | 58 | 3.2% |
| $15,000 to $24,999 | 121 | 6.7% |
| $25,000 to $34,999 | 166 | 9.2% |
| $35,000 to $49,999 | 343 | 19.0% |
| $50,000 to $74,999 | 318 | 17.6% |
| $75,000 to $99,999 | 254 | 14.1% |
| $100,000 to $149,999 | 341 | 18.9% |
| $150,000 to $199,999 | 45 | 2.5% |
| $200,000+ | 159 | 8.8% |
Family Income by Famaliy Size in Gridley
3-person families (339 | 18.8%) account for the highest median family income in Gridley with $96,815 per family, while 2-person families (676 | 37.5%) have the highest median income of $32,639 per family member.
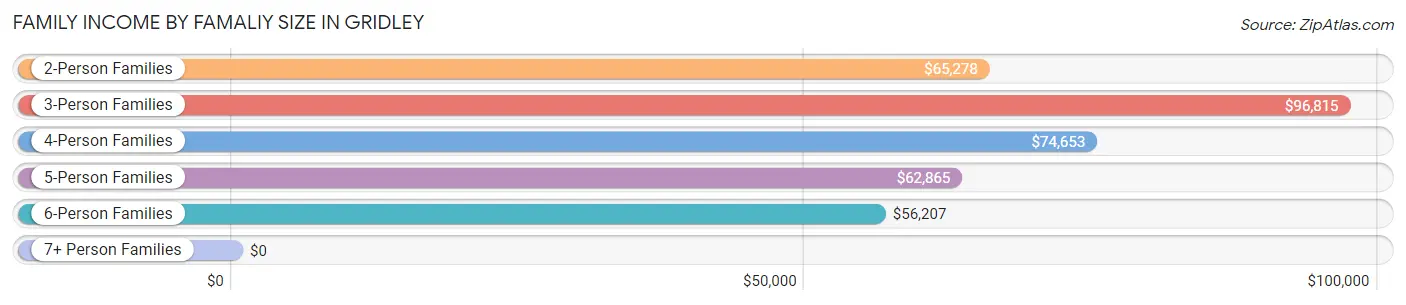
| Income Bracket | # Families | Median Income |
| 2-Person Families | 676 (37.5%) | $65,278 |
| 3-Person Families | 339 (18.8%) | $96,815 |
| 4-Person Families | 380 (21.1%) | $74,653 |
| 5-Person Families | 173 (9.6%) | $62,865 |
| 6-Person Families | 197 (10.9%) | $56,207 |
| 7+ Person Families | 39 (2.2%) | $0 |
| Total | 1,804 (100.0%) | $65,463 |
Family Income by Number of Earners in Gridley
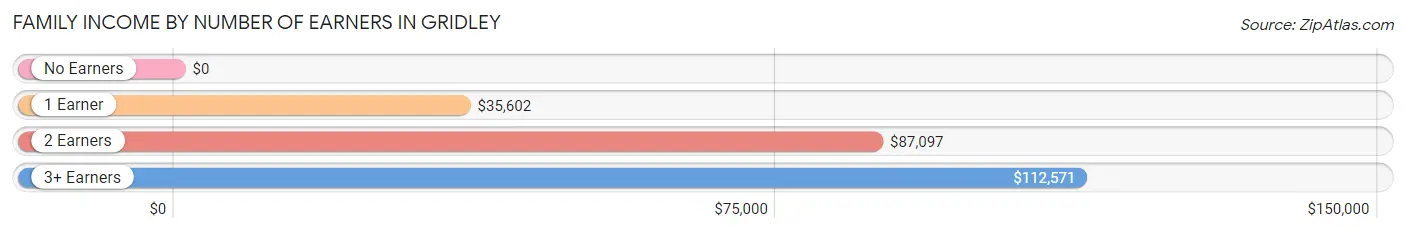
| Number of Earners | # Families | Median Income |
| No Earners | 220 (12.2%) | $0 |
| 1 Earner | 600 (33.3%) | $35,602 |
| 2 Earners | 760 (42.1%) | $87,097 |
| 3+ Earners | 224 (12.4%) | $112,571 |
| Total | 1,804 (100.0%) | $65,463 |
Household Income in Gridley
Household Income Brackets in Gridley
With 485 households falling in the category, the $35,000 to $49,999 income range is the most frequent in Gridley, accounting for 20.2% of all households. In contrast, only 22 households (0.9%) fall into the less than $10,000 income bracket, making it the least populous group.
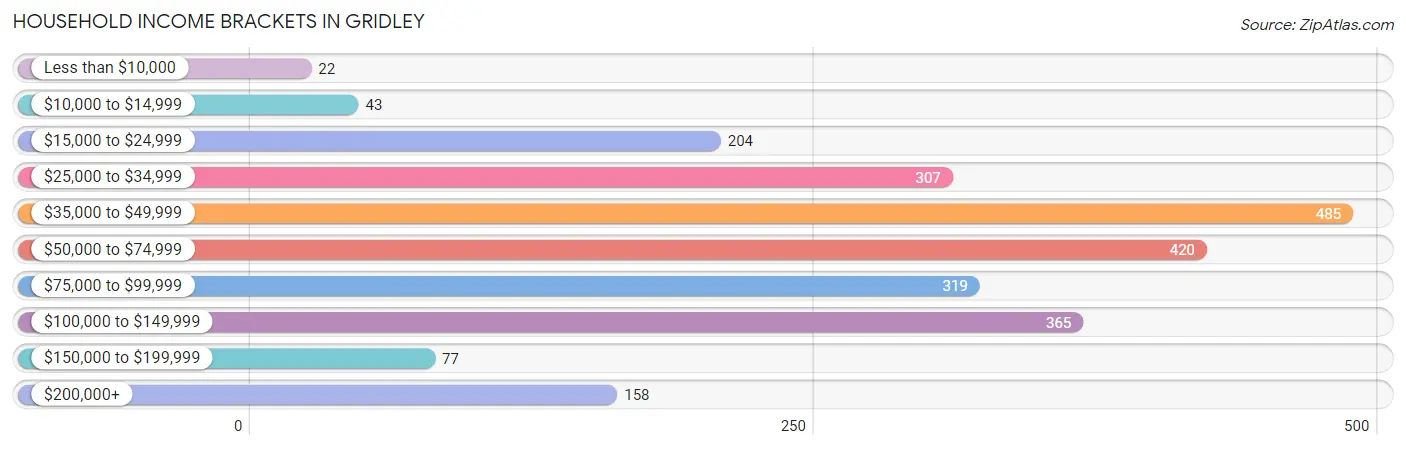
| Income Bracket | # Households | % Households |
| Less than $10,000 | 22 | 0.9% |
| $10,000 to $14,999 | 43 | 1.8% |
| $15,000 to $24,999 | 204 | 8.5% |
| $25,000 to $34,999 | 307 | 12.8% |
| $35,000 to $49,999 | 485 | 20.2% |
| $50,000 to $74,999 | 420 | 17.5% |
| $75,000 to $99,999 | 319 | 13.3% |
| $100,000 to $149,999 | 365 | 15.2% |
| $150,000 to $199,999 | 77 | 3.2% |
| $200,000+ | 158 | 6.6% |
Household Income by Householder Age in Gridley
The median household income in Gridley is $56,428, with the highest median household income of $80,500 found in the 45 to 64 years age bracket for the primary householder. A total of 978 households (40.7%) fall into this category. Meanwhile, the 65+ years age bracket for the primary householder has the lowest median household income of $38,728, with 477 households (19.9%) in this group.
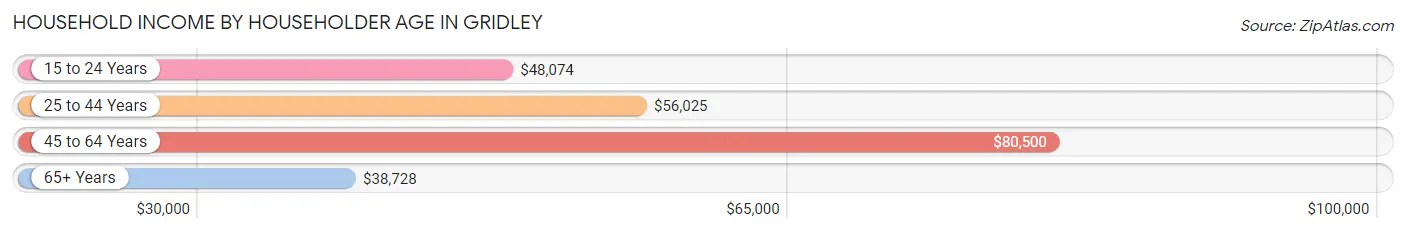
| Income Bracket | # Households | Median Income |
| 15 to 24 Years | 119 (5.0%) | $48,074 |
| 25 to 44 Years | 827 (34.4%) | $56,025 |
| 45 to 64 Years | 978 (40.7%) | $80,500 |
| 65+ Years | 477 (19.9%) | $38,728 |
| Total | 2,401 (100.0%) | $56,428 |
Poverty in Gridley
Income Below Poverty by Sex and Age in Gridley
With 10.3% poverty level for males and 8.8% for females among the residents of Gridley, under 5 year old males and 5 year old females are the most vulnerable to poverty, with 65 males (33.3%) and 9 females (100.0%) in their respective age groups living below the poverty level.
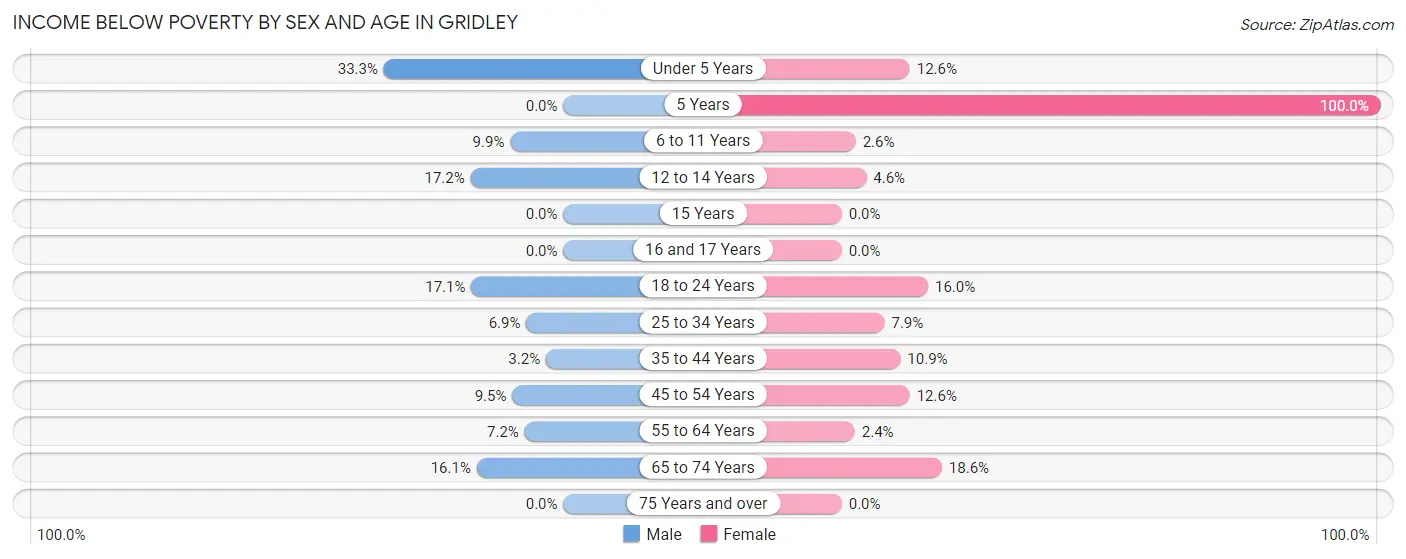
| Age Bracket | Male | Female |
| Under 5 Years | 65 (33.3%) | 37 (12.6%) |
| 5 Years | 0 (0.0%) | 9 (100.0%) |
| 6 to 11 Years | 58 (9.9%) | 13 (2.6%) |
| 12 to 14 Years | 46 (17.2%) | 6 (4.5%) |
| 15 Years | 0 (0.0%) | 0 (0.0%) |
| 16 and 17 Years | 0 (0.0%) | 0 (0.0%) |
| 18 to 24 Years | 55 (17.1%) | 65 (16.0%) |
| 25 to 34 Years | 25 (6.9%) | 43 (7.9%) |
| 35 to 44 Years | 16 (3.2%) | 48 (10.9%) |
| 45 to 54 Years | 41 (9.5%) | 59 (12.6%) |
| 55 to 64 Years | 25 (7.2%) | 12 (2.4%) |
| 65 to 74 Years | 32 (16.1%) | 42 (18.6%) |
| 75 Years and over | 0 (0.0%) | 0 (0.0%) |
| Total | 363 (10.3%) | 334 (8.8%) |
Income Above Poverty by Sex and Age in Gridley
According to the poverty statistics in Gridley, males aged 5 years and females aged 15 years are the age groups that are most secure financially, with 100.0% of males and 100.0% of females in these age groups living above the poverty line.
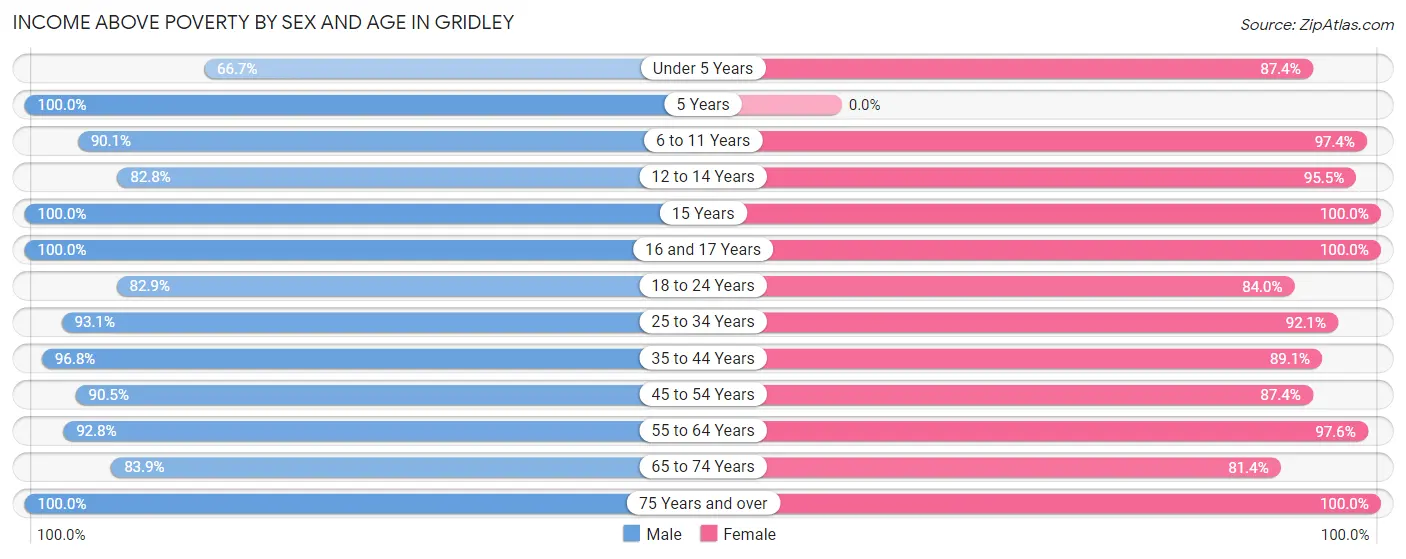
| Age Bracket | Male | Female |
| Under 5 Years | 130 (66.7%) | 256 (87.4%) |
| 5 Years | 20 (100.0%) | 0 (0.0%) |
| 6 to 11 Years | 530 (90.1%) | 491 (97.4%) |
| 12 to 14 Years | 221 (82.8%) | 126 (95.5%) |
| 15 Years | 75 (100.0%) | 39 (100.0%) |
| 16 and 17 Years | 66 (100.0%) | 104 (100.0%) |
| 18 to 24 Years | 267 (82.9%) | 341 (84.0%) |
| 25 to 34 Years | 339 (93.1%) | 499 (92.1%) |
| 35 to 44 Years | 481 (96.8%) | 393 (89.1%) |
| 45 to 54 Years | 392 (90.5%) | 409 (87.4%) |
| 55 to 64 Years | 323 (92.8%) | 484 (97.6%) |
| 65 to 74 Years | 167 (83.9%) | 184 (81.4%) |
| 75 Years and over | 141 (100.0%) | 152 (100.0%) |
| Total | 3,152 (89.7%) | 3,478 (91.2%) |
Income Below Poverty Among Married-Couple Families in Gridley
The poverty statistics for married-couple families in Gridley show that 4.6% or 59 of the total 1,279 families live below the poverty line. Families with 5 or more children have the highest poverty rate of 37.9%, comprising of 11 families. On the other hand, families with 1 or 2 children have the lowest poverty rate of 0.0%, which includes 0 families.
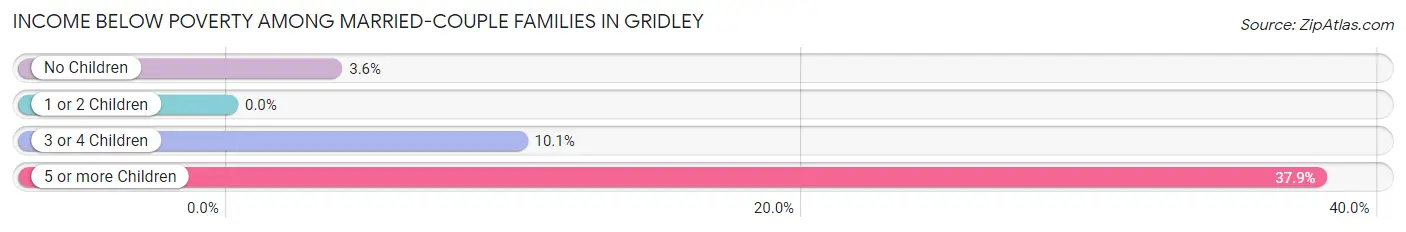
| Children | Above Poverty | Below Poverty |
| No Children | 584 (96.4%) | 22 (3.6%) |
| 1 or 2 Children | 386 (100.0%) | 0 (0.0%) |
| 3 or 4 Children | 232 (89.9%) | 26 (10.1%) |
| 5 or more Children | 18 (62.1%) | 11 (37.9%) |
| Total | 1,220 (95.4%) | 59 (4.6%) |
Income Below Poverty Among Single-Parent Households in Gridley
According to the poverty data in Gridley, 11.8% or 20 single-father households and 16.6% or 59 single-mother households are living below the poverty line. Among single-father households, those with no children have the highest poverty rate, with 20 households (22.5%) experiencing poverty. Likewise, among single-mother households, those with 3 or 4 children have the highest poverty rate, with 11 households (26.8%) falling below the poverty line.
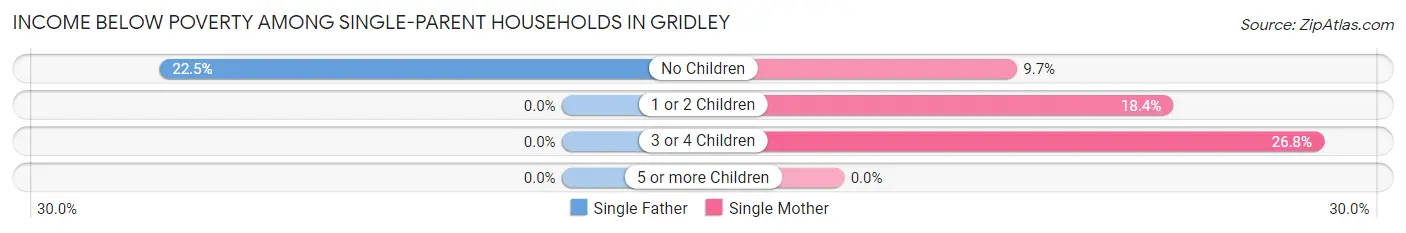
| Children | Single Father | Single Mother |
| No Children | 20 (22.5%) | 11 (9.7%) |
| 1 or 2 Children | 0 (0.0%) | 37 (18.4%) |
| 3 or 4 Children | 0 (0.0%) | 11 (26.8%) |
| 5 or more Children | 0 (0.0%) | 0 (0.0%) |
| Total | 20 (11.8%) | 59 (16.6%) |
Income Below Poverty Among Married-Couple vs Single-Parent Households in Gridley
The poverty data for Gridley shows that 59 of the married-couple family households (4.6%) and 79 of the single-parent households (15.0%) are living below the poverty level. Within the married-couple family households, those with 5 or more children have the highest poverty rate, with 11 households (37.9%) falling below the poverty line. Among the single-parent households, those with 3 or 4 children have the highest poverty rate, with 11 household (25.0%) living below poverty.
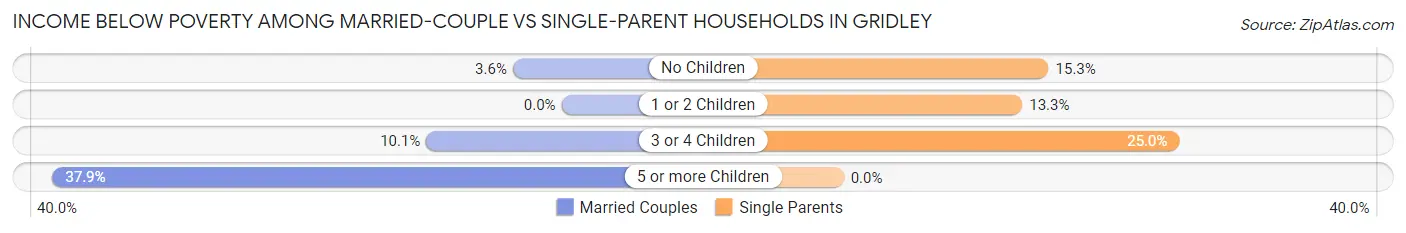
| Children | Married-Couple Families | Single-Parent Households |
| No Children | 22 (3.6%) | 31 (15.3%) |
| 1 or 2 Children | 0 (0.0%) | 37 (13.3%) |
| 3 or 4 Children | 26 (10.1%) | 11 (25.0%) |
| 5 or more Children | 11 (37.9%) | 0 (0.0%) |
| Total | 59 (4.6%) | 79 (15.0%) |
Race in Gridley
The most populous races in Gridley are White / Caucasian (5,364 | 72.1%), Hispanic or Latino (2,832 | 38.0%), and Some other Race (1,116 | 15.0%).
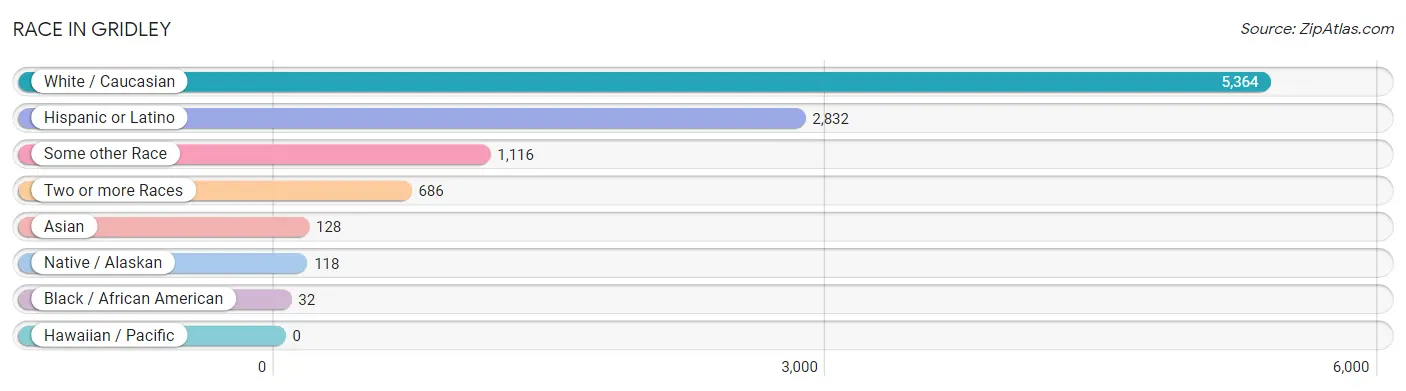
| Race | # Population | % Population |
| Asian | 128 | 1.7% |
| Black / African American | 32 | 0.4% |
| Hawaiian / Pacific | 0 | 0.0% |
| Hispanic or Latino | 2,832 | 38.0% |
| Native / Alaskan | 118 | 1.6% |
| White / Caucasian | 5,364 | 72.1% |
| Two or more Races | 686 | 9.2% |
| Some other Race | 1,116 | 15.0% |
| Total | 7,444 | 100.0% |
Ancestry in Gridley
The most populous ancestries reported in Gridley are Mexican (2,445 | 32.9%), German (873 | 11.7%), American (795 | 10.7%), Irish (412 | 5.5%), and English (405 | 5.4%), together accounting for 66.2% of all Gridley residents.
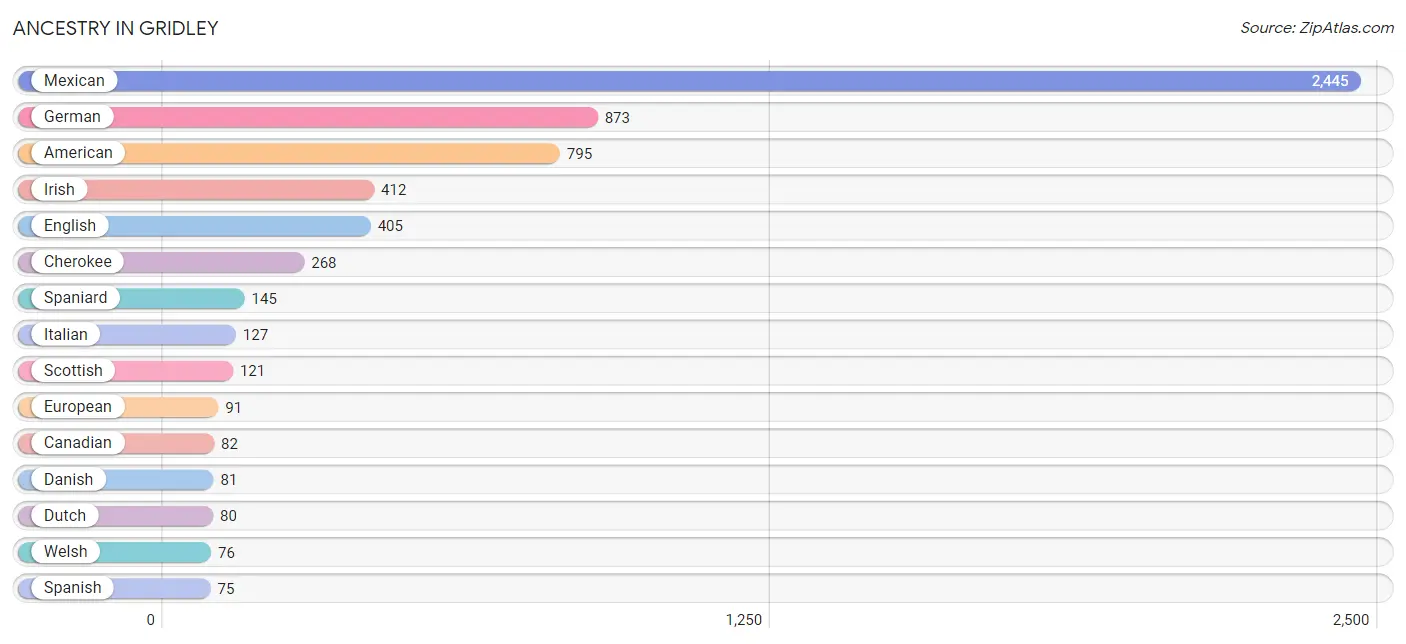
| Ancestry | # Population | % Population |
| American | 795 | 10.7% |
| Arab | 30 | 0.4% |
| Argentinean | 38 | 0.5% |
| Austrian | 16 | 0.2% |
| Bhutanese | 13 | 0.2% |
| British | 71 | 0.9% |
| Burmese | 53 | 0.7% |
| Canadian | 82 | 1.1% |
| Central American | 59 | 0.8% |
| Central American Indian | 31 | 0.4% |
| Cherokee | 268 | 3.6% |
| Danish | 81 | 1.1% |
| Dutch | 80 | 1.1% |
| Dutch West Indian | 13 | 0.2% |
| English | 405 | 5.4% |
| European | 91 | 1.2% |
| Filipino | 12 | 0.2% |
| Finnish | 10 | 0.1% |
| French | 55 | 0.7% |
| French Canadian | 25 | 0.3% |
| German | 873 | 11.7% |
| Greek | 31 | 0.4% |
| Indian (Asian) | 7 | 0.1% |
| Irish | 412 | 5.5% |
| Italian | 127 | 1.7% |
| Mexican | 2,445 | 32.9% |
| Mexican American Indian | 16 | 0.2% |
| Navajo | 16 | 0.2% |
| Norwegian | 44 | 0.6% |
| Paiute | 5 | 0.1% |
| Pakistani | 29 | 0.4% |
| Peruvian | 31 | 0.4% |
| Portuguese | 25 | 0.3% |
| Pueblo | 21 | 0.3% |
| Puerto Rican | 22 | 0.3% |
| Russian | 14 | 0.2% |
| Salvadoran | 59 | 0.8% |
| Scandinavian | 10 | 0.1% |
| Scotch-Irish | 40 | 0.5% |
| Scottish | 121 | 1.6% |
| South American | 69 | 0.9% |
| Spaniard | 145 | 1.9% |
| Spanish | 75 | 1.0% |
| Swedish | 60 | 0.8% |
| Thai | 34 | 0.5% |
| Ukrainian | 16 | 0.2% |
| Welsh | 76 | 1.0% | View All 47 Rows |
Immigrants in Gridley
The most numerous immigrant groups reported in Gridley came from Central America (951 | 12.8%), Latin America (951 | 12.8%), Mexico (918 | 12.3%), Asia (73 | 1.0%), and South Central Asia (54 | 0.7%), together accounting for 39.6% of all Gridley residents.
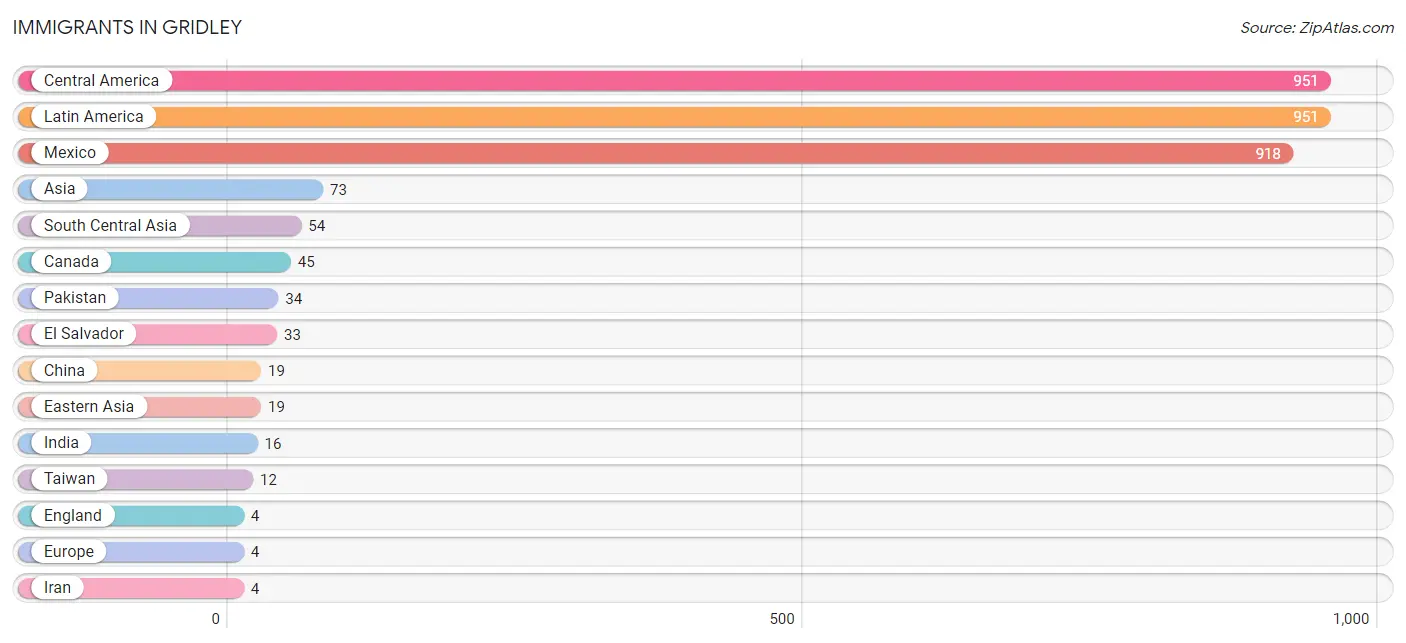
| Immigration Origin | # Population | % Population |
| Asia | 73 | 1.0% |
| Canada | 45 | 0.6% |
| Central America | 951 | 12.8% |
| China | 19 | 0.3% |
| Eastern Asia | 19 | 0.3% |
| El Salvador | 33 | 0.4% |
| England | 4 | 0.1% |
| Europe | 4 | 0.1% |
| India | 16 | 0.2% |
| Iran | 4 | 0.1% |
| Latin America | 951 | 12.8% |
| Mexico | 918 | 12.3% |
| Northern Europe | 4 | 0.1% |
| Pakistan | 34 | 0.5% |
| South Central Asia | 54 | 0.7% |
| Taiwan | 12 | 0.2% | View All 16 Rows |
Sex and Age in Gridley
Sex and Age in Gridley
The most populous age groups in Gridley are 5 to 9 Years (536 | 15.1%) for men and 5 to 9 Years (400 | 10.3%) for women.
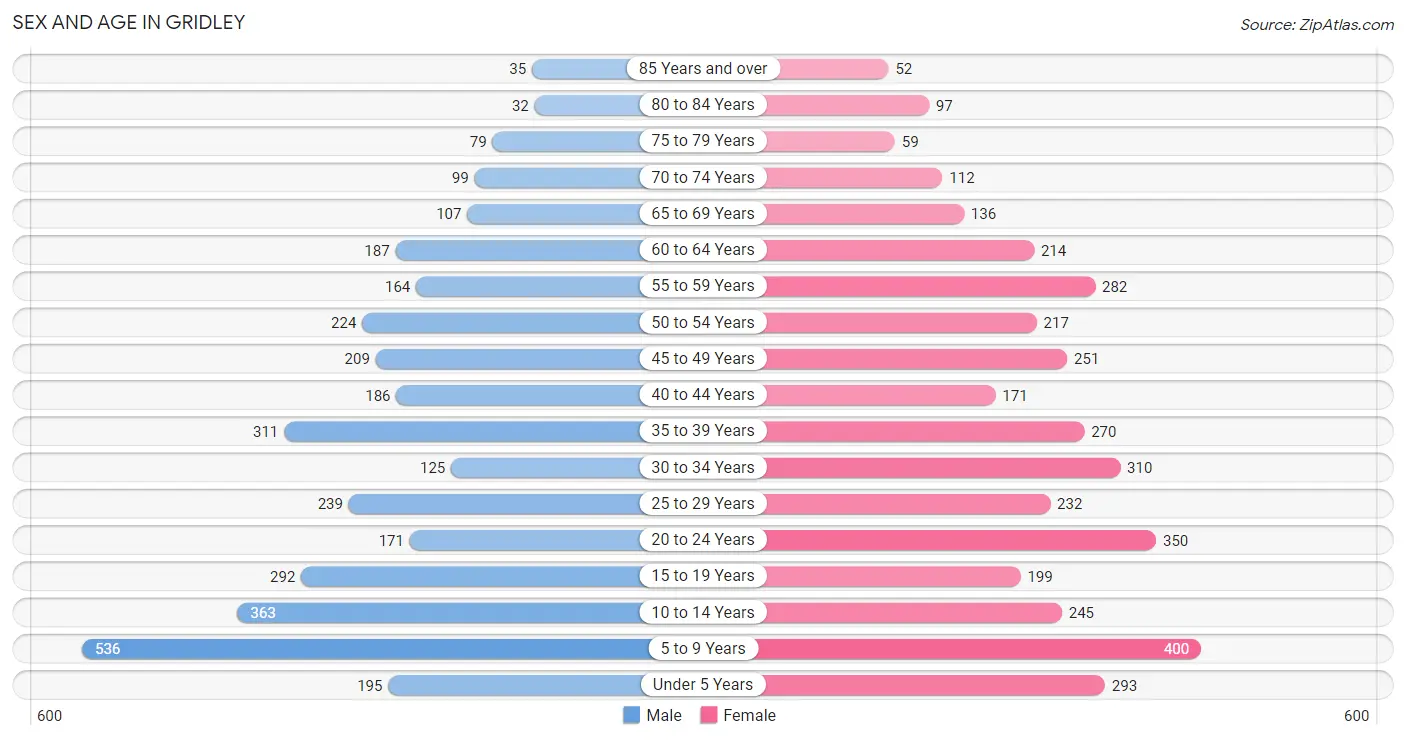
| Age Bracket | Male | Female |
| Under 5 Years | 195 (5.5%) | 293 (7.5%) |
| 5 to 9 Years | 536 (15.1%) | 400 (10.3%) |
| 10 to 14 Years | 363 (10.2%) | 245 (6.3%) |
| 15 to 19 Years | 292 (8.2%) | 199 (5.1%) |
| 20 to 24 Years | 171 (4.8%) | 350 (9.0%) |
| 25 to 29 Years | 239 (6.7%) | 232 (6.0%) |
| 30 to 34 Years | 125 (3.5%) | 310 (8.0%) |
| 35 to 39 Years | 311 (8.7%) | 270 (6.9%) |
| 40 to 44 Years | 186 (5.2%) | 171 (4.4%) |
| 45 to 49 Years | 209 (5.9%) | 251 (6.5%) |
| 50 to 54 Years | 224 (6.3%) | 217 (5.6%) |
| 55 to 59 Years | 164 (4.6%) | 282 (7.2%) |
| 60 to 64 Years | 187 (5.3%) | 214 (5.5%) |
| 65 to 69 Years | 107 (3.0%) | 136 (3.5%) |
| 70 to 74 Years | 99 (2.8%) | 112 (2.9%) |
| 75 to 79 Years | 79 (2.2%) | 59 (1.5%) |
| 80 to 84 Years | 32 (0.9%) | 97 (2.5%) |
| 85 Years and over | 35 (1.0%) | 52 (1.3%) |
| Total | 3,554 (100.0%) | 3,890 (100.0%) |
Families and Households in Gridley
Median Family Size in Gridley
The median family size in Gridley is 3.57 persons per family, with married-couple families (1,279 | 70.9%) accounting for the largest median family size of 3.77 persons per family. On the other hand, single male/father families (169 | 9.4%) represent the smallest median family size with 2.44 persons per family.
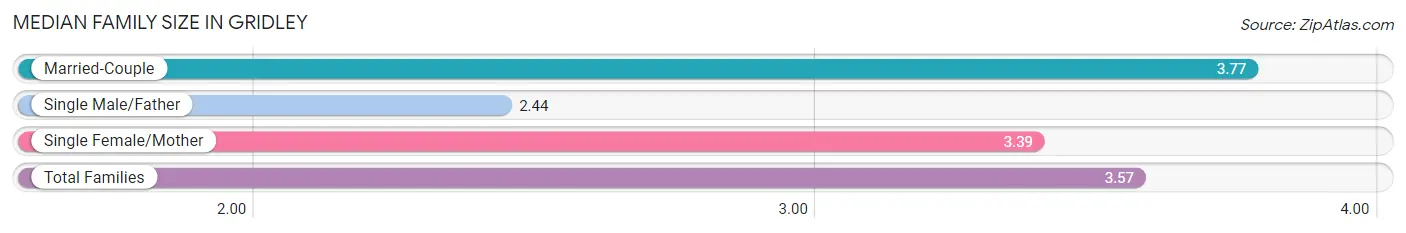
| Family Type | # Families | Family Size |
| Married-Couple | 1,279 (70.9%) | 3.77 |
| Single Male/Father | 169 (9.4%) | 2.44 |
| Single Female/Mother | 356 (19.7%) | 3.39 |
| Total Families | 1,804 (100.0%) | 3.57 |
Median Household Size in Gridley
The median household size in Gridley is 3.04 persons per household, with married-couple households (1,279 | 53.3%) accounting for the largest median household size of 3.78 persons per household. non-family households (597 | 24.9%) represent the smallest median household size with 1.05 persons per household.
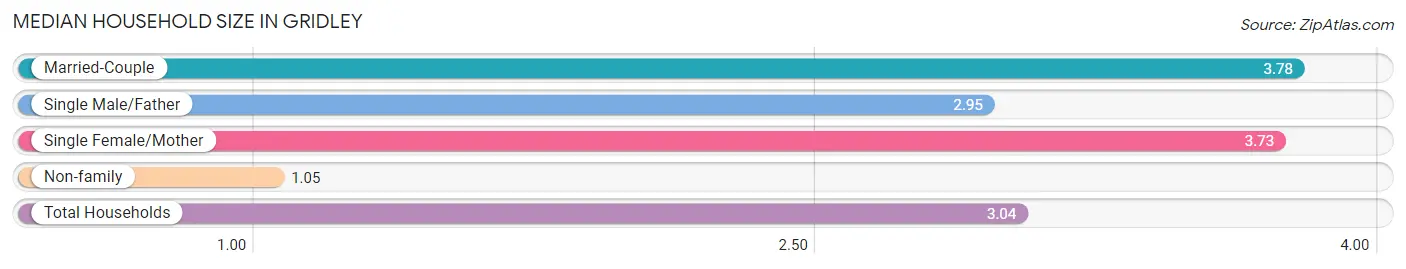
| Household Type | # Households | Household Size |
| Married-Couple | 1,279 (53.3%) | 3.78 |
| Single Male/Father | 169 (7.0%) | 2.95 |
| Single Female/Mother | 356 (14.8%) | 3.73 |
| Non-family | 597 (24.9%) | 1.05 |
| Total Households | 2,401 (100.0%) | 3.04 |
Household Size by Marriage Status in Gridley
Out of a total of 2,401 households in Gridley, 1,804 (75.1%) are family households, while 597 (24.9%) are nonfamily households. The most numerous type of family households are 2-person households, comprising 619, and the most common type of nonfamily households are 1-person households, comprising 559.
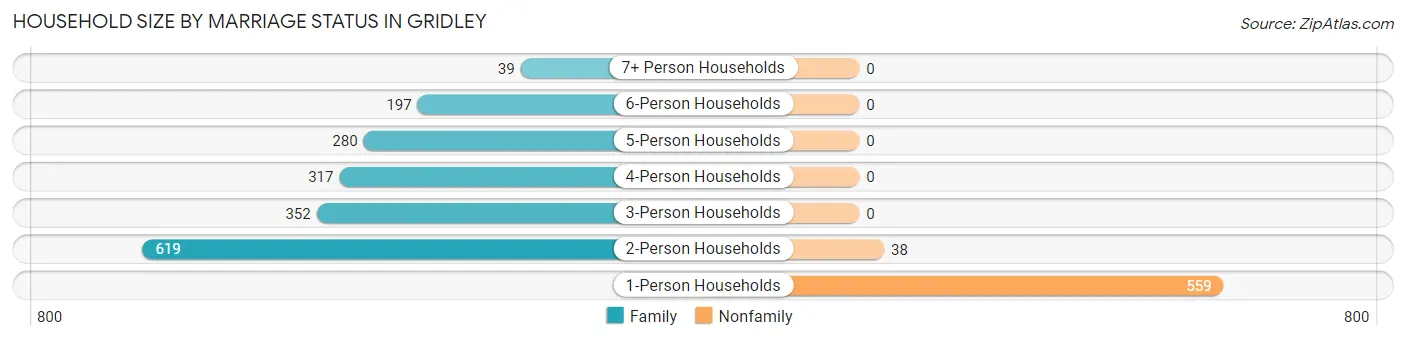
| Household Size | Family Households | Nonfamily Households |
| 1-Person Households | - | 559 (23.3%) |
| 2-Person Households | 619 (25.8%) | 38 (1.6%) |
| 3-Person Households | 352 (14.7%) | 0 (0.0%) |
| 4-Person Households | 317 (13.2%) | 0 (0.0%) |
| 5-Person Households | 280 (11.7%) | 0 (0.0%) |
| 6-Person Households | 197 (8.2%) | 0 (0.0%) |
| 7+ Person Households | 39 (1.6%) | 0 (0.0%) |
| Total | 1,804 (75.1%) | 597 (24.9%) |
Female Fertility in Gridley
Fertility by Age in Gridley
Average fertility rate in Gridley is 104.0 births per 1,000 women. Women in the age bracket of 20 to 34 years have the highest fertility rate with 200.0 births per 1,000 women. Women in the age bracket of 20 to 34 years acount for 91.7% of all women with births.
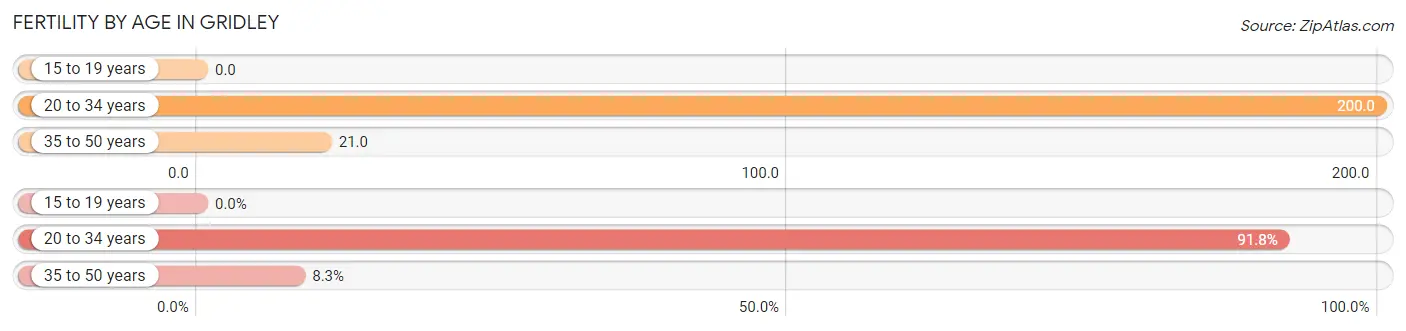
| Age Bracket | Women with Births | Births / 1,000 Women |
| 15 to 19 years | 0 (0.0%) | 0.0 |
| 20 to 34 years | 178 (91.7%) | 200.0 |
| 35 to 50 years | 16 (8.3%) | 21.0 |
| Total | 194 (100.0%) | 104.0 |
Fertility by Age by Marriage Status in Gridley
73.2% of women with births (194) in Gridley are married. The highest percentage of unmarried women with births falls into 20 to 34 years age bracket with 29.2% of them unmarried at the time of birth, while the lowest percentage of unmarried women with births belong to 35 to 50 years age bracket with 0.0% of them unmarried.
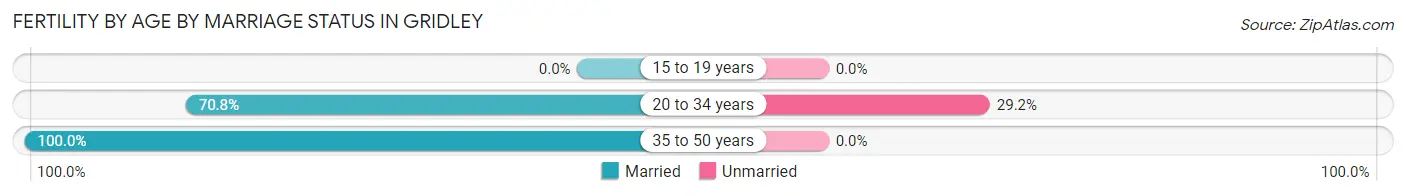
| Age Bracket | Married | Unmarried |
| 15 to 19 years | 0 (0.0%) | 0 (0.0%) |
| 20 to 34 years | 126 (70.8%) | 52 (29.2%) |
| 35 to 50 years | 16 (100.0%) | 0 (0.0%) |
| Total | 142 (73.2%) | 52 (26.8%) |
Fertility by Education in Gridley
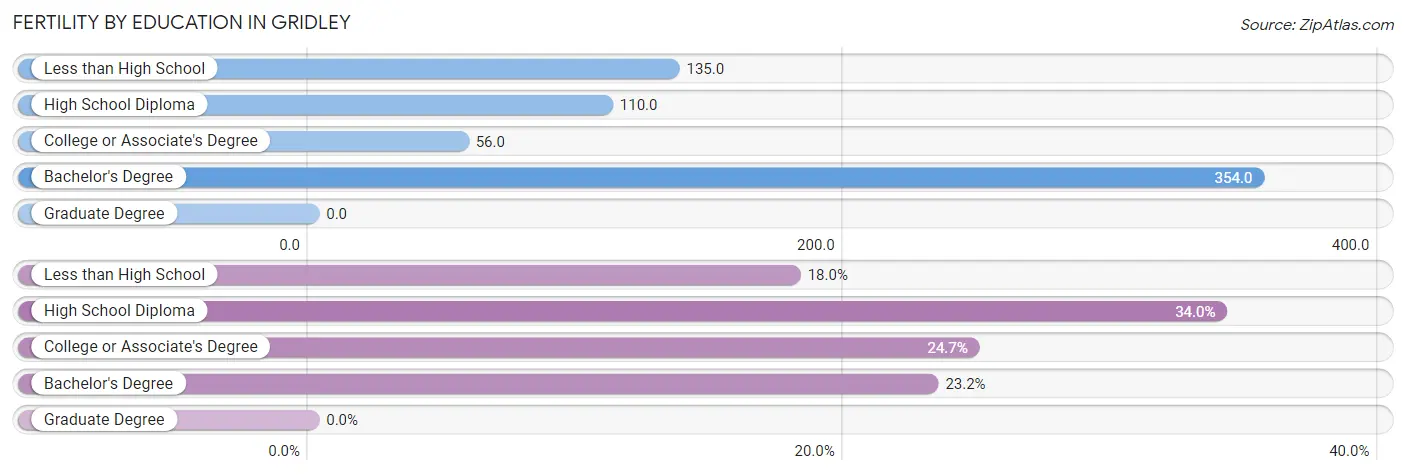
| Educational Attainment | Women with Births | Births / 1,000 Women |
| Less than High School | 35 (18.0%) | 135.0 |
| High School Diploma | 66 (34.0%) | 110.0 |
| College or Associate's Degree | 48 (24.7%) | 56.0 |
| Bachelor's Degree | 45 (23.2%) | 354.0 |
| Graduate Degree | 0 (0.0%) | 0.0 |
| Total | 194 (100.0%) | 104.0 |
Fertility by Education by Marriage Status in Gridley
26.8% of women with births in Gridley are unmarried. Women with the educational attainment of college or associate's degree are most likely to be married with 100.0% of them married at childbirth, while women with the educational attainment of high school diploma are least likely to be married with 56.1% of them unmarried at childbirth.
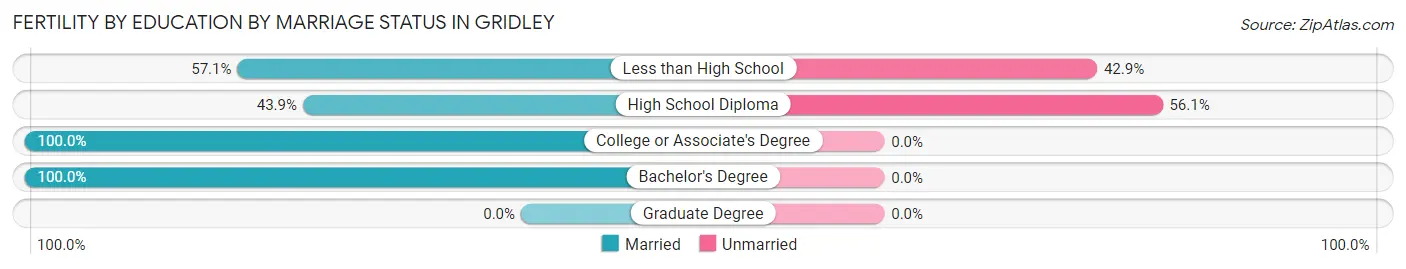
| Educational Attainment | Married | Unmarried |
| Less than High School | 20 (57.1%) | 15 (42.9%) |
| High School Diploma | 29 (43.9%) | 37 (56.1%) |
| College or Associate's Degree | 48 (100.0%) | 0 (0.0%) |
| Bachelor's Degree | 45 (100.0%) | 0 (0.0%) |
| Graduate Degree | 0 (0.0%) | 0 (0.0%) |
| Total | 142 (73.2%) | 52 (26.8%) |
Employment Characteristics in Gridley
Employment by Class of Employer in Gridley
Among the 2,893 employed individuals in Gridley, private company employees (1,969 | 68.1%), local government employees (317 | 11.0%), and not-for-profit organizations (259 | 8.9%) make up the most common classes of employment.
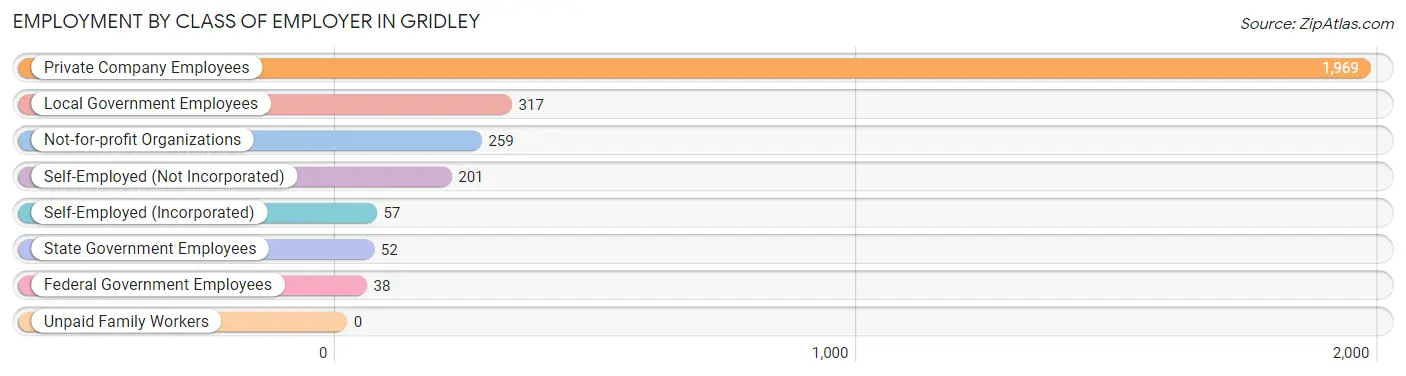
| Employer Class | # Employees | % Employees |
| Private Company Employees | 1,969 | 68.1% |
| Self-Employed (Incorporated) | 57 | 2.0% |
| Self-Employed (Not Incorporated) | 201 | 7.0% |
| Not-for-profit Organizations | 259 | 8.9% |
| Local Government Employees | 317 | 11.0% |
| State Government Employees | 52 | 1.8% |
| Federal Government Employees | 38 | 1.3% |
| Unpaid Family Workers | 0 | 0.0% |
| Total | 2,893 | 100.0% |
Employment Status by Age in Gridley
According to the labor force statistics for Gridley, out of the total population over 16 years of age (5,298), 62.9% or 3,332 individuals are in the labor force, with 10.8% or 360 of them unemployed. The age group with the highest labor force participation rate is 25 to 29 years, with 95.5% or 450 individuals in the labor force. Within the labor force, the 60 to 64 years age range has the highest percentage of unemployed individuals, with 35.8% or 82 of them being unemployed.
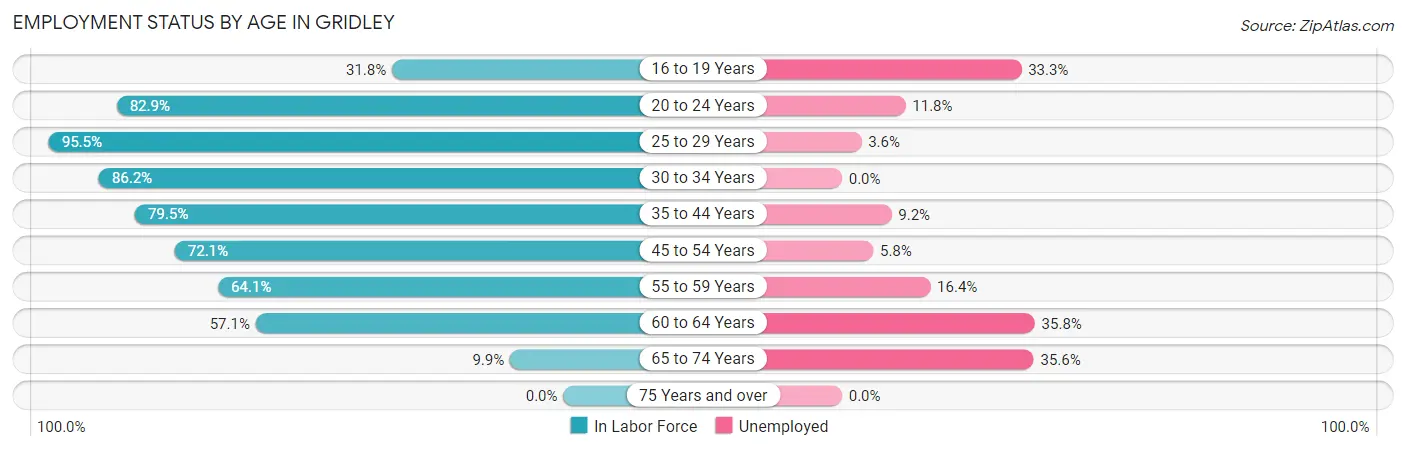
| Age Bracket | In Labor Force | Unemployed |
| 16 to 19 Years | 120 (31.8%) | 40 (33.3%) |
| 20 to 24 Years | 432 (82.9%) | 51 (11.8%) |
| 25 to 29 Years | 450 (95.5%) | 16 (3.6%) |
| 30 to 34 Years | 375 (86.2%) | 0 (0.0%) |
| 35 to 44 Years | 746 (79.5%) | 69 (9.2%) |
| 45 to 54 Years | 650 (72.1%) | 38 (5.8%) |
| 55 to 59 Years | 286 (64.1%) | 47 (16.4%) |
| 60 to 64 Years | 229 (57.1%) | 82 (35.8%) |
| 65 to 74 Years | 45 (9.9%) | 16 (35.6%) |
| 75 Years and over | 0 (0.0%) | 0 (0.0%) |
| Total | 3,332 (62.9%) | 360 (10.8%) |
Employment Status by Educational Attainment in Gridley
According to labor force statistics for Gridley, 76.2% of individuals (2,737) out of the total population between 25 and 64 years of age (3,592) are in the labor force, with 9.2% or 252 of them being unemployed. The group with the highest labor force participation rate are those with the educational attainment of college / associate degree, with 84.9% or 1,375 individuals in the labor force. Within the labor force, individuals with less than high school education have the highest percentage of unemployment, with 34.8% or 119 of them being unemployed.
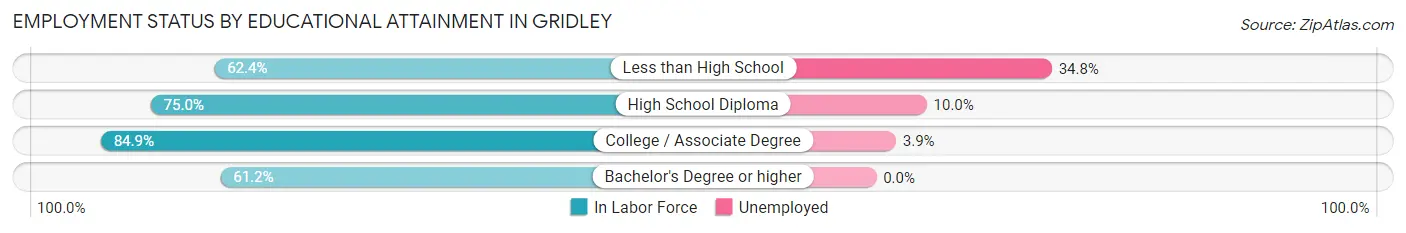
| Educational Attainment | In Labor Force | Unemployed |
| Less than High School | 342 (62.4%) | 191 (34.8%) |
| High School Diploma | 800 (75.0%) | 107 (10.0%) |
| College / Associate Degree | 1,375 (84.9%) | 63 (3.9%) |
| Bachelor's Degree or higher | 219 (61.2%) | 0 (0.0%) |
| Total | 2,737 (76.2%) | 330 (9.2%) |
Employment Occupations by Sex in Gridley
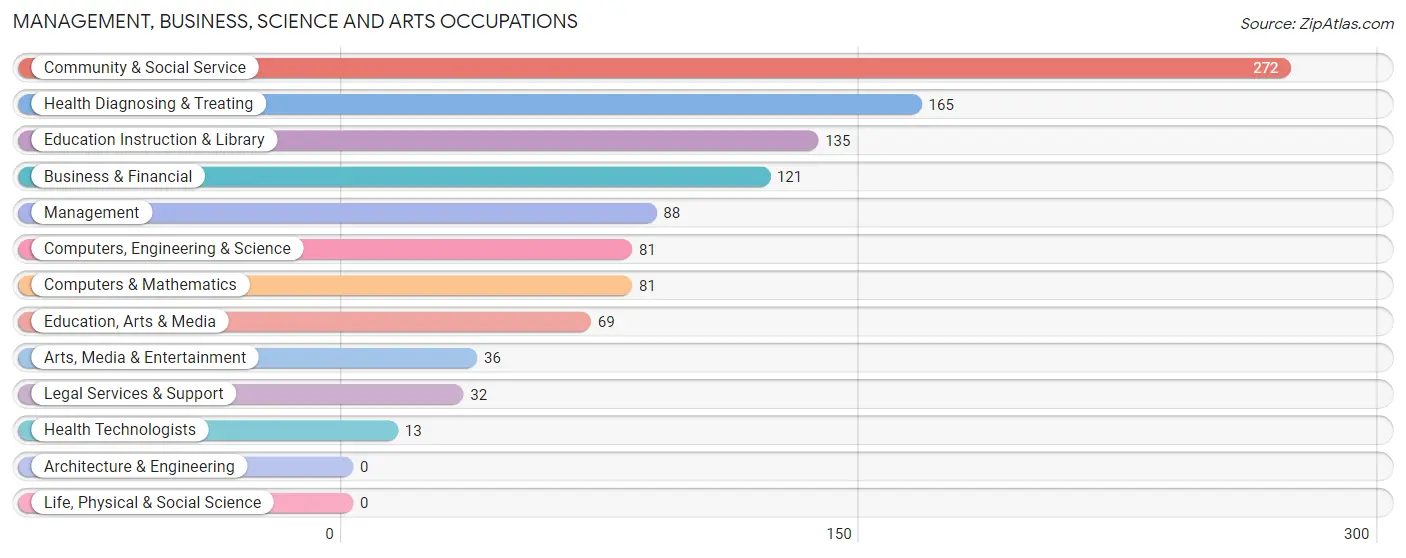
Management, Business, Science and Arts Occupations
The most common Management, Business, Science and Arts occupations in Gridley are Community & Social Service (272 | 9.1%), Health Diagnosing & Treating (165 | 5.6%), Education Instruction & Library (135 | 4.5%), Business & Financial (121 | 4.1%), and Management (88 | 3.0%).
Management, Business, Science and Arts Occupations by Sex
Within the Management, Business, Science and Arts occupations in Gridley, the most male-oriented occupations are Arts, Media & Entertainment (83.3%), Management (72.7%), and Computers, Engineering & Science (70.4%), while the most female-oriented occupations are Education, Arts & Media (100.0%), Legal Services & Support (100.0%), and Health Diagnosing & Treating (100.0%).
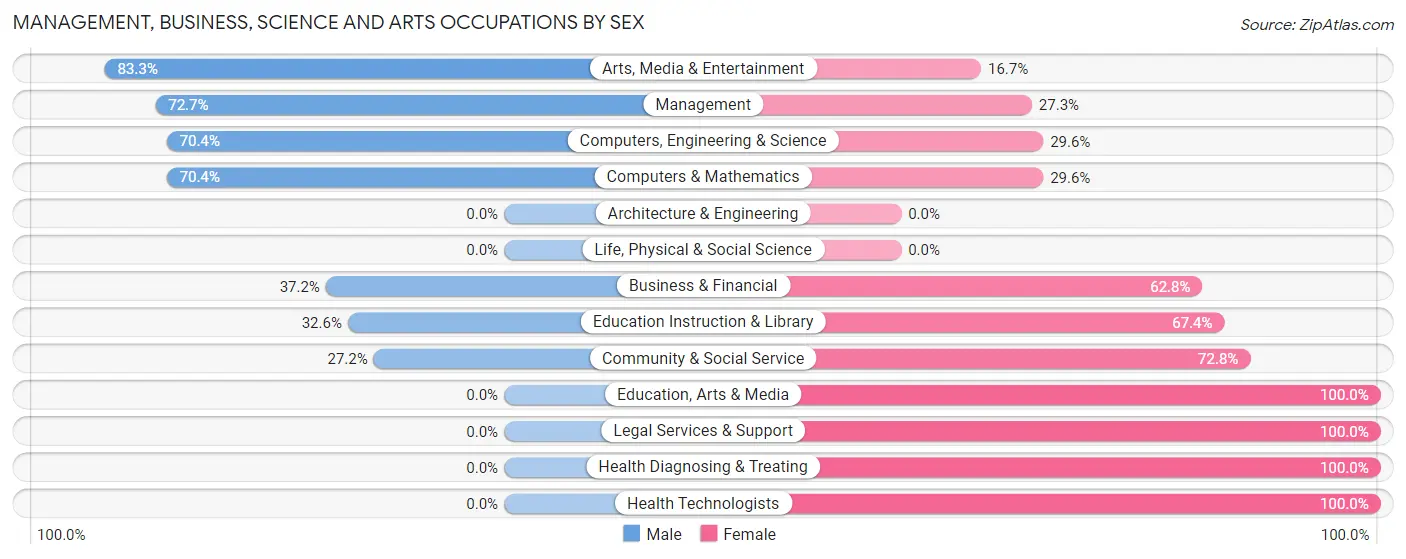
| Occupation | Male | Female |
| Management | 64 (72.7%) | 24 (27.3%) |
| Business & Financial | 45 (37.2%) | 76 (62.8%) |
| Computers, Engineering & Science | 57 (70.4%) | 24 (29.6%) |
| Computers & Mathematics | 57 (70.4%) | 24 (29.6%) |
| Architecture & Engineering | 0 (0.0%) | 0 (0.0%) |
| Life, Physical & Social Science | 0 (0.0%) | 0 (0.0%) |
| Community & Social Service | 74 (27.2%) | 198 (72.8%) |
| Education, Arts & Media | 0 (0.0%) | 69 (100.0%) |
| Legal Services & Support | 0 (0.0%) | 32 (100.0%) |
| Education Instruction & Library | 44 (32.6%) | 91 (67.4%) |
| Arts, Media & Entertainment | 30 (83.3%) | 6 (16.7%) |
| Health Diagnosing & Treating | 0 (0.0%) | 165 (100.0%) |
| Health Technologists | 0 (0.0%) | 13 (100.0%) |
| Total (Category) | 240 (33.0%) | 487 (67.0%) |
| Total (Overall) | 1,421 (47.8%) | 1,553 (52.2%) |
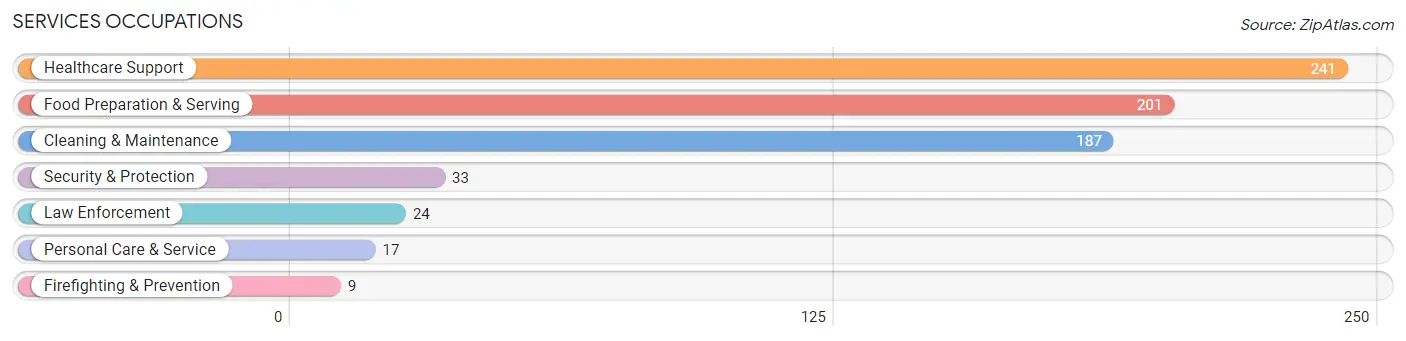
Services Occupations
The most common Services occupations in Gridley are Healthcare Support (241 | 8.1%), Food Preparation & Serving (201 | 6.8%), Cleaning & Maintenance (187 | 6.3%), Security & Protection (33 | 1.1%), and Law Enforcement (24 | 0.8%).
Services Occupations by Sex
Within the Services occupations in Gridley, the most male-oriented occupations are Security & Protection (100.0%), Firefighting & Prevention (100.0%), and Law Enforcement (100.0%), while the most female-oriented occupations are Personal Care & Service (100.0%), Healthcare Support (96.7%), and Food Preparation & Serving (55.7%).
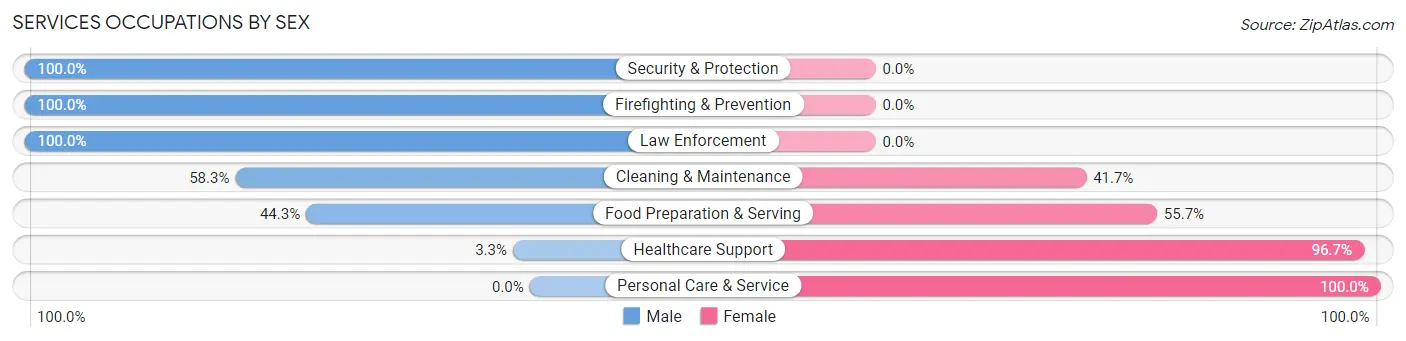
| Occupation | Male | Female |
| Healthcare Support | 8 (3.3%) | 233 (96.7%) |
| Security & Protection | 33 (100.0%) | 0 (0.0%) |
| Firefighting & Prevention | 9 (100.0%) | 0 (0.0%) |
| Law Enforcement | 24 (100.0%) | 0 (0.0%) |
| Food Preparation & Serving | 89 (44.3%) | 112 (55.7%) |
| Cleaning & Maintenance | 109 (58.3%) | 78 (41.7%) |
| Personal Care & Service | 0 (0.0%) | 17 (100.0%) |
| Total (Category) | 239 (35.2%) | 440 (64.8%) |
| Total (Overall) | 1,421 (47.8%) | 1,553 (52.2%) |
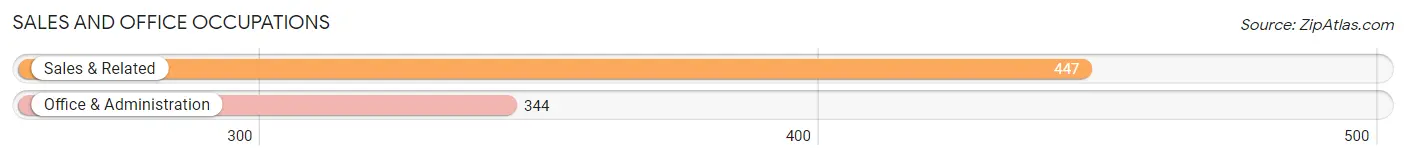
Sales and Office Occupations
The most common Sales and Office occupations in Gridley are Sales & Related (447 | 15.0%), and Office & Administration (344 | 11.6%).
Sales and Office Occupations by Sex
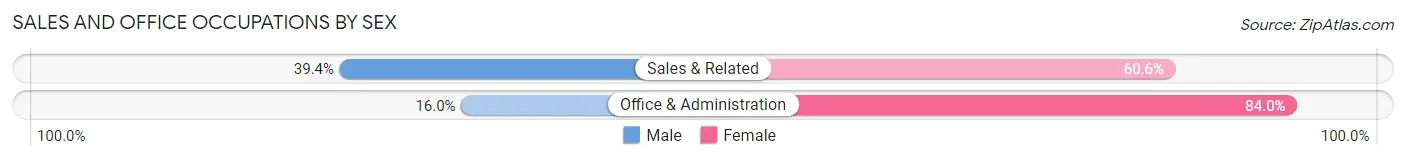
| Occupation | Male | Female |
| Sales & Related | 176 (39.4%) | 271 (60.6%) |
| Office & Administration | 55 (16.0%) | 289 (84.0%) |
| Total (Category) | 231 (29.2%) | 560 (70.8%) |
| Total (Overall) | 1,421 (47.8%) | 1,553 (52.2%) |
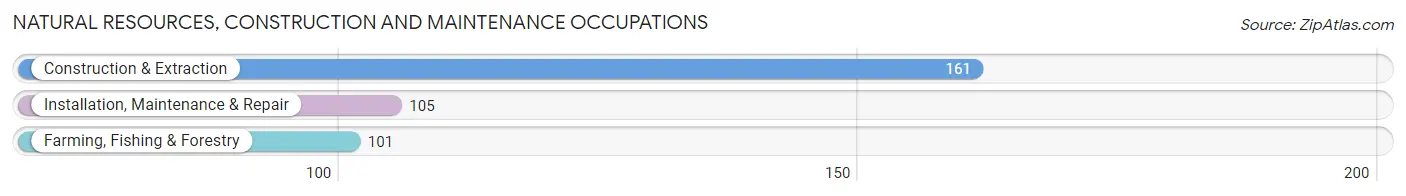
Natural Resources, Construction and Maintenance Occupations
The most common Natural Resources, Construction and Maintenance occupations in Gridley are Construction & Extraction (161 | 5.4%), Installation, Maintenance & Repair (105 | 3.5%), and Farming, Fishing & Forestry (101 | 3.4%).
Natural Resources, Construction and Maintenance Occupations by Sex
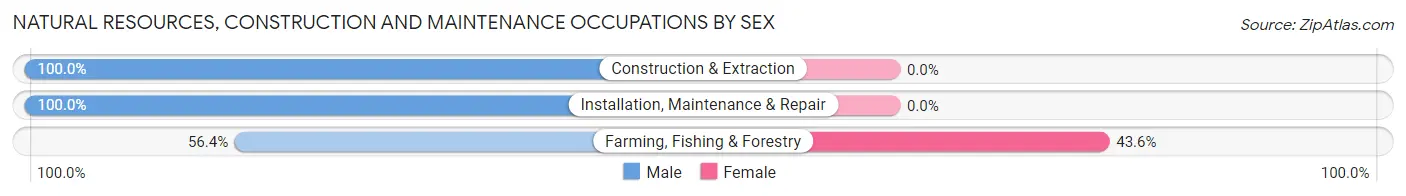
| Occupation | Male | Female |
| Farming, Fishing & Forestry | 57 (56.4%) | 44 (43.6%) |
| Construction & Extraction | 161 (100.0%) | 0 (0.0%) |
| Installation, Maintenance & Repair | 105 (100.0%) | 0 (0.0%) |
| Total (Category) | 323 (88.0%) | 44 (12.0%) |
| Total (Overall) | 1,421 (47.8%) | 1,553 (52.2%) |
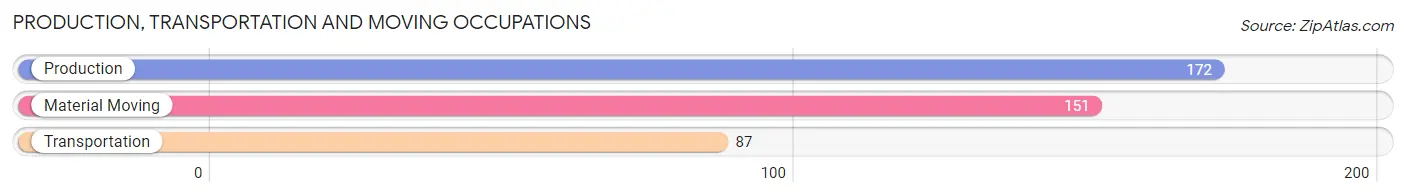
Production, Transportation and Moving Occupations
The most common Production, Transportation and Moving occupations in Gridley are Production (172 | 5.8%), Material Moving (151 | 5.1%), and Transportation (87 | 2.9%).
Production, Transportation and Moving Occupations by Sex
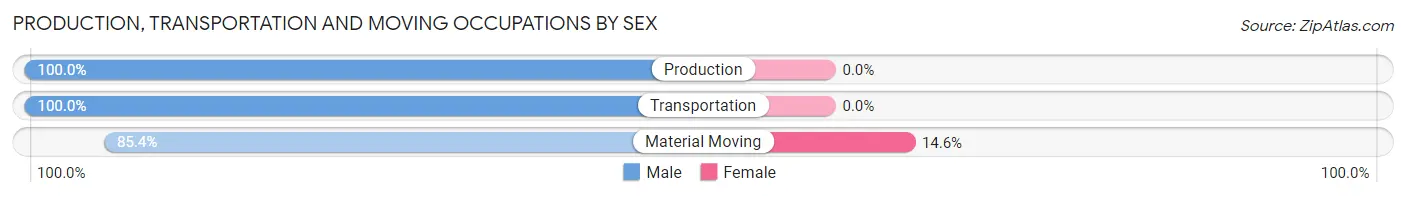
| Occupation | Male | Female |
| Production | 172 (100.0%) | 0 (0.0%) |
| Transportation | 87 (100.0%) | 0 (0.0%) |
| Material Moving | 129 (85.4%) | 22 (14.6%) |
| Total (Category) | 388 (94.6%) | 22 (5.4%) |
| Total (Overall) | 1,421 (47.8%) | 1,553 (52.2%) |
Employment Industries by Sex in Gridley
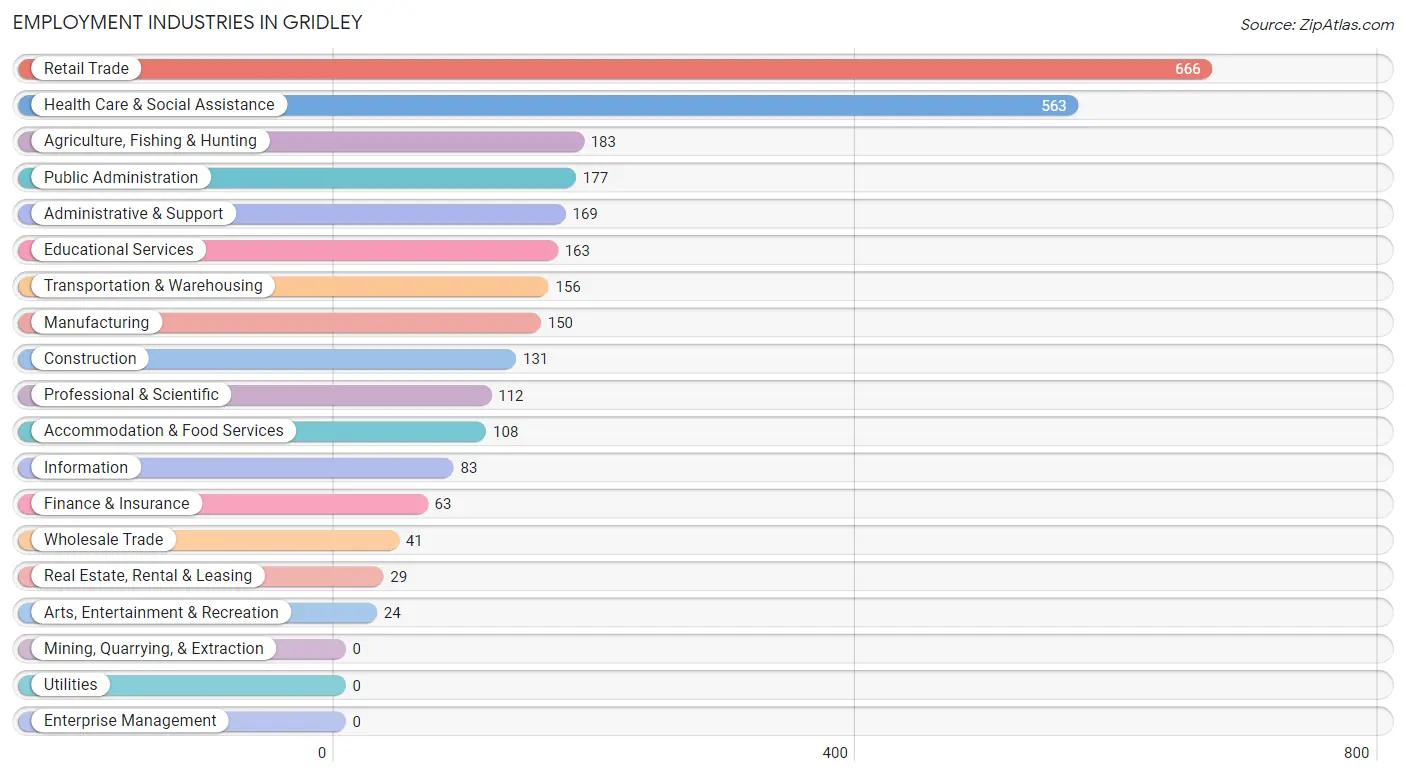
Employment Industries in Gridley
The major employment industries in Gridley include Retail Trade (666 | 22.4%), Health Care & Social Assistance (563 | 18.9%), Agriculture, Fishing & Hunting (183 | 6.1%), Public Administration (177 | 5.9%), and Administrative & Support (169 | 5.7%).
Employment Industries by Sex in Gridley
The Gridley industries that see more men than women are Transportation & Warehousing (100.0%), Real Estate, Rental & Leasing (100.0%), and Construction (90.1%), whereas the industries that tend to have a higher number of women are Arts, Entertainment & Recreation (100.0%), Health Care & Social Assistance (98.6%), and Finance & Insurance (80.9%).
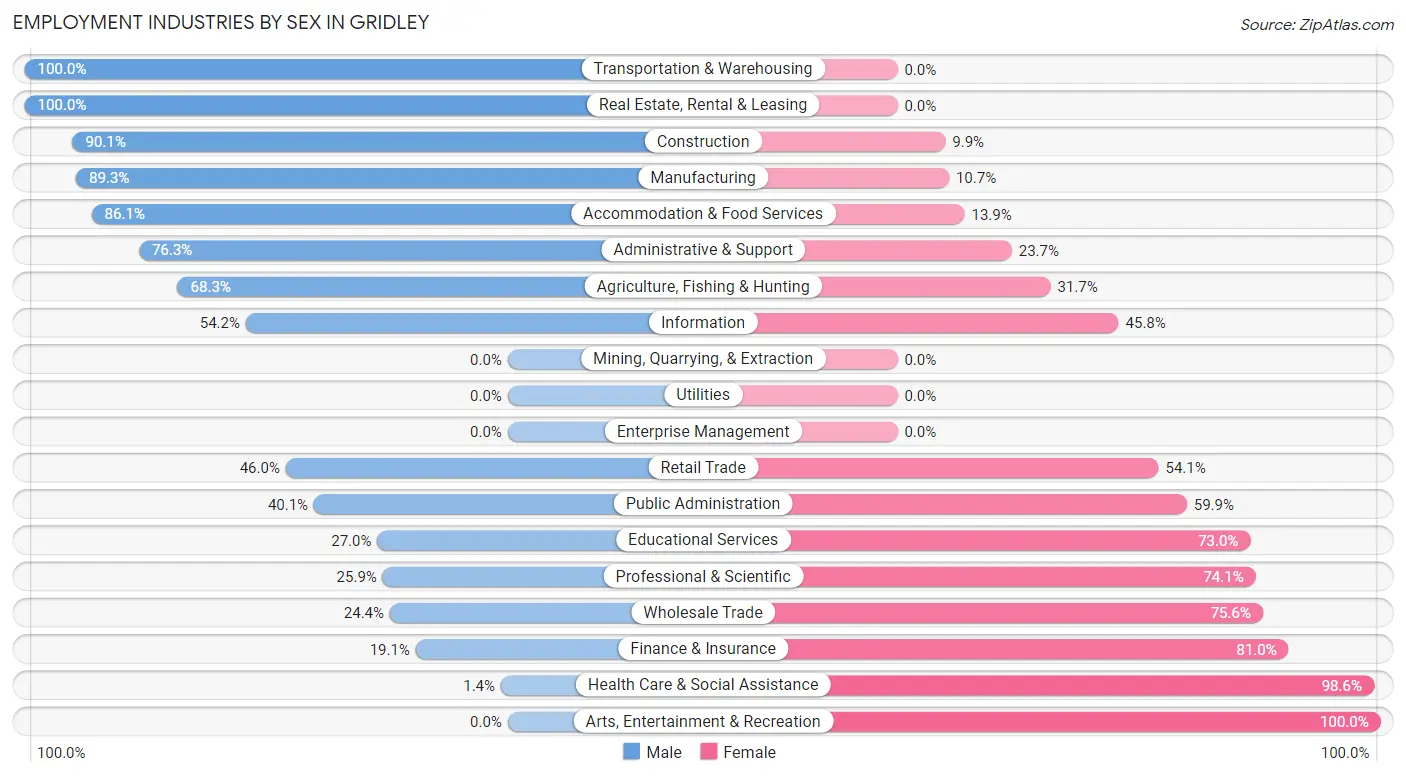
| Industry | Male | Female |
| Agriculture, Fishing & Hunting | 125 (68.3%) | 58 (31.7%) |
| Mining, Quarrying, & Extraction | 0 (0.0%) | 0 (0.0%) |
| Construction | 118 (90.1%) | 13 (9.9%) |
| Manufacturing | 134 (89.3%) | 16 (10.7%) |
| Wholesale Trade | 10 (24.4%) | 31 (75.6%) |
| Retail Trade | 306 (46.0%) | 360 (54.0%) |
| Transportation & Warehousing | 156 (100.0%) | 0 (0.0%) |
| Utilities | 0 (0.0%) | 0 (0.0%) |
| Information | 45 (54.2%) | 38 (45.8%) |
| Finance & Insurance | 12 (19.1%) | 51 (80.9%) |
| Real Estate, Rental & Leasing | 29 (100.0%) | 0 (0.0%) |
| Professional & Scientific | 29 (25.9%) | 83 (74.1%) |
| Enterprise Management | 0 (0.0%) | 0 (0.0%) |
| Administrative & Support | 129 (76.3%) | 40 (23.7%) |
| Educational Services | 44 (27.0%) | 119 (73.0%) |
| Health Care & Social Assistance | 8 (1.4%) | 555 (98.6%) |
| Arts, Entertainment & Recreation | 0 (0.0%) | 24 (100.0%) |
| Accommodation & Food Services | 93 (86.1%) | 15 (13.9%) |
| Public Administration | 71 (40.1%) | 106 (59.9%) |
| Total | 1,421 (47.8%) | 1,553 (52.2%) |
Education in Gridley
School Enrollment in Gridley
The most common levels of schooling among the 2,241 students in Gridley are elementary school (773 | 34.5%), middle school (484 | 21.6%), and high school (460 | 20.5%).
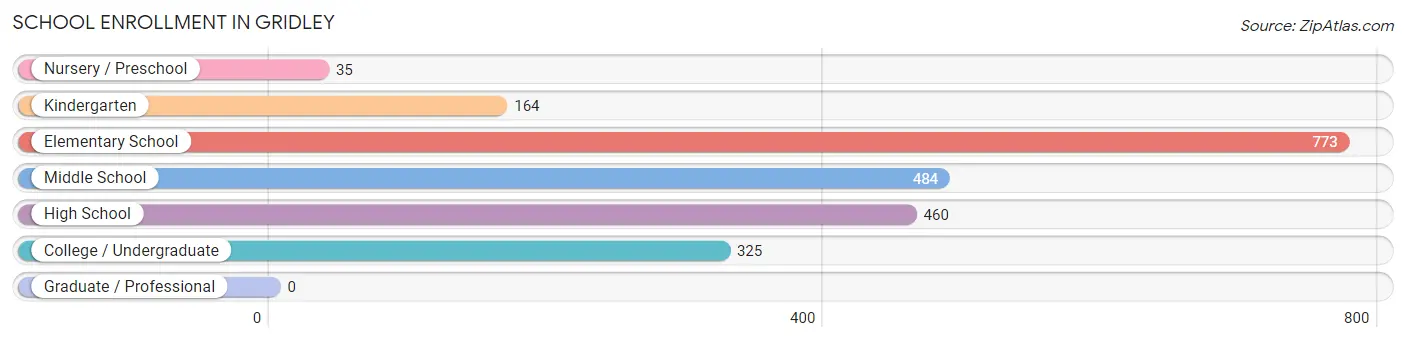
| School Level | # Students | % Students |
| Nursery / Preschool | 35 | 1.6% |
| Kindergarten | 164 | 7.3% |
| Elementary School | 773 | 34.5% |
| Middle School | 484 | 21.6% |
| High School | 460 | 20.5% |
| College / Undergraduate | 325 | 14.5% |
| Graduate / Professional | 0 | 0.0% |
| Total | 2,241 | 100.0% |
School Enrollment by Age by Funding Source in Gridley
Out of a total of 2,241 students who are enrolled in schools in Gridley, 96 (4.3%) attend a private institution, while the remaining 2,145 (95.7%) are enrolled in public schools. The age group of 20 to 24 year olds has the highest likelihood of being enrolled in private schools, with 24 (12.6% in the age bracket) enrolled. Conversely, the age group of 3 to 4 year olds has the lowest likelihood of being enrolled in a private school, with 19 (100.0% in the age bracket) attending a public institution.
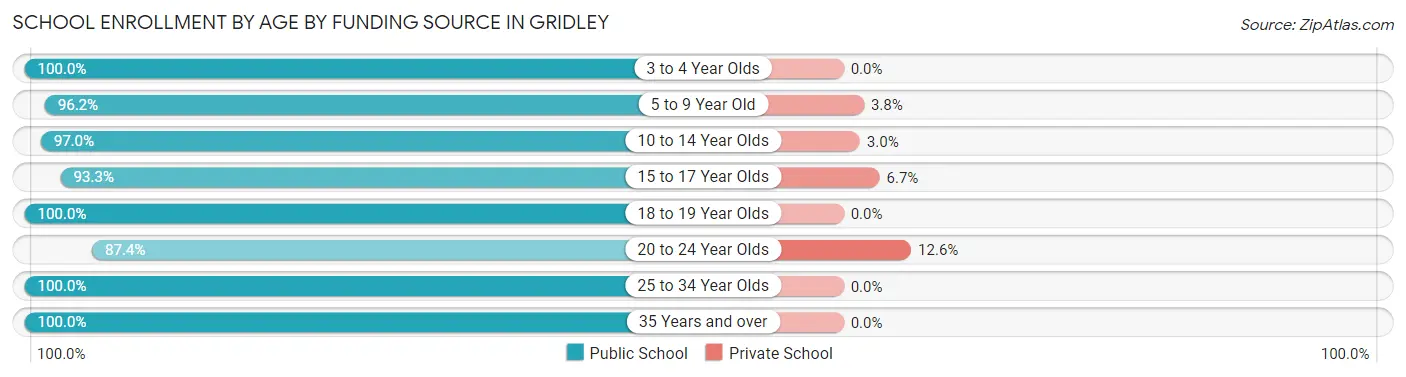
| Age Bracket | Public School | Private School |
| 3 to 4 Year Olds | 19 (100.0%) | 0 (0.0%) |
| 5 to 9 Year Old | 892 (96.2%) | 35 (3.8%) |
| 10 to 14 Year Olds | 579 (97.0%) | 18 (3.0%) |
| 15 to 17 Year Olds | 265 (93.3%) | 19 (6.7%) |
| 18 to 19 Year Olds | 152 (100.0%) | 0 (0.0%) |
| 20 to 24 Year Olds | 167 (87.4%) | 24 (12.6%) |
| 25 to 34 Year Olds | 13 (100.0%) | 0 (0.0%) |
| 35 Years and over | 58 (100.0%) | 0 (0.0%) |
| Total | 2,145 (95.7%) | 96 (4.3%) |
Educational Attainment by Field of Study in Gridley
Bio, nature & agricultural (78 | 13.2%), science & technology (77 | 13.1%), arts & humanities (73 | 12.4%), business (69 | 11.7%), and education (64 | 10.9%) are the most common fields of study among 589 individuals in Gridley who have obtained a bachelor's degree or higher.
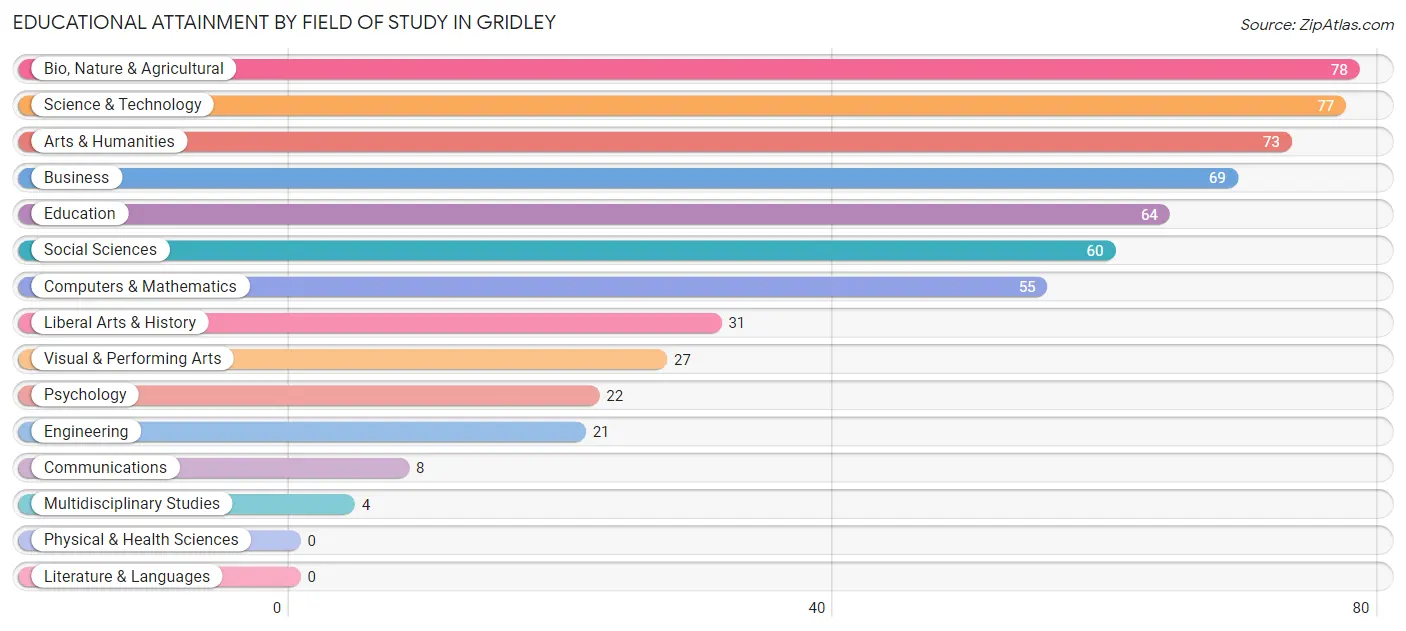
| Field of Study | # Graduates | % Graduates |
| Computers & Mathematics | 55 | 9.3% |
| Bio, Nature & Agricultural | 78 | 13.2% |
| Physical & Health Sciences | 0 | 0.0% |
| Psychology | 22 | 3.7% |
| Social Sciences | 60 | 10.2% |
| Engineering | 21 | 3.6% |
| Multidisciplinary Studies | 4 | 0.7% |
| Science & Technology | 77 | 13.1% |
| Business | 69 | 11.7% |
| Education | 64 | 10.9% |
| Literature & Languages | 0 | 0.0% |
| Liberal Arts & History | 31 | 5.3% |
| Visual & Performing Arts | 27 | 4.6% |
| Communications | 8 | 1.4% |
| Arts & Humanities | 73 | 12.4% |
| Total | 589 | 100.0% |
Transportation & Commute in Gridley
Vehicle Availability by Sex in Gridley
The most prevalent vehicle ownership categories in Gridley are males with 2 vehicles (627, accounting for 45.4%) and females with 2 vehicles (516, making up 41.7%).
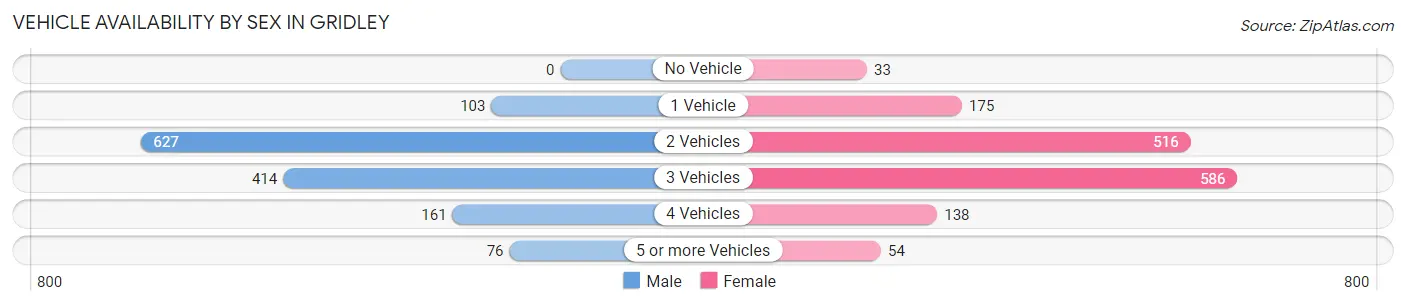
| Vehicles Available | Male | Female |
| No Vehicle | 0 (0.0%) | 33 (2.2%) |
| 1 Vehicle | 103 (7.5%) | 175 (11.7%) |
| 2 Vehicles | 627 (45.4%) | 516 (34.4%) |
| 3 Vehicles | 414 (30.0%) | 586 (39.0%) |
| 4 Vehicles | 161 (11.7%) | 138 (9.2%) |
| 5 or more Vehicles | 76 (5.5%) | 54 (3.6%) |
| Total | 1,381 (100.0%) | 1,502 (100.0%) |
Commute Time in Gridley
The most frequently occuring commute durations in Gridley are 5 to 9 minutes (604 commuters, 21.5%), 30 to 34 minutes (394 commuters, 14.0%), and 15 to 19 minutes (347 commuters, 12.3%).
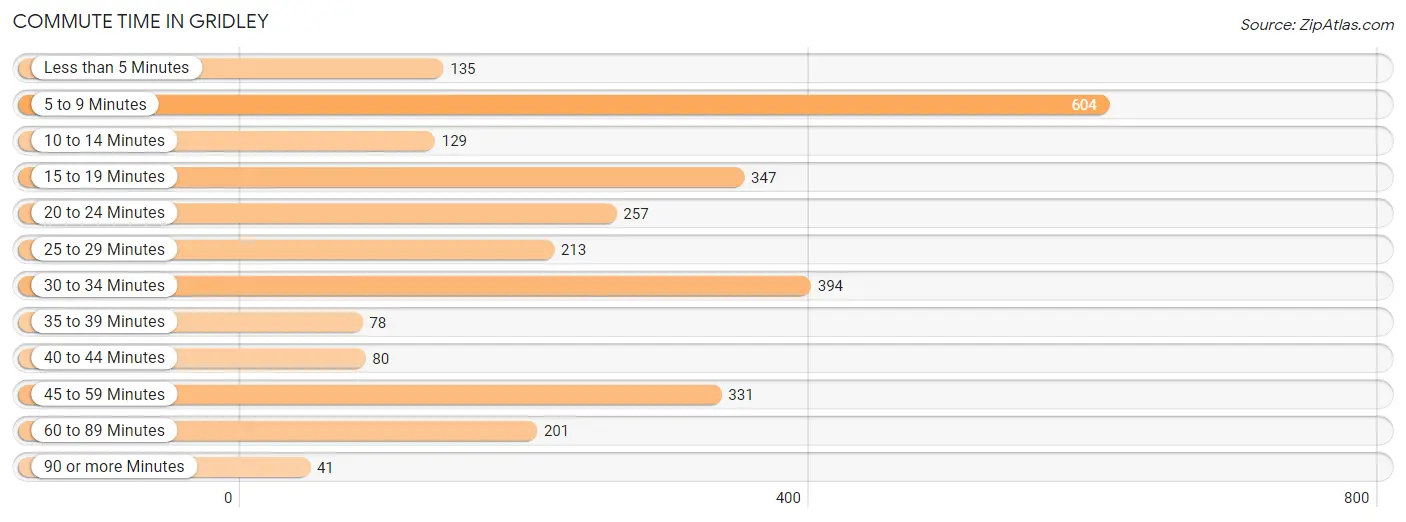
| Commute Time | # Commuters | % Commuters |
| Less than 5 Minutes | 135 | 4.8% |
| 5 to 9 Minutes | 604 | 21.5% |
| 10 to 14 Minutes | 129 | 4.6% |
| 15 to 19 Minutes | 347 | 12.3% |
| 20 to 24 Minutes | 257 | 9.1% |
| 25 to 29 Minutes | 213 | 7.6% |
| 30 to 34 Minutes | 394 | 14.0% |
| 35 to 39 Minutes | 78 | 2.8% |
| 40 to 44 Minutes | 80 | 2.9% |
| 45 to 59 Minutes | 331 | 11.8% |
| 60 to 89 Minutes | 201 | 7.1% |
| 90 or more Minutes | 41 | 1.5% |
Commute Time by Sex in Gridley
The most common commute times in Gridley are 5 to 9 minutes (288 commuters, 21.2%) for males and 5 to 9 minutes (316 commuters, 21.7%) for females.
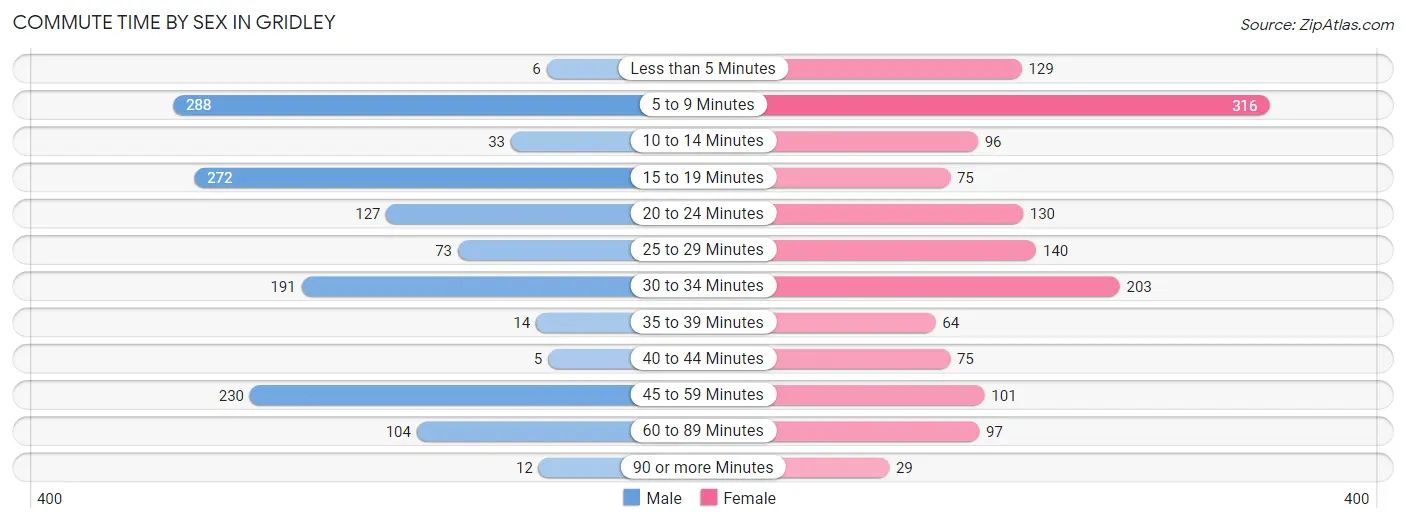
| Commute Time | Male | Female |
| Less than 5 Minutes | 6 (0.4%) | 129 (8.9%) |
| 5 to 9 Minutes | 288 (21.2%) | 316 (21.7%) |
| 10 to 14 Minutes | 33 (2.4%) | 96 (6.6%) |
| 15 to 19 Minutes | 272 (20.1%) | 75 (5.1%) |
| 20 to 24 Minutes | 127 (9.4%) | 130 (8.9%) |
| 25 to 29 Minutes | 73 (5.4%) | 140 (9.6%) |
| 30 to 34 Minutes | 191 (14.1%) | 203 (14.0%) |
| 35 to 39 Minutes | 14 (1.0%) | 64 (4.4%) |
| 40 to 44 Minutes | 5 (0.4%) | 75 (5.1%) |
| 45 to 59 Minutes | 230 (17.0%) | 101 (6.9%) |
| 60 to 89 Minutes | 104 (7.7%) | 97 (6.7%) |
| 90 or more Minutes | 12 (0.9%) | 29 (2.0%) |
Time of Departure to Work by Sex in Gridley
The most frequent times of departure to work in Gridley are 6:30 AM to 6:59 AM (256, 18.9%) for males and 7:00 AM to 7:29 AM (326, 22.4%) for females.
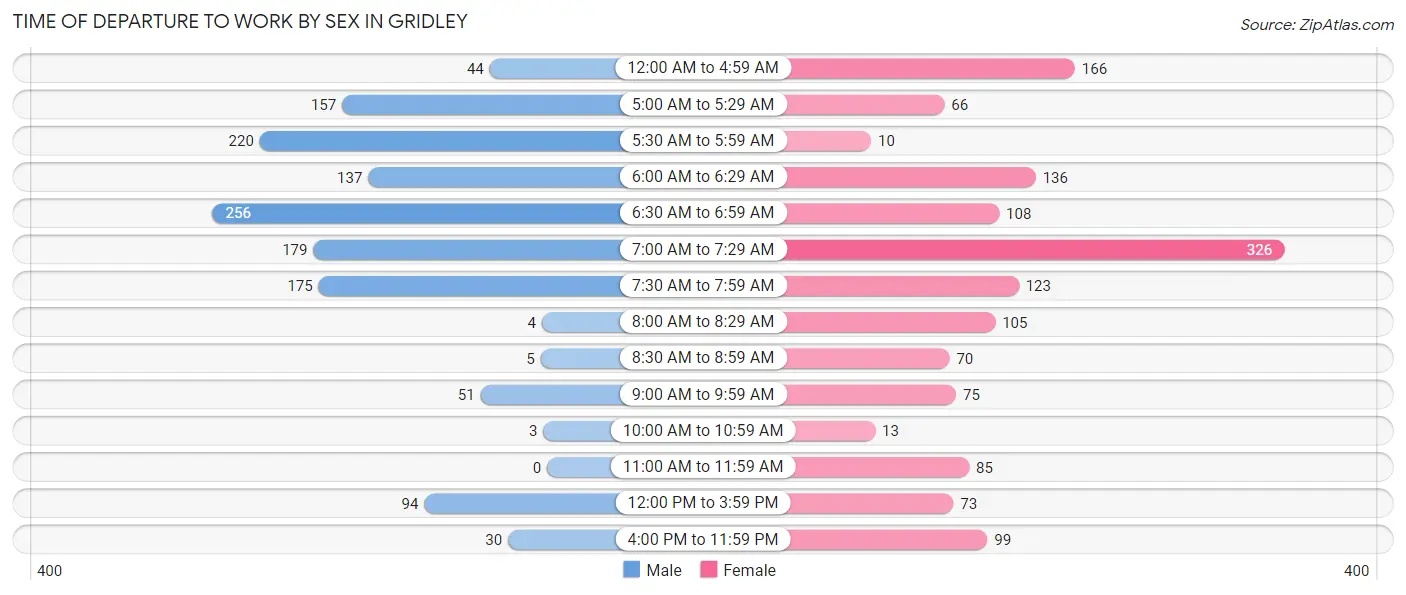
| Time of Departure | Male | Female |
| 12:00 AM to 4:59 AM | 44 (3.3%) | 166 (11.4%) |
| 5:00 AM to 5:29 AM | 157 (11.6%) | 66 (4.5%) |
| 5:30 AM to 5:59 AM | 220 (16.2%) | 10 (0.7%) |
| 6:00 AM to 6:29 AM | 137 (10.1%) | 136 (9.3%) |
| 6:30 AM to 6:59 AM | 256 (18.9%) | 108 (7.4%) |
| 7:00 AM to 7:29 AM | 179 (13.2%) | 326 (22.4%) |
| 7:30 AM to 7:59 AM | 175 (12.9%) | 123 (8.5%) |
| 8:00 AM to 8:29 AM | 4 (0.3%) | 105 (7.2%) |
| 8:30 AM to 8:59 AM | 5 (0.4%) | 70 (4.8%) |
| 9:00 AM to 9:59 AM | 51 (3.8%) | 75 (5.1%) |
| 10:00 AM to 10:59 AM | 3 (0.2%) | 13 (0.9%) |
| 11:00 AM to 11:59 AM | 0 (0.0%) | 85 (5.8%) |
| 12:00 PM to 3:59 PM | 94 (6.9%) | 73 (5.0%) |
| 4:00 PM to 11:59 PM | 30 (2.2%) | 99 (6.8%) |
| Total | 1,355 (100.0%) | 1,455 (100.0%) |
Housing Occupancy in Gridley
Occupancy by Ownership in Gridley
Of the total 2,401 dwellings in Gridley, owner-occupied units account for 1,126 (46.9%), while renter-occupied units make up 1,275 (53.1%).
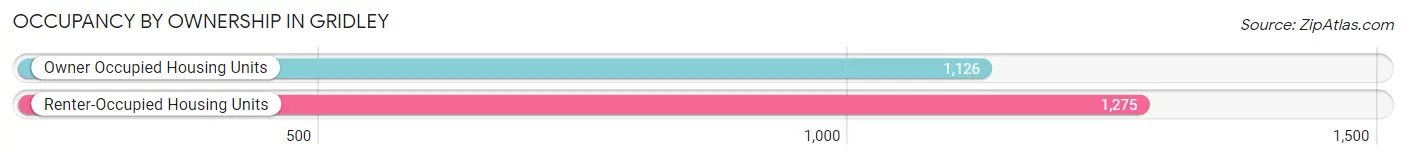
| Occupancy | # Housing Units | % Housing Units |
| Owner Occupied Housing Units | 1,126 | 46.9% |
| Renter-Occupied Housing Units | 1,275 | 53.1% |
| Total Occupied Housing Units | 2,401 | 100.0% |
Occupancy by Household Size in Gridley
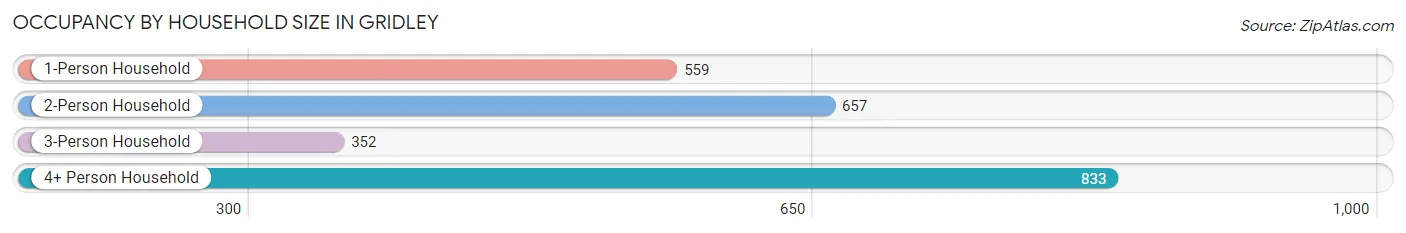
| Household Size | # Housing Units | % Housing Units |
| 1-Person Household | 559 | 23.3% |
| 2-Person Household | 657 | 27.4% |
| 3-Person Household | 352 | 14.7% |
| 4+ Person Household | 833 | 34.7% |
| Total Housing Units | 2,401 | 100.0% |
Occupancy by Ownership by Household Size in Gridley
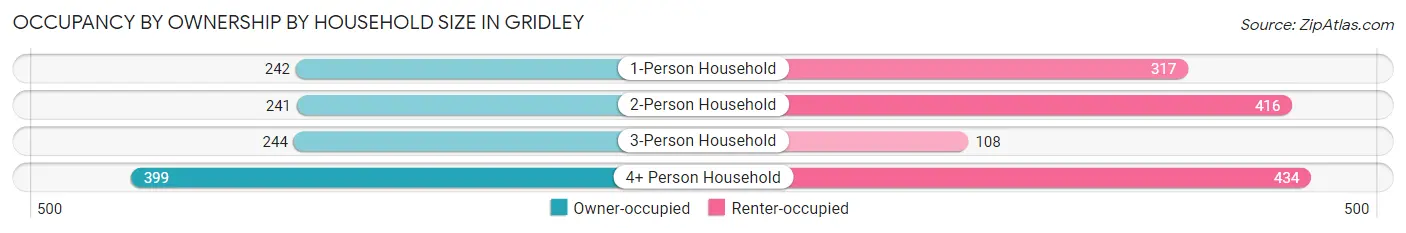
| Household Size | Owner-occupied | Renter-occupied |
| 1-Person Household | 242 (43.3%) | 317 (56.7%) |
| 2-Person Household | 241 (36.7%) | 416 (63.3%) |
| 3-Person Household | 244 (69.3%) | 108 (30.7%) |
| 4+ Person Household | 399 (47.9%) | 434 (52.1%) |
| Total Housing Units | 1,126 (46.9%) | 1,275 (53.1%) |
Occupancy by Educational Attainment in Gridley
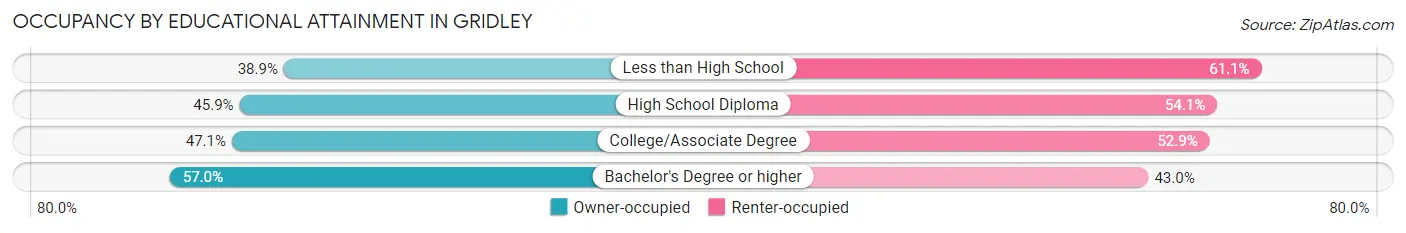
| Household Size | Owner-occupied | Renter-occupied |
| Less than High School | 149 (38.9%) | 234 (61.1%) |
| High School Diploma | 254 (45.9%) | 299 (54.1%) |
| College/Associate Degree | 535 (47.1%) | 600 (52.9%) |
| Bachelor's Degree or higher | 188 (57.0%) | 142 (43.0%) |
Occupancy by Age of Householder in Gridley
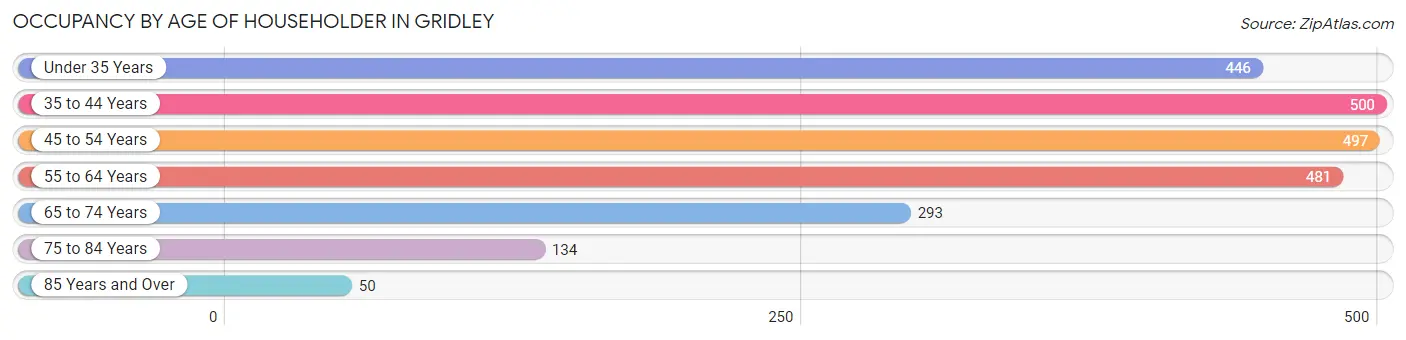
| Age Bracket | # Households | % Households |
| Under 35 Years | 446 | 18.6% |
| 35 to 44 Years | 500 | 20.8% |
| 45 to 54 Years | 497 | 20.7% |
| 55 to 64 Years | 481 | 20.0% |
| 65 to 74 Years | 293 | 12.2% |
| 75 to 84 Years | 134 | 5.6% |
| 85 Years and Over | 50 | 2.1% |
| Total | 2,401 | 100.0% |
Housing Finances in Gridley
Median Income by Occupancy in Gridley
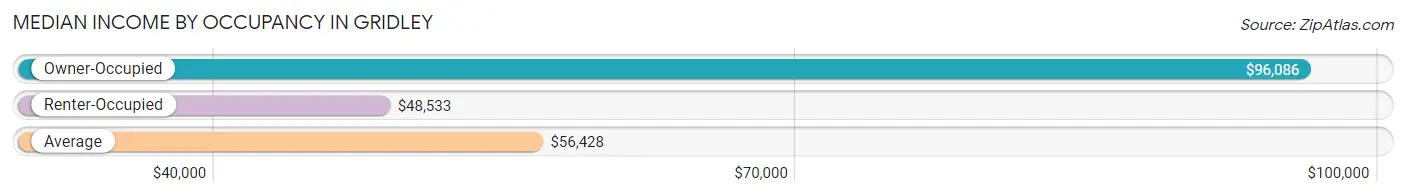
| Occupancy Type | # Households | Median Income |
| Owner-Occupied | 1,126 (46.9%) | $96,086 |
| Renter-Occupied | 1,275 (53.1%) | $48,533 |
| Average | 2,401 (100.0%) | $56,428 |
Occupancy by Householder Income Bracket in Gridley
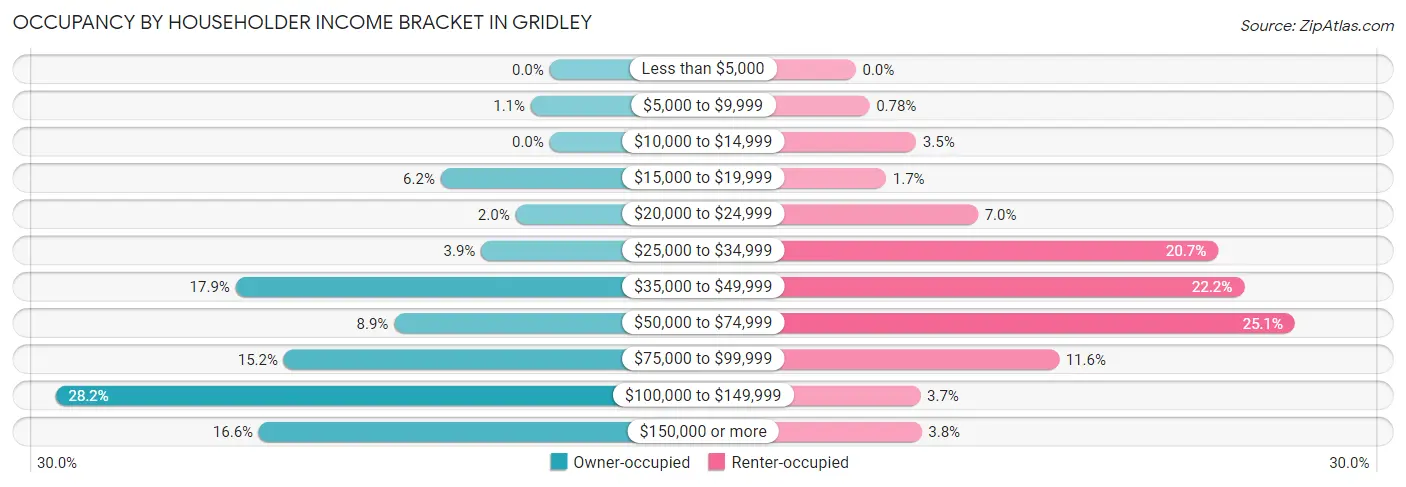
| Income Bracket | Owner-occupied | Renter-occupied |
| Less than $5,000 | 0 (0.0%) | 0 (0.0%) |
| $5,000 to $9,999 | 12 (1.1%) | 10 (0.8%) |
| $10,000 to $14,999 | 0 (0.0%) | 44 (3.5%) |
| $15,000 to $19,999 | 70 (6.2%) | 22 (1.7%) |
| $20,000 to $24,999 | 22 (1.9%) | 89 (7.0%) |
| $25,000 to $34,999 | 44 (3.9%) | 264 (20.7%) |
| $35,000 to $49,999 | 202 (17.9%) | 283 (22.2%) |
| $50,000 to $74,999 | 100 (8.9%) | 320 (25.1%) |
| $75,000 to $99,999 | 171 (15.2%) | 148 (11.6%) |
| $100,000 to $149,999 | 318 (28.2%) | 47 (3.7%) |
| $150,000 or more | 187 (16.6%) | 48 (3.8%) |
| Total | 1,126 (100.0%) | 1,275 (100.0%) |
Monthly Housing Cost Tiers in Gridley
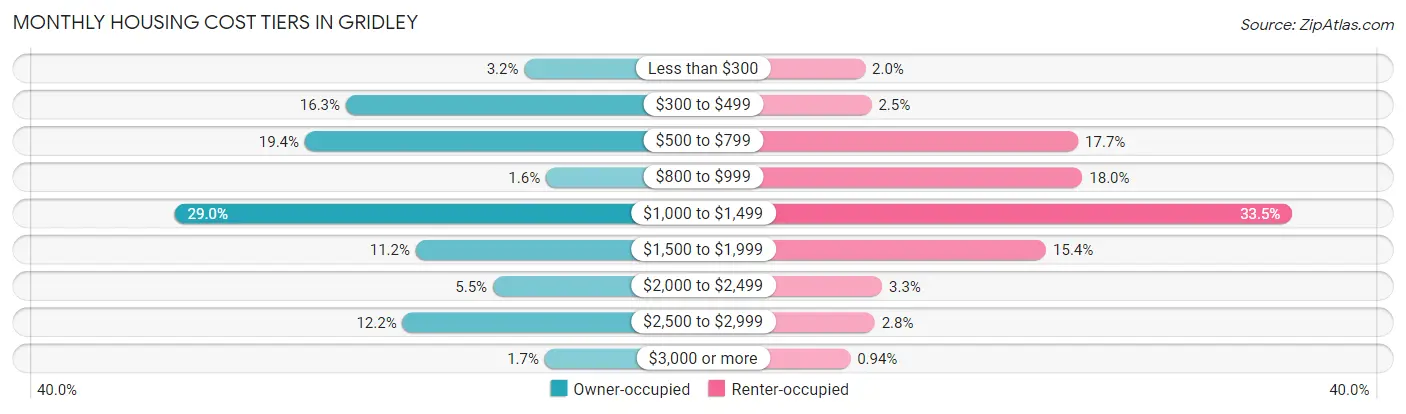
| Monthly Cost | Owner-occupied | Renter-occupied |
| Less than $300 | 36 (3.2%) | 26 (2.0%) |
| $300 to $499 | 184 (16.3%) | 32 (2.5%) |
| $500 to $799 | 218 (19.4%) | 226 (17.7%) |
| $800 to $999 | 18 (1.6%) | 230 (18.0%) |
| $1,000 to $1,499 | 326 (28.9%) | 427 (33.5%) |
| $1,500 to $1,999 | 126 (11.2%) | 196 (15.4%) |
| $2,000 to $2,499 | 62 (5.5%) | 42 (3.3%) |
| $2,500 to $2,999 | 137 (12.2%) | 35 (2.8%) |
| $3,000 or more | 19 (1.7%) | 12 (0.9%) |
| Total | 1,126 (100.0%) | 1,275 (100.0%) |
Physical Housing Characteristics in Gridley
Housing Structures in Gridley
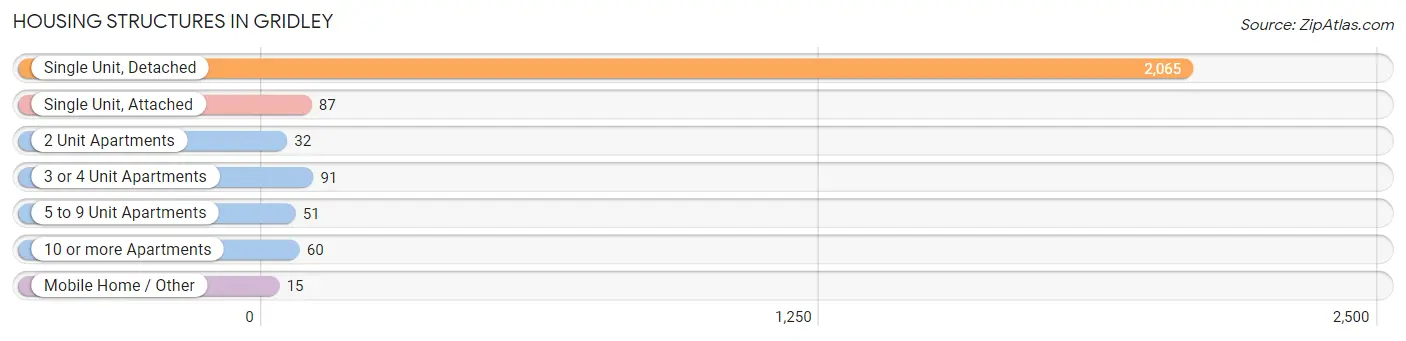
| Structure Type | # Housing Units | % Housing Units |
| Single Unit, Detached | 2,065 | 86.0% |
| Single Unit, Attached | 87 | 3.6% |
| 2 Unit Apartments | 32 | 1.3% |
| 3 or 4 Unit Apartments | 91 | 3.8% |
| 5 to 9 Unit Apartments | 51 | 2.1% |
| 10 or more Apartments | 60 | 2.5% |
| Mobile Home / Other | 15 | 0.6% |
| Total | 2,401 | 100.0% |
Housing Structures by Occupancy in Gridley
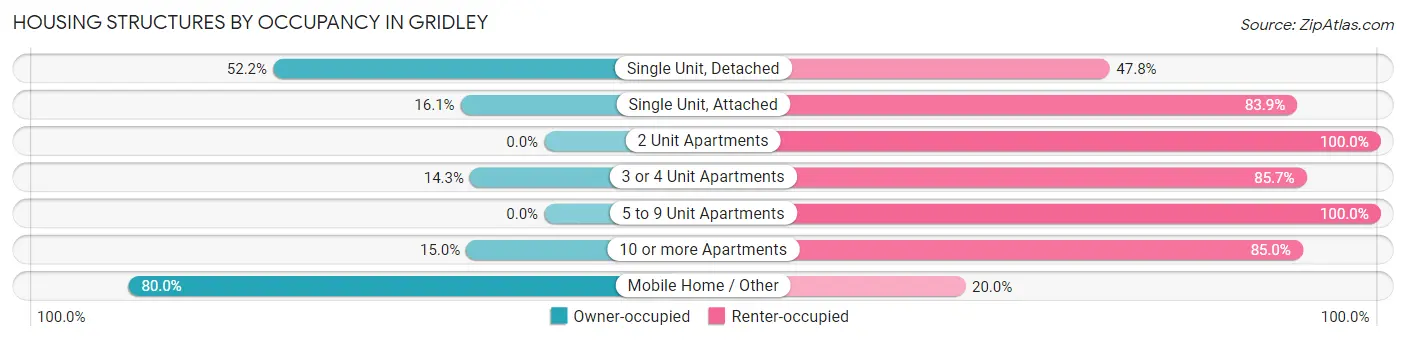
| Structure Type | Owner-occupied | Renter-occupied |
| Single Unit, Detached | 1,078 (52.2%) | 987 (47.8%) |
| Single Unit, Attached | 14 (16.1%) | 73 (83.9%) |
| 2 Unit Apartments | 0 (0.0%) | 32 (100.0%) |
| 3 or 4 Unit Apartments | 13 (14.3%) | 78 (85.7%) |
| 5 to 9 Unit Apartments | 0 (0.0%) | 51 (100.0%) |
| 10 or more Apartments | 9 (15.0%) | 51 (85.0%) |
| Mobile Home / Other | 12 (80.0%) | 3 (20.0%) |
| Total | 1,126 (46.9%) | 1,275 (53.1%) |
Housing Structures by Number of Rooms in Gridley
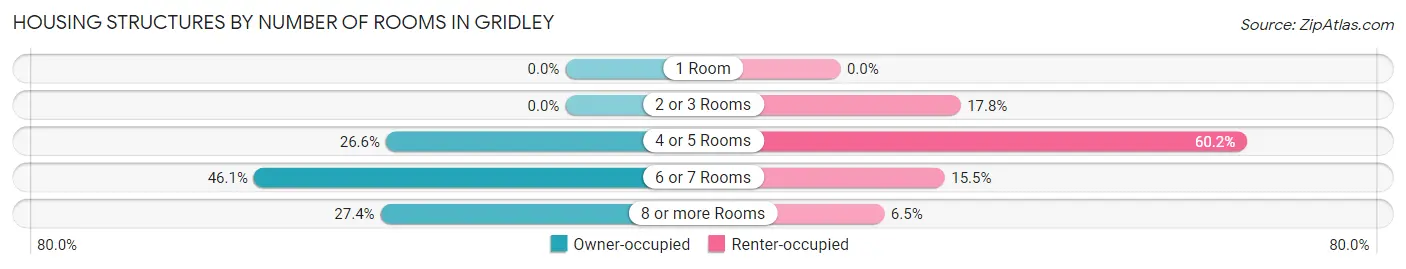
| Number of Rooms | Owner-occupied | Renter-occupied |
| 1 Room | 0 (0.0%) | 0 (0.0%) |
| 2 or 3 Rooms | 0 (0.0%) | 227 (17.8%) |
| 4 or 5 Rooms | 299 (26.6%) | 768 (60.2%) |
| 6 or 7 Rooms | 519 (46.1%) | 197 (15.4%) |
| 8 or more Rooms | 308 (27.4%) | 83 (6.5%) |
| Total | 1,126 (100.0%) | 1,275 (100.0%) |
Housing Structure by Heating Type in Gridley
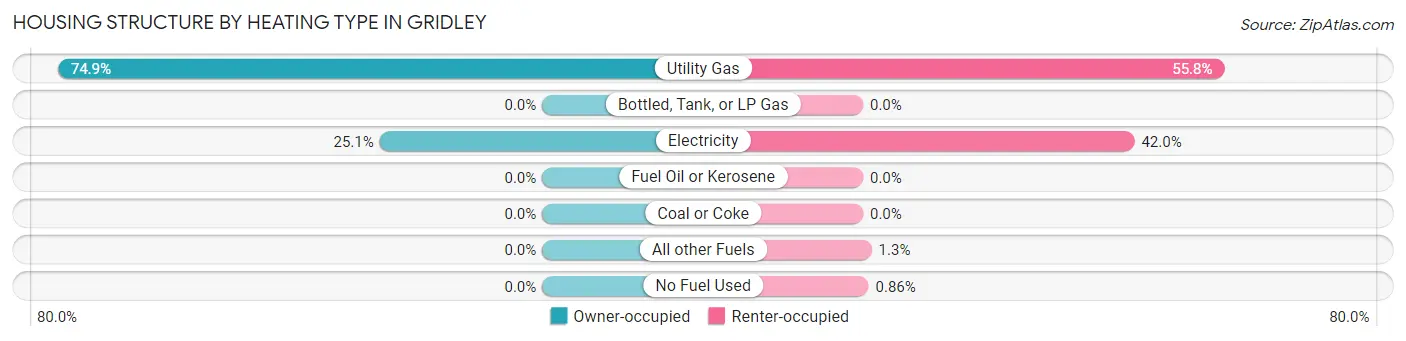
| Heating Type | Owner-occupied | Renter-occupied |
| Utility Gas | 843 (74.9%) | 712 (55.8%) |
| Bottled, Tank, or LP Gas | 0 (0.0%) | 0 (0.0%) |
| Electricity | 283 (25.1%) | 535 (42.0%) |
| Fuel Oil or Kerosene | 0 (0.0%) | 0 (0.0%) |
| Coal or Coke | 0 (0.0%) | 0 (0.0%) |
| All other Fuels | 0 (0.0%) | 17 (1.3%) |
| No Fuel Used | 0 (0.0%) | 11 (0.9%) |
| Total | 1,126 (100.0%) | 1,275 (100.0%) |
Household Vehicle Usage in Gridley
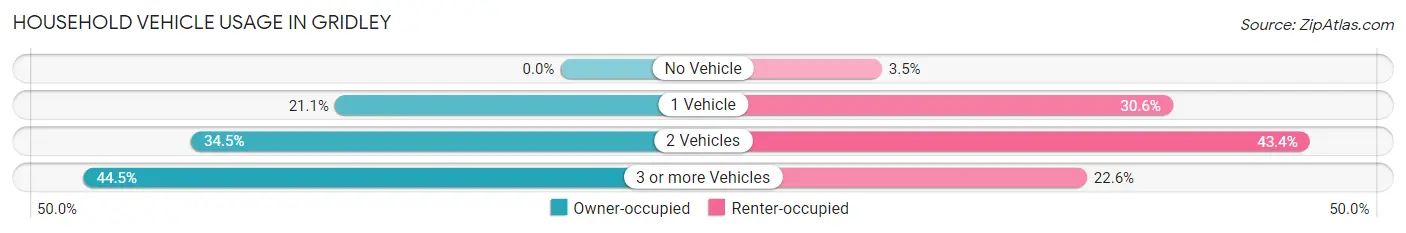
| Vehicles per Household | Owner-occupied | Renter-occupied |
| No Vehicle | 0 (0.0%) | 44 (3.5%) |
| 1 Vehicle | 237 (21.0%) | 390 (30.6%) |
| 2 Vehicles | 388 (34.5%) | 553 (43.4%) |
| 3 or more Vehicles | 501 (44.5%) | 288 (22.6%) |
| Total | 1,126 (100.0%) | 1,275 (100.0%) |
Real Estate & Mortgages in Gridley
Real Estate and Mortgage Overview in Gridley
| Characteristic | Without Mortgage | With Mortgage |
| Housing Units | 360 | 766 |
| Median Property Value | $255,400 | $292,700 |
| Median Household Income | $76,250 | $124 |
| Monthly Housing Costs | $483 | $19 |
| Real Estate Taxes | $1,775 | $9 |
Property Value by Mortgage Status in Gridley
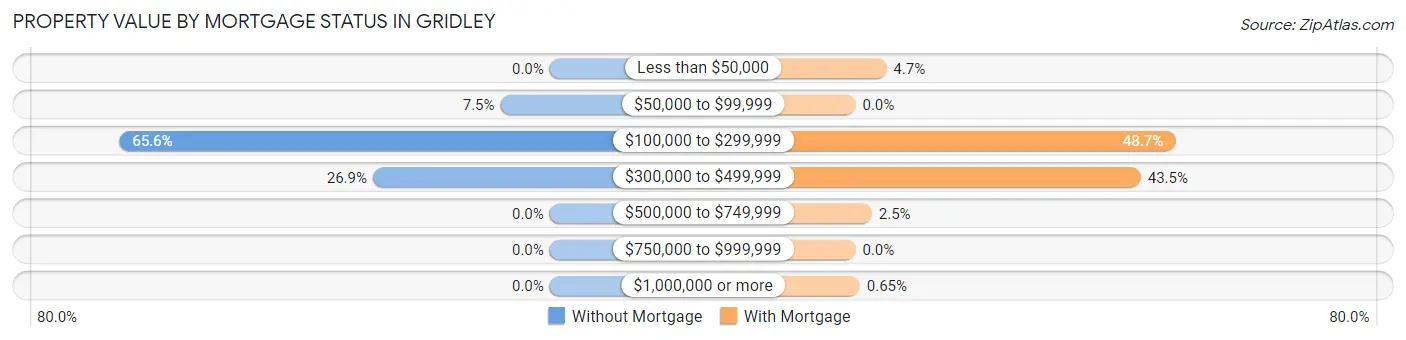
| Property Value | Without Mortgage | With Mortgage |
| Less than $50,000 | 0 (0.0%) | 36 (4.7%) |
| $50,000 to $99,999 | 27 (7.5%) | 0 (0.0%) |
| $100,000 to $299,999 | 236 (65.6%) | 373 (48.7%) |
| $300,000 to $499,999 | 97 (26.9%) | 333 (43.5%) |
| $500,000 to $749,999 | 0 (0.0%) | 19 (2.5%) |
| $750,000 to $999,999 | 0 (0.0%) | 0 (0.0%) |
| $1,000,000 or more | 0 (0.0%) | 5 (0.6%) |
| Total | 360 (100.0%) | 766 (100.0%) |
Household Income by Mortgage Status in Gridley
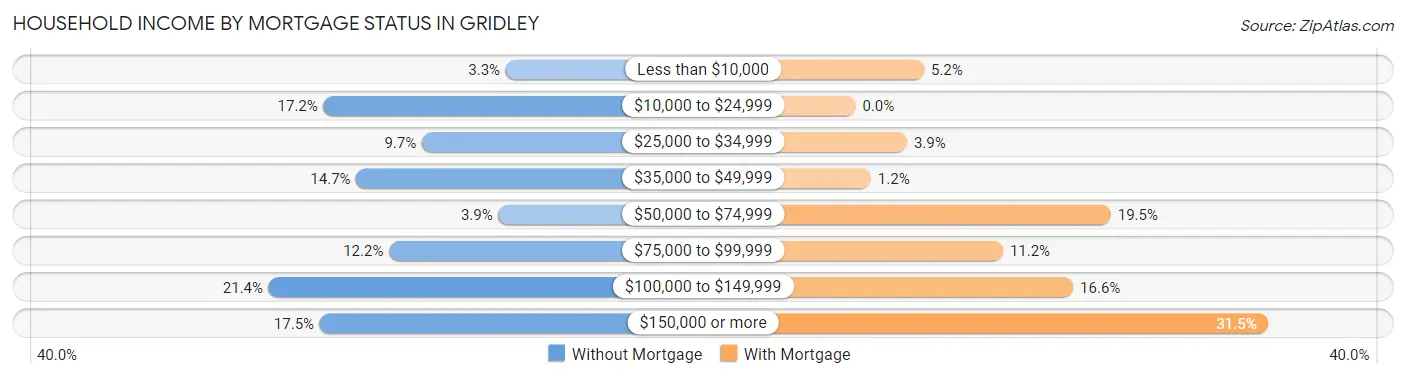
| Household Income | Without Mortgage | With Mortgage |
| Less than $10,000 | 12 (3.3%) | 40 (5.2%) |
| $10,000 to $24,999 | 62 (17.2%) | 0 (0.0%) |
| $25,000 to $34,999 | 35 (9.7%) | 30 (3.9%) |
| $35,000 to $49,999 | 53 (14.7%) | 9 (1.2%) |
| $50,000 to $74,999 | 14 (3.9%) | 149 (19.5%) |
| $75,000 to $99,999 | 44 (12.2%) | 86 (11.2%) |
| $100,000 to $149,999 | 77 (21.4%) | 127 (16.6%) |
| $150,000 or more | 63 (17.5%) | 241 (31.5%) |
| Total | 360 (100.0%) | 766 (100.0%) |
Property Value to Household Income Ratio in Gridley
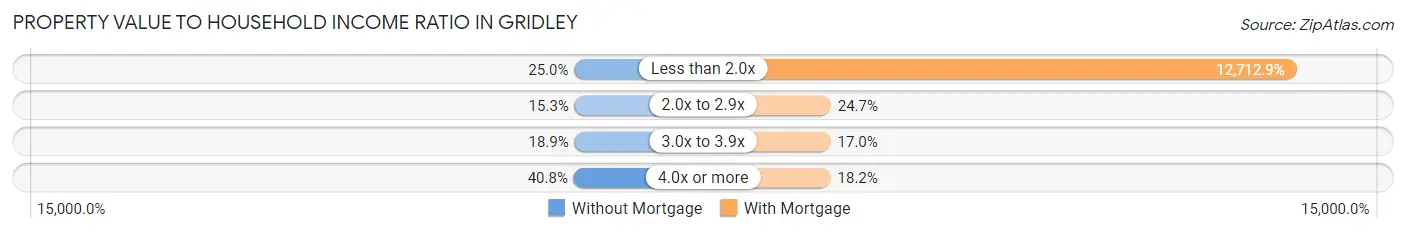
| Value-to-Income Ratio | Without Mortgage | With Mortgage |
| Less than 2.0x | 90 (25.0%) | 97,381 (12,712.9%) |
| 2.0x to 2.9x | 55 (15.3%) | 189 (24.7%) |
| 3.0x to 3.9x | 68 (18.9%) | 130 (17.0%) |
| 4.0x or more | 147 (40.8%) | 139 (18.1%) |
| Total | 360 (100.0%) | 766 (100.0%) |
Real Estate Taxes by Mortgage Status in Gridley
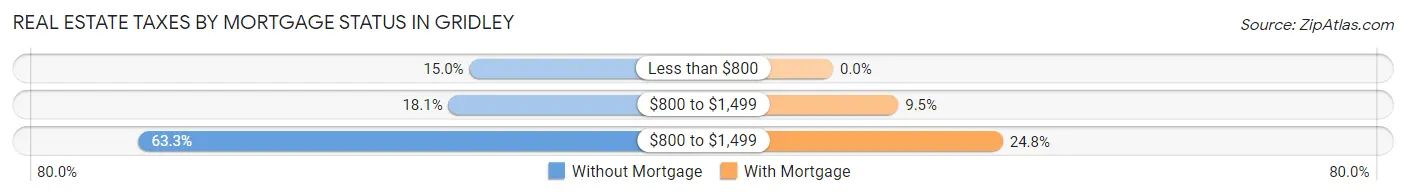
| Property Taxes | Without Mortgage | With Mortgage |
| Less than $800 | 54 (15.0%) | 0 (0.0%) |
| $800 to $1,499 | 65 (18.1%) | 73 (9.5%) |
| $800 to $1,499 | 228 (63.3%) | 190 (24.8%) |
| Total | 360 (100.0%) | 766 (100.0%) |
Health & Disability in Gridley
Health Insurance Coverage by Age in Gridley
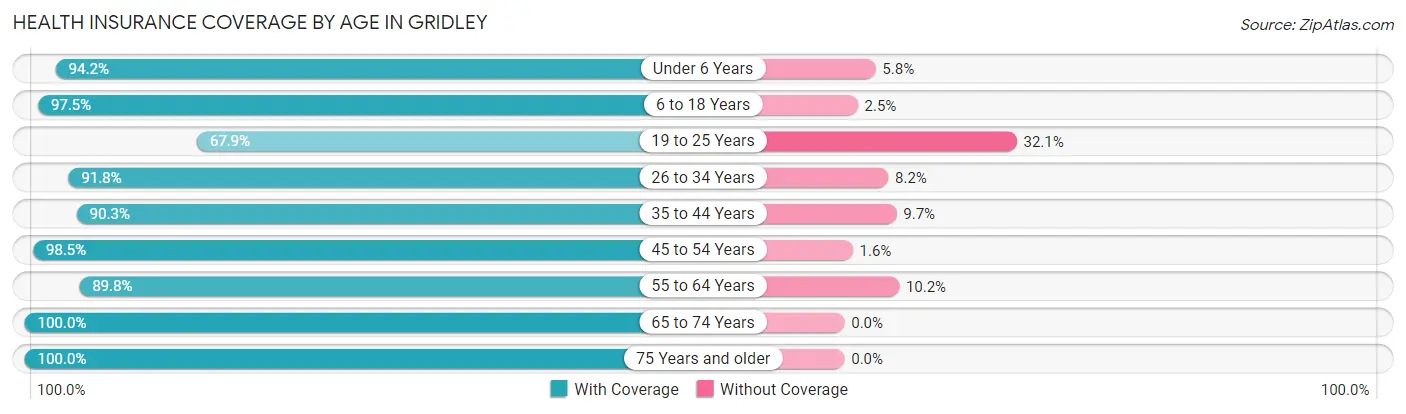
| Age Bracket | With Coverage | Without Coverage |
| Under 6 Years | 487 (94.2%) | 30 (5.8%) |
| 6 to 18 Years | 1,928 (97.5%) | 49 (2.5%) |
| 19 to 25 Years | 448 (67.9%) | 212 (32.1%) |
| 26 to 34 Years | 731 (91.8%) | 65 (8.2%) |
| 35 to 44 Years | 847 (90.3%) | 91 (9.7%) |
| 45 to 54 Years | 887 (98.5%) | 14 (1.5%) |
| 55 to 64 Years | 758 (89.8%) | 86 (10.2%) |
| 65 to 74 Years | 425 (100.0%) | 0 (0.0%) |
| 75 Years and older | 293 (100.0%) | 0 (0.0%) |
| Total | 6,804 (92.6%) | 547 (7.4%) |
Health Insurance Coverage by Citizenship Status in Gridley
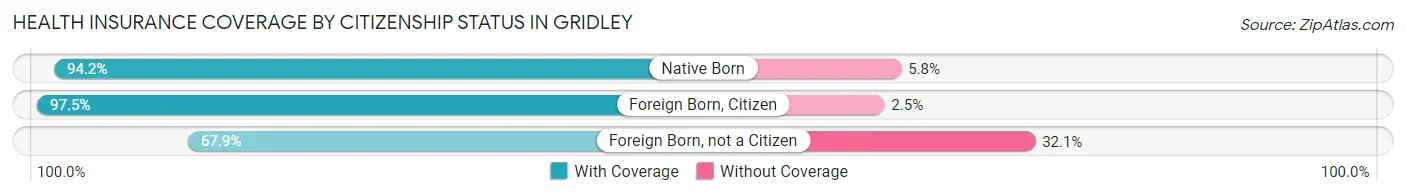
| Citizenship Status | With Coverage | Without Coverage |
| Native Born | 487 (94.2%) | 30 (5.8%) |
| Foreign Born, Citizen | 1,928 (97.5%) | 49 (2.5%) |
| Foreign Born, not a Citizen | 448 (67.9%) | 212 (32.1%) |
Health Insurance Coverage by Household Income in Gridley
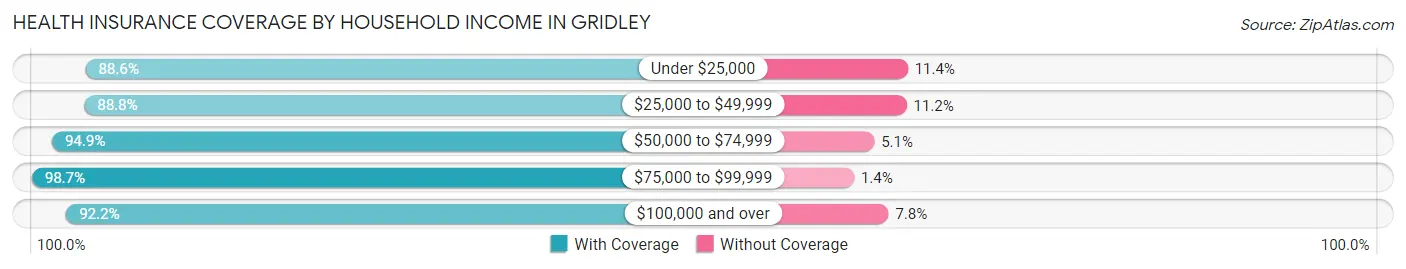
| Household Income | With Coverage | Without Coverage |
| Under $25,000 | 396 (88.6%) | 51 (11.4%) |
| $25,000 to $49,999 | 1,896 (88.8%) | 239 (11.2%) |
| $50,000 to $74,999 | 1,549 (94.9%) | 84 (5.1%) |
| $75,000 to $99,999 | 1,023 (98.7%) | 14 (1.3%) |
| $100,000 and over | 1,877 (92.2%) | 159 (7.8%) |
Public vs Private Health Insurance Coverage by Age in Gridley
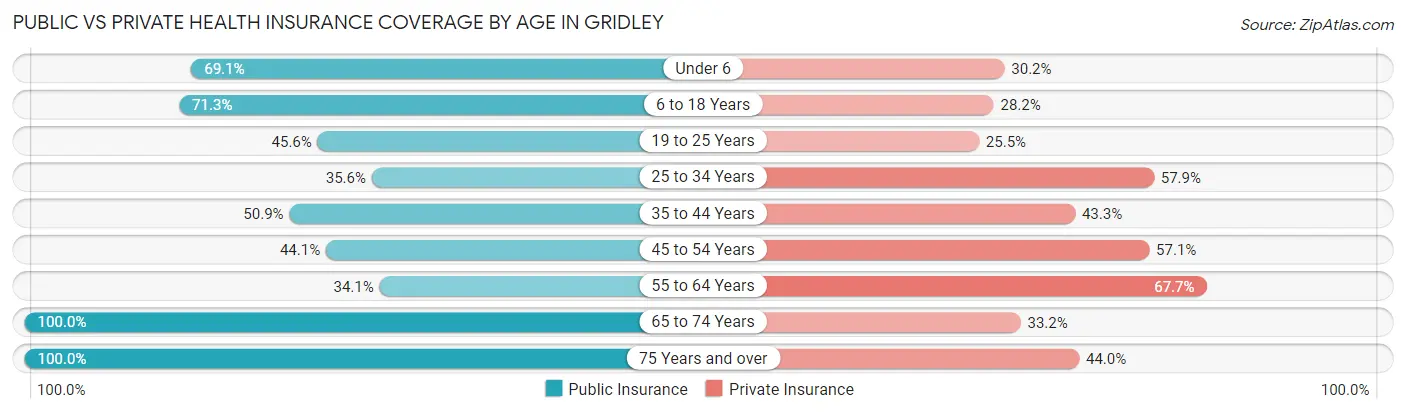
| Age Bracket | Public Insurance | Private Insurance |
| Under 6 | 357 (69.1%) | 156 (30.2%) |
| 6 to 18 Years | 1,410 (71.3%) | 557 (28.2%) |
| 19 to 25 Years | 301 (45.6%) | 168 (25.5%) |
| 25 to 34 Years | 283 (35.5%) | 461 (57.9%) |
| 35 to 44 Years | 477 (50.8%) | 406 (43.3%) |
| 45 to 54 Years | 397 (44.1%) | 514 (57.1%) |
| 55 to 64 Years | 288 (34.1%) | 571 (67.6%) |
| 65 to 74 Years | 425 (100.0%) | 141 (33.2%) |
| 75 Years and over | 293 (100.0%) | 129 (44.0%) |
| Total | 4,231 (57.6%) | 3,103 (42.2%) |
Disability Status by Sex by Age in Gridley
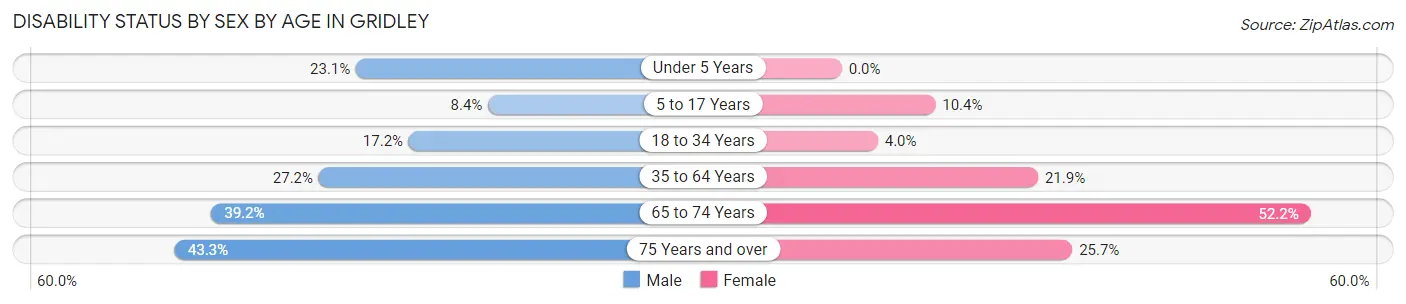
| Age Bracket | Male | Female |
| Under 5 Years | 45 (23.1%) | 0 (0.0%) |
| 5 to 17 Years | 87 (8.4%) | 82 (10.4%) |
| 18 to 34 Years | 118 (17.2%) | 38 (4.0%) |
| 35 to 64 Years | 348 (27.2%) | 307 (21.8%) |
| 65 to 74 Years | 78 (39.2%) | 118 (52.2%) |
| 75 Years and over | 61 (43.3%) | 39 (25.7%) |
Disability Class by Sex by Age in Gridley
Disability Class: Hearing Difficulty
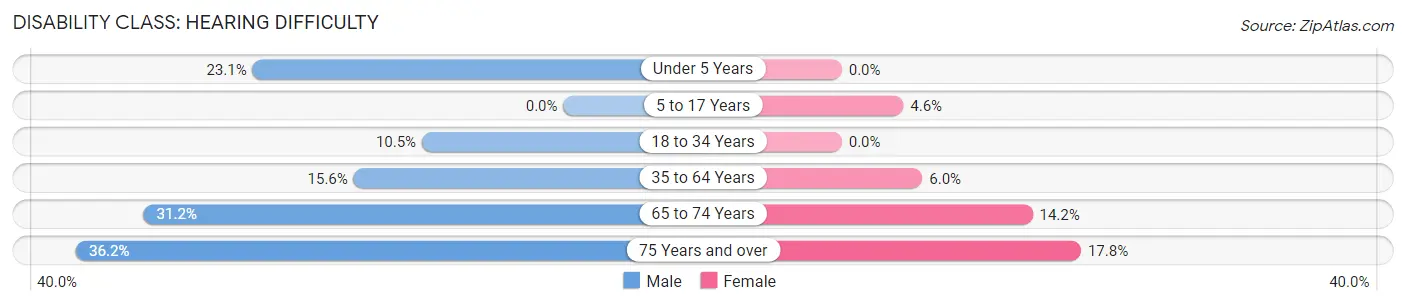
| Age Bracket | Male | Female |
| Under 5 Years | 45 (23.1%) | 0 (0.0%) |
| 5 to 17 Years | 0 (0.0%) | 36 (4.6%) |
| 18 to 34 Years | 72 (10.5%) | 0 (0.0%) |
| 35 to 64 Years | 199 (15.6%) | 84 (6.0%) |
| 65 to 74 Years | 62 (31.2%) | 32 (14.2%) |
| 75 Years and over | 51 (36.2%) | 27 (17.8%) |
Disability Class: Vision Difficulty
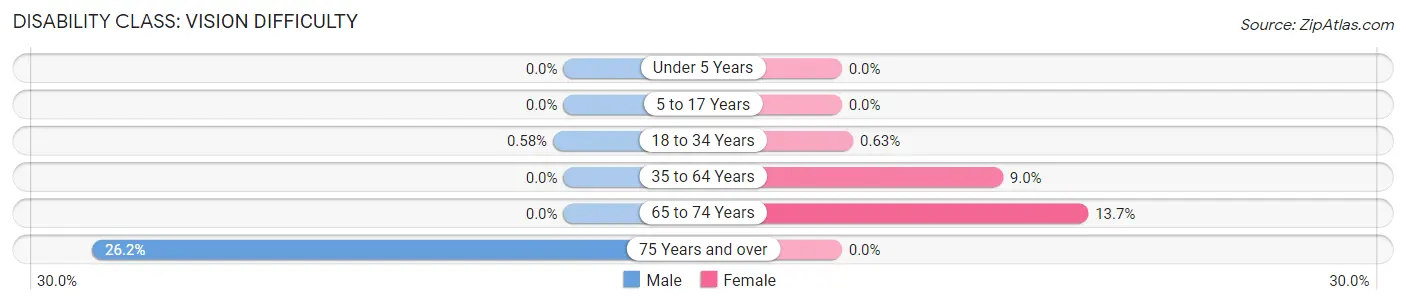
| Age Bracket | Male | Female |
| Under 5 Years | 0 (0.0%) | 0 (0.0%) |
| 5 to 17 Years | 0 (0.0%) | 0 (0.0%) |
| 18 to 34 Years | 4 (0.6%) | 6 (0.6%) |
| 35 to 64 Years | 0 (0.0%) | 126 (9.0%) |
| 65 to 74 Years | 0 (0.0%) | 31 (13.7%) |
| 75 Years and over | 37 (26.2%) | 0 (0.0%) |
Disability Class: Cognitive Difficulty
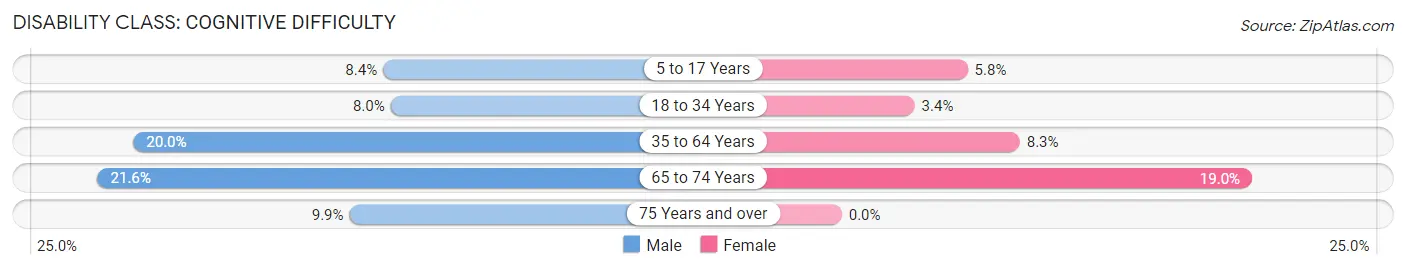
| Age Bracket | Male | Female |
| 5 to 17 Years | 87 (8.4%) | 46 (5.8%) |
| 18 to 34 Years | 55 (8.0%) | 32 (3.4%) |
| 35 to 64 Years | 255 (20.0%) | 116 (8.3%) |
| 65 to 74 Years | 43 (21.6%) | 43 (19.0%) |
| 75 Years and over | 14 (9.9%) | 0 (0.0%) |
Disability Class: Ambulatory Difficulty
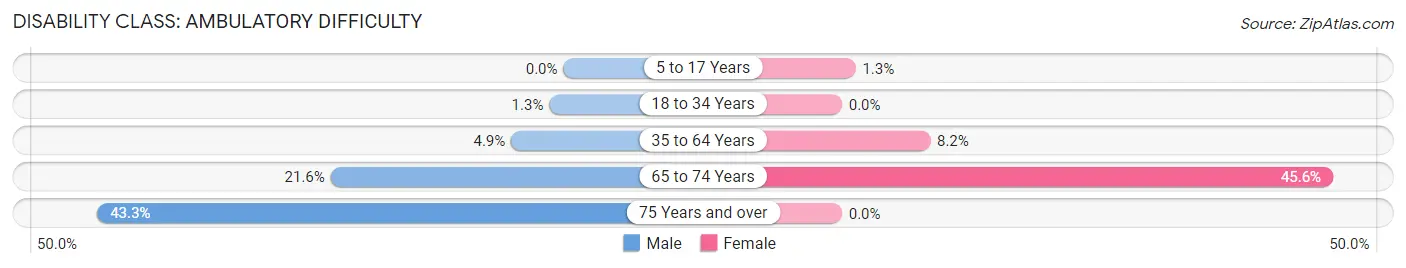
| Age Bracket | Male | Female |
| 5 to 17 Years | 0 (0.0%) | 10 (1.3%) |
| 18 to 34 Years | 9 (1.3%) | 0 (0.0%) |
| 35 to 64 Years | 62 (4.9%) | 115 (8.2%) |
| 65 to 74 Years | 43 (21.6%) | 103 (45.6%) |
| 75 Years and over | 61 (43.3%) | 0 (0.0%) |
Disability Class: Self-Care Difficulty
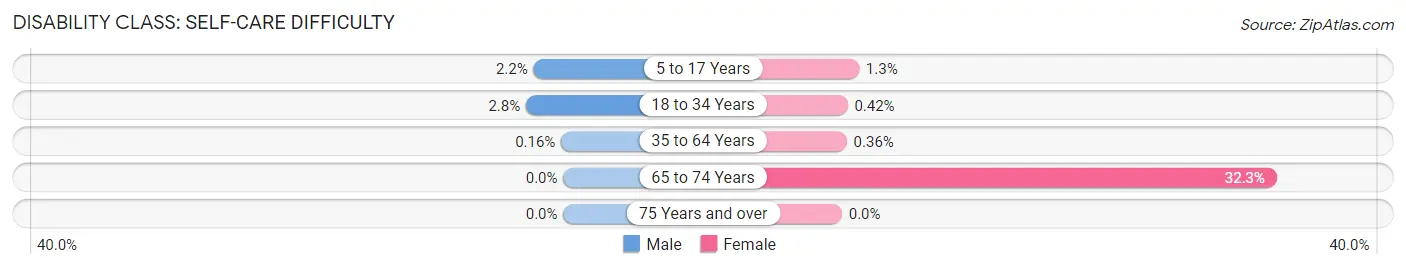
| Age Bracket | Male | Female |
| 5 to 17 Years | 23 (2.2%) | 10 (1.3%) |
| 18 to 34 Years | 19 (2.8%) | 4 (0.4%) |
| 35 to 64 Years | 2 (0.2%) | 5 (0.4%) |
| 65 to 74 Years | 0 (0.0%) | 73 (32.3%) |
| 75 Years and over | 0 (0.0%) | 0 (0.0%) |
Technology Access in Gridley
Computing Device Access in Gridley
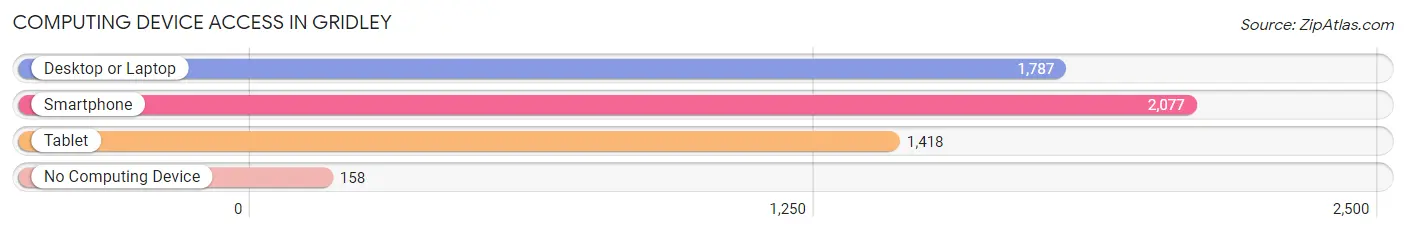
| Device Type | # Households | % Households |
| Desktop or Laptop | 1,787 | 74.4% |
| Smartphone | 2,077 | 86.5% |
| Tablet | 1,418 | 59.1% |
| No Computing Device | 158 | 6.6% |
| Total | 2,401 | 100.0% |
Internet Access in Gridley
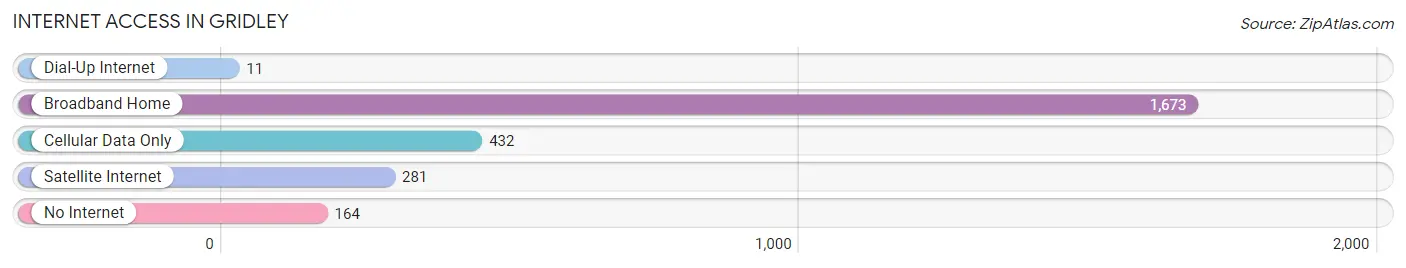
| Internet Type | # Households | % Households |
| Dial-Up Internet | 11 | 0.5% |
| Broadband Home | 1,673 | 69.7% |
| Cellular Data Only | 432 | 18.0% |
| Satellite Internet | 281 | 11.7% |
| No Internet | 164 | 6.8% |
| Total | 2,401 | 100.0% |
Gridley Summary
History
The city of Gridley, California is located in the northern part of the state, in Butte County. It is situated in the Sacramento Valley, about 20 miles north of the city of Chico. The city was founded in 1871 by William Gridley, a rancher and businessman from San Francisco. He purchased a large tract of land in the area and began to develop it into a town. The town was named after him and was incorporated in 1876.
Gridley has a rich history of agriculture and industry. In the late 1800s, the area was known for its wheat and barley production. In the early 1900s, the area was home to a thriving dairy industry. The city was also home to a number of brickyards, which produced bricks for the construction of buildings in the area.
In the 1950s, the city began to experience a period of growth and development. The city was home to a number of new businesses, including a cannery, a lumber mill, and a number of other industries. The city also experienced a population boom, with the population increasing from 1,500 in 1950 to over 5,000 in 1960.
Geography
Gridley is located in the northern part of California, in Butte County. It is situated in the Sacramento Valley, about 20 miles north of the city of Chico. The city is located at an elevation of about 200 feet above sea level. The city is surrounded by rolling hills and is located near the Feather River.
The climate in Gridley is generally mild, with temperatures ranging from the mid-50s in the winter to the mid-90s in the summer. The city receives an average of about 20 inches of rain per year.
Economy
Gridley’s economy is largely based on agriculture and industry. The city is home to a number of agricultural businesses, including a number of dairy farms, a cannery, and a number of other agricultural businesses. The city is also home to a number of industrial businesses, including a lumber mill, a brickyard, and a number of other industrial businesses.
The city is also home to a number of retail businesses, including a number of restaurants, grocery stores, and other retail establishments. The city is also home to a number of service businesses, including a number of medical and dental offices, as well as a number of other service businesses.
Demographics
As of the 2010 census, the population of Gridley was 6,584. The population is largely white, with about 75% of the population being white. The city is also home to a large Hispanic population, with about 20% of the population being Hispanic. The city is also home to a small African American population, with about 2% of the population being African American.
The median household income in Gridley is about $45,000, which is slightly lower than the state average. The median home value in the city is about $200,000, which is slightly higher than the state average. The city has a poverty rate of about 15%, which is slightly higher than the state average.
Conclusion
Gridley, California is a small city located in the northern part of the state, in Butte County. The city has a rich history of agriculture and industry, and is home to a number of businesses, including a number of agricultural businesses, industrial businesses, and retail businesses. The city has a population of about 6,584, with the majority of the population being white. The median household income in the city is about $45,000, and the median home value is about $200,000. The city has a poverty rate of about 15%, which is slightly higher than the state average.
Common Questions
What is Per Capita Income in Gridley?
Per Capita income in Gridley is $25,950.
What is the Median Family Income in Gridley?
Median Family Income in Gridley is $65,463.
What is the Median Household income in Gridley?
Median Household Income in Gridley is $56,428.
What is Income or Wage Gap in Gridley?
Income or Wage Gap in Gridley is 13.0%.
Women in Gridley earn 87.0 cents for every dollar earned by a man.
What is Inequality or Gini Index in Gridley?
Inequality or Gini Index in Gridley is 0.42.
What is the Total Population of Gridley?
Total Population of Gridley is 7,444.
What is the Total Male Population of Gridley?
Total Male Population of Gridley is 3,554.
What is the Total Female Population of Gridley?
Total Female Population of Gridley is 3,890.
What is the Ratio of Males per 100 Females in Gridley?
There are 91.36 Males per 100 Females in Gridley.
What is the Ratio of Females per 100 Males in Gridley?
There are 109.45 Females per 100 Males in Gridley.
What is the Median Population Age in Gridley?
Median Population Age in Gridley is 32.3 Years.
What is the Average Family Size in Gridley
Average Family Size in Gridley is 3.6 People.
What is the Average Household Size in Gridley
Average Household Size in Gridley is 3.0 People.
How Large is the Labor Force in Gridley?
There are 3,332 People in the Labor Forcein in Gridley.
What is the Percentage of People in the Labor Force in Gridley?
62.9% of People are in the Labor Force in Gridley.
What is the Unemployment Rate in Gridley?
Unemployment Rate in Gridley is 10.8%.