Cities with the Highest Percentage of Immigrants from Canada in Pennsylvania
RELATED REPORTS & OPTIONS
Canada
Pennsylvania
Compare Cities
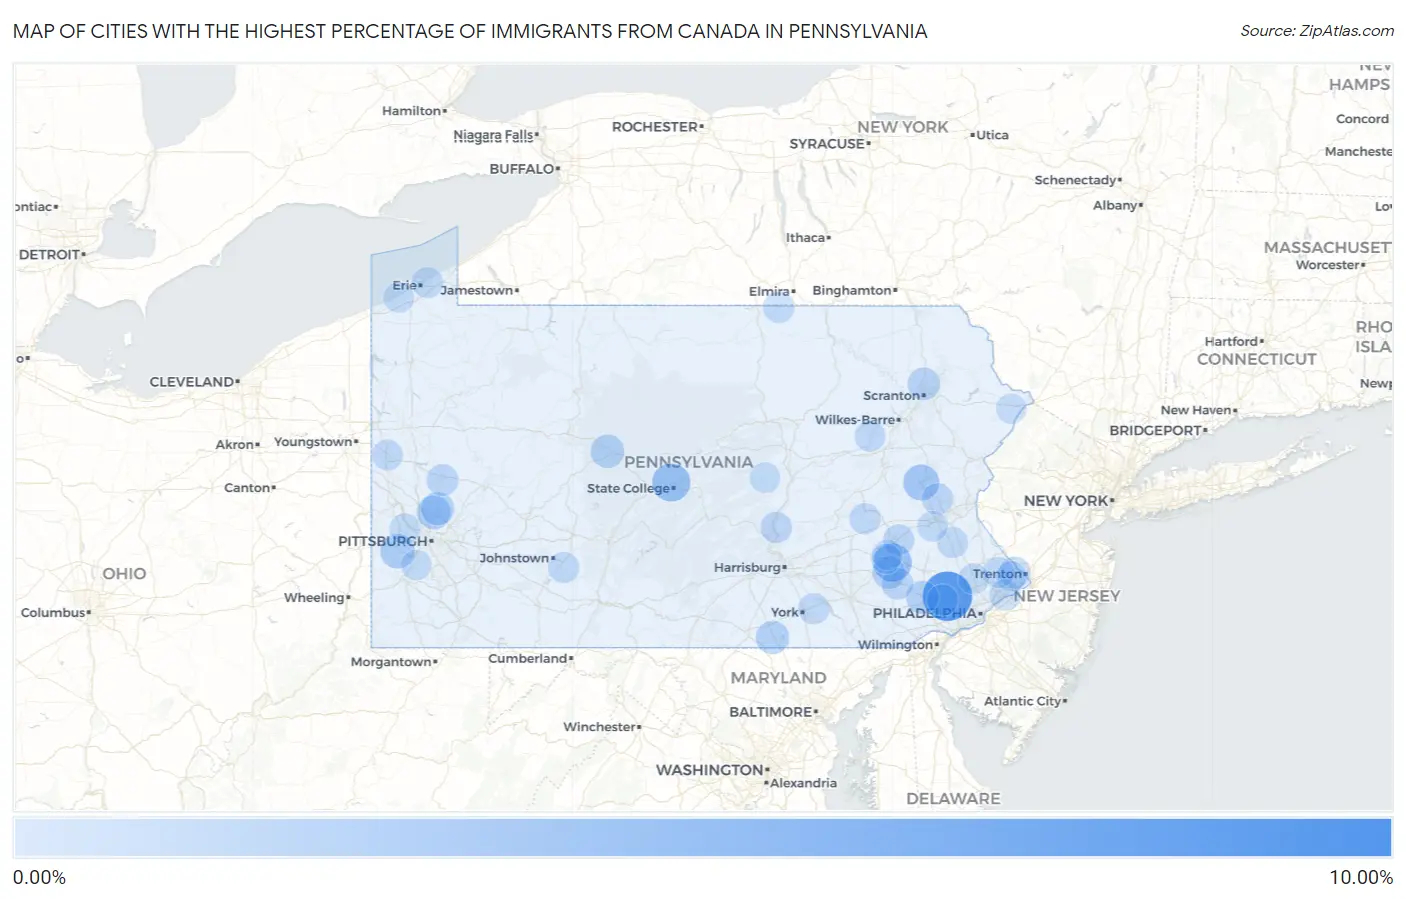
Map of Cities with the Highest Percentage of Immigrants from Canada in Pennsylvania
0.00%
10.00%
Cities with the Highest Percentage of Immigrants from Canada in Pennsylvania
| City | Canada | vs State | vs National | |
| 1. | Royer | 8.57% | 0.13%(+8.44)#-1 | 0.25%(+8.32)#0 |
| 2. | Chesterbrook | 7.52% | 0.13%(+7.39)#0 | 0.25%(+7.27)#1 |
| 3. | Grill | 3.37% | 0.13%(+3.24)#1 | 0.25%(+3.13)#2 |
| 4. | Toftrees | 3.25% | 0.13%(+3.12)#2 | 0.25%(+3.00)#3 |
| 5. | Eagles Mere Borough | 3.00% | 0.13%(+2.87)#3 | 0.25%(+2.75)#4 |
| 6. | Weissport East | 2.51% | 0.13%(+2.38)#4 | 0.25%(+2.27)#5 |
| 7. | Midway | 1.97% | 0.13%(+1.83)#5 | 0.25%(+1.72)#6 |
| 8. | Ashley Borough | 1.91% | 0.13%(+1.78)#6 | 0.25%(+1.67)#7 |
| 9. | Bryn Athyn Borough | 1.88% | 0.13%(+1.75)#7 | 0.25%(+1.64)#8 |
| 10. | Beaver Borough | 1.88% | 0.13%(+1.75)#8 | 0.25%(+1.64)#9 |
| 11. | Portersville Borough | 1.88% | 0.13%(+1.75)#9 | 0.25%(+1.63)#10 |
| 12. | Gibsonia | 1.67% | 0.13%(+1.54)#10 | 0.25%(+1.42)#11 |
| 13. | Plymptonville | 1.62% | 0.13%(+1.49)#11 | 0.25%(+1.37)#12 |
| 14. | Vanderbilt Borough | 1.59% | 0.13%(+1.46)#12 | 0.25%(+1.34)#13 |
| 15. | Bakerstown | 1.54% | 0.13%(+1.41)#13 | 0.25%(+1.29)#14 |
| 16. | Pughtown | 1.52% | 0.13%(+1.39)#14 | 0.25%(+1.27)#15 |
| 17. | Pennville | 1.51% | 0.13%(+1.37)#15 | 0.25%(+1.26)#16 |
| 18. | South Williamsport Borough | 1.49% | 0.13%(+1.36)#16 | 0.25%(+1.24)#17 |
| 19. | Edgewood Borough | 1.45% | 0.13%(+1.32)#17 | 0.25%(+1.20)#18 |
| 20. | Alleghenyville | 1.41% | 0.13%(+1.28)#18 | 0.25%(+1.17)#19 |
| 21. | Eagleview | 1.39% | 0.13%(+1.26)#19 | 0.25%(+1.14)#20 |
| 22. | Laceyville Borough | 1.32% | 0.13%(+1.19)#20 | 0.25%(+1.07)#21 |
| 23. | East Rochester Borough | 1.31% | 0.13%(+1.18)#21 | 0.25%(+1.06)#22 |
| 24. | Forest City Borough | 1.30% | 0.13%(+1.17)#22 | 0.25%(+1.05)#23 |
| 25. | Vandling Borough | 1.26% | 0.13%(+1.13)#23 | 0.25%(+1.01)#24 |
| 26. | Chinchilla | 1.24% | 0.13%(+1.10)#24 | 0.25%(+0.987)#25 |
| 27. | Chadds Ford | 1.23% | 0.13%(+1.10)#25 | 0.25%(+0.983)#26 |
| 28. | Lemoyne Borough | 1.16% | 0.13%(+1.03)#26 | 0.25%(+0.910)#27 |
| 29. | Glen Osborne Borough | 1.13% | 0.13%(+0.995)#27 | 0.25%(+0.878)#28 |
| 30. | Sewickley Borough | 1.06% | 0.13%(+0.927)#28 | 0.25%(+0.810)#29 |
| 31. | Cross Roads Borough | 0.99% | 0.13%(+0.861)#29 | 0.25%(+0.744)#30 |
| 32. | Spring City Borough | 0.98% | 0.13%(+0.844)#30 | 0.25%(+0.727)#31 |
| 33. | Little Meadows Borough | 0.97% | 0.13%(+0.840)#31 | 0.25%(+0.723)#32 |
| 34. | Aspinwall Borough | 0.97% | 0.13%(+0.838)#32 | 0.25%(+0.721)#33 |
| 35. | Meadowood | 0.95% | 0.13%(+0.823)#33 | 0.25%(+0.705)#34 |
| 36. | Denver Borough | 0.95% | 0.13%(+0.819)#34 | 0.25%(+0.702)#35 |
| 37. | Morgantown | 0.94% | 0.13%(+0.805)#35 | 0.25%(+0.688)#36 |
| 38. | Tunkhannock Borough | 0.92% | 0.13%(+0.786)#36 | 0.25%(+0.669)#37 |
| 39. | Mahanoy City Borough | 0.90% | 0.13%(+0.771)#37 | 0.25%(+0.654)#38 |
| 40. | Woodside | 0.87% | 0.13%(+0.736)#38 | 0.25%(+0.619)#39 |
| 41. | Lenkerville | 0.86% | 0.13%(+0.731)#39 | 0.25%(+0.614)#40 |
| 42. | Edgeworth Borough | 0.86% | 0.13%(+0.724)#40 | 0.25%(+0.607)#41 |
| 43. | Merion Station | 0.83% | 0.13%(+0.703)#41 | 0.25%(+0.586)#671 |
| 44. | Paoli | 0.83% | 0.13%(+0.702)#42 | 0.25%(+0.585)#672 |
| 45. | Laurys Station | 0.82% | 0.13%(+0.693)#43 | 0.25%(+0.576)#673 |
| 46. | Blandon | 0.80% | 0.13%(+0.671)#44 | 0.25%(+0.554)#674 |
| 47. | Stonybrook | 0.78% | 0.13%(+0.652)#45 | 0.25%(+0.535)#675 |
| 48. | Millerton | 0.78% | 0.13%(+0.646)#46 | 0.25%(+0.529)#676 |
| 49. | Lake Wynonah | 0.77% | 0.13%(+0.642)#47 | 0.25%(+0.525)#677 |
| 50. | University Of Pittsburgh Johnstown | 0.77% | 0.13%(+0.639)#48 | 0.25%(+0.522)#678 |
| 51. | Villanova | 0.77% | 0.13%(+0.636)#49 | 0.25%(+0.519)#679 |
| 52. | Glenmoore | 0.76% | 0.13%(+0.633)#50 | 0.25%(+0.516)#680 |
| 53. | Narberth Borough | 0.76% | 0.13%(+0.628)#51 | 0.25%(+0.511)#681 |
| 54. | Markleysburg Borough | 0.75% | 0.13%(+0.624)#52 | 0.25%(+0.507)#682 |
| 55. | Nesquehoning Borough | 0.75% | 0.13%(+0.617)#53 | 0.25%(+0.500)#683 |
| 56. | Cornwells Heights | 0.75% | 0.13%(+0.616)#54 | 0.25%(+0.499)#684 |
| 57. | Franklin Park Borough | 0.74% | 0.13%(+0.614)#55 | 0.25%(+0.497)#685 |
| 58. | Richboro | 0.74% | 0.13%(+0.614)#56 | 0.25%(+0.496)#686 |
| 59. | Eldred Borough | 0.72% | 0.13%(+0.594)#57 | 0.25%(+0.476)#687 |
| 60. | Wellsboro Borough | 0.72% | 0.13%(+0.592)#58 | 0.25%(+0.475)#688 |
| 61. | Leetsdale Borough | 0.71% | 0.13%(+0.580)#59 | 0.25%(+0.463)#689 |
| 62. | Lawrence Park | 0.71% | 0.13%(+0.576)#60 | 0.25%(+0.459)#690 |
| 63. | Milford Square | 0.70% | 0.13%(+0.565)#61 | 0.25%(+0.448)#691 |
| 64. | Harrisville Borough | 0.69% | 0.13%(+0.563)#62 | 0.25%(+0.445)#692 |
| 65. | Sutersville Borough | 0.68% | 0.13%(+0.545)#63 | 0.25%(+0.427)#693 |
| 66. | Oakwood | 0.67% | 0.13%(+0.536)#64 | 0.25%(+0.419)#694 |
| 67. | Portland Borough | 0.66% | 0.13%(+0.529)#65 | 0.25%(+0.412)#695 |
| 68. | Mocanaqua | 0.65% | 0.13%(+0.522)#66 | 0.25%(+0.405)#696 |
| 69. | Bradford Woods Borough | 0.65% | 0.13%(+0.517)#67 | 0.25%(+0.400)#697 |
| 70. | Ben Avon Heights Borough | 0.64% | 0.13%(+0.510)#68 | 0.25%(+0.393)#698 |
| 71. | Indian Lake Borough | 0.64% | 0.13%(+0.506)#69 | 0.25%(+0.389)#699 |
| 72. | West Mayfield Borough | 0.63% | 0.13%(+0.499)#70 | 0.25%(+0.382)#700 |
| 73. | Carnot Moon | 0.63% | 0.13%(+0.498)#107 | 0.25%(+0.381)#2,658 |
| 74. | Ancient Oaks | 0.62% | 0.13%(+0.494)#108 | 0.25%(+0.377)#2,659 |
| 75. | Telford Borough | 0.62% | 0.13%(+0.493)#109 | 0.25%(+0.376)#2,660 |
| 76. | Conyngham Borough | 0.61% | 0.13%(+0.480)#110 | 0.25%(+0.363)#2,661 |
| 77. | Cleona Borough | 0.60% | 0.13%(+0.471)#111 | 0.25%(+0.354)#2,662 |
| 78. | Spring House | 0.60% | 0.13%(+0.468)#112 | 0.25%(+0.351)#2,663 |
| 79. | Milford Borough | 0.58% | 0.13%(+0.449)#113 | 0.25%(+0.332)#2,664 |
| 80. | Loganville Borough | 0.58% | 0.13%(+0.445)#114 | 0.25%(+0.328)#2,665 |
| 81. | Colony Park | 0.57% | 0.13%(+0.444)#115 | 0.25%(+0.327)#2,666 |
| 82. | Nazareth Borough | 0.57% | 0.13%(+0.434)#116 | 0.25%(+0.317)#2,667 |
| 83. | Avonia | 0.56% | 0.13%(+0.424)#117 | 0.25%(+0.307)#2,668 |
| 84. | Chestnut Hill | 0.55% | 0.13%(+0.423)#118 | 0.25%(+0.306)#2,669 |
| 85. | Bridgeville Borough | 0.52% | 0.13%(+0.392)#119 | 0.25%(+0.275)#2,670 |
| 86. | Brownstown Borough | 0.52% | 0.13%(+0.392)#120 | 0.25%(+0.274)#2,671 |
| 87. | Thompsonville | 0.52% | 0.13%(+0.387)#121 | 0.25%(+0.270)#2,672 |
| 88. | Shiremanstown Borough | 0.51% | 0.13%(+0.383)#122 | 0.25%(+0.266)#2,673 |
| 89. | Schwenksville Borough | 0.51% | 0.13%(+0.381)#123 | 0.25%(+0.264)#2,674 |
| 90. | Robesonia Borough | 0.51% | 0.13%(+0.381)#124 | 0.25%(+0.264)#2,675 |
| 91. | Penns Creek | 0.50% | 0.13%(+0.373)#125 | 0.25%(+0.256)#2,676 |
| 92. | St. Davids | 0.49% | 0.13%(+0.363)#126 | 0.25%(+0.246)#2,677 |
| 93. | North East Borough | 0.49% | 0.13%(+0.358)#127 | 0.25%(+0.241)#2,678 |
| 94. | Pocono Woodland Lakes | 0.48% | 0.13%(+0.348)#128 | 0.25%(+0.231)#2,679 |
| 95. | Burnham Borough | 0.47% | 0.13%(+0.343)#129 | 0.25%(+0.226)#2,680 |
| 96. | Pennsbury Village Borough | 0.47% | 0.13%(+0.343)#130 | 0.25%(+0.226)#2,681 |
| 97. | West Wyomissing | 0.46% | 0.13%(+0.328)#131 | 0.25%(+0.211)#2,682 |
| 98. | Loretto Borough | 0.46% | 0.13%(+0.324)#132 | 0.25%(+0.207)#2,683 |
| 99. | Platea Borough | 0.45% | 0.13%(+0.323)#133 | 0.25%(+0.206)#2,684 |
| 100. | Woodbourne | 0.45% | 0.13%(+0.317)#134 | 0.25%(+0.200)#2,685 |
Common Questions
What are the Top 10 Cities with the Highest Percentage of Immigrants from Canada in Pennsylvania?
Top 10 Cities with the Highest Percentage of Immigrants from Canada in Pennsylvania are:
#1
7.52%
#2
3.37%
#3
3.25%
#4
2.51%
#5
1.97%
#6
1.67%
#7
1.62%
#8
1.54%
#9
1.51%
#10
1.41%
What city has the Highest Percentage of Immigrants from Canada in Pennsylvania?
Chesterbrook has the Highest Percentage of Immigrants from Canada in Pennsylvania with 7.52%.
What is the Percentage of Immigrants from Canada in the State of Pennsylvania?
Percentage of Immigrants from Canada in Pennsylvania is 0.13%.
What is the Percentage of Immigrants from Canada in the United States?
Percentage of Immigrants from Canada in the United States is 0.25%.