Cities with the Highest Percentage of Immigrants from Canada in Montana
RELATED REPORTS & OPTIONS
Canada
Montana
Compare Cities
Map of Cities with the Highest Percentage of Immigrants from Canada in Montana
0.00%
100.00%
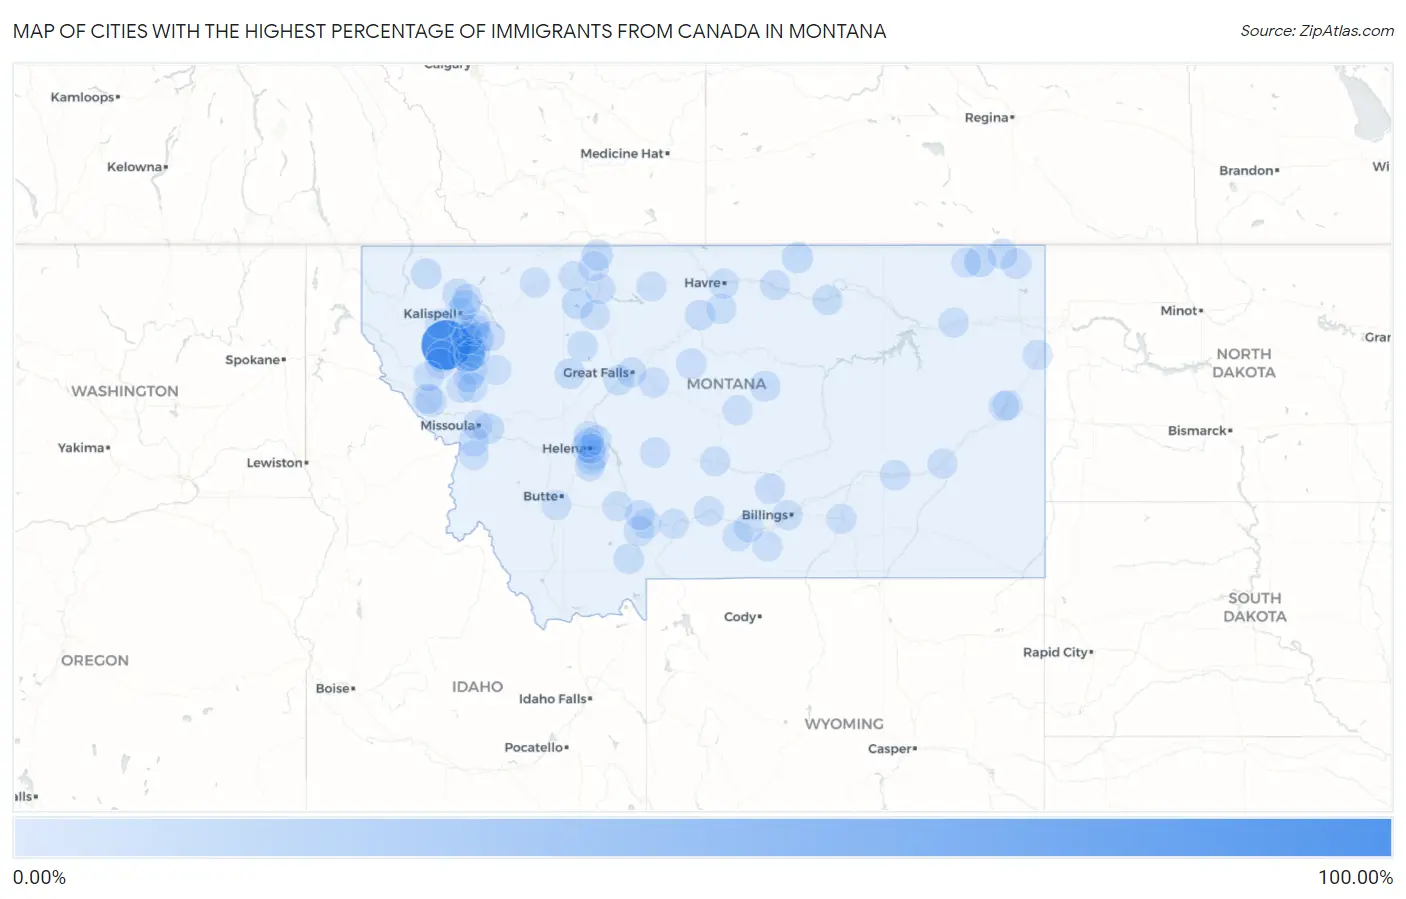
Cities with the Highest Percentage of Immigrants from Canada in Montana
| City | Canada | vs State | vs National | |
| 1. | Niarada | 100.00% | 0.32%(+99.7)#-1 | 0.25%(+99.8)#0 |
| 2. | Whitlash | 50.00% | 0.32%(+49.7)#0 | 0.25%(+49.8)#1 |
| 3. | Rocky Point | 32.05% | 0.32%(+31.7)#1 | 0.25%(+31.8)#2 |
| 4. | Camrose Colony | 13.16% | 0.32%(+12.8)#2 | 0.25%(+12.9)#3 |
| 5. | Turner Colony | 12.70% | 0.32%(+12.4)#3 | 0.25%(+12.5)#4 |
| 6. | Birch Creek Colony | 11.88% | 0.32%(+11.6)#4 | 0.25%(+11.6)#5 |
| 7. | Bear Dance | 10.37% | 0.32%(+10.1)#5 | 0.25%(+10.1)#6 |
| 8. | Fords Creek Colony | 9.43% | 0.32%(+9.11)#6 | 0.25%(+9.19)#7 |
| 9. | Flaxville | 8.06% | 0.32%(+7.74)#7 | 0.25%(+7.82)#8 |
| 10. | Ayers Ranch Colony | 7.69% | 0.32%(+7.37)#8 | 0.25%(+7.44)#9 |
| 11. | Gildford Colony | 7.69% | 0.32%(+7.37)#9 | 0.25%(+7.44)#10 |
| 12. | Lonepine | 6.21% | 0.32%(+5.89)#10 | 0.25%(+5.96)#11 |
| 13. | Turner | 5.80% | 0.32%(+5.48)#11 | 0.25%(+5.55)#12 |
| 14. | Kings Point | 5.65% | 0.32%(+5.33)#12 | 0.25%(+5.40)#13 |
| 15. | Valier | 5.38% | 0.32%(+5.06)#13 | 0.25%(+5.13)#14 |
| 16. | Riverbend | 4.16% | 0.32%(+3.84)#14 | 0.25%(+3.91)#15 |
| 17. | Sunburst | 4.08% | 0.32%(+3.76)#15 | 0.25%(+3.83)#16 |
| 18. | Lakeside | 3.90% | 0.32%(+3.58)#16 | 0.25%(+3.65)#17 |
| 19. | Roy | 3.68% | 0.32%(+3.36)#17 | 0.25%(+3.43)#18 |
| 20. | Finley Point | 3.26% | 0.32%(+2.94)#18 | 0.25%(+3.01)#19 |
| 21. | Rollins | 3.17% | 0.32%(+2.85)#19 | 0.25%(+2.93)#20 |
| 22. | Augusta | 2.79% | 0.32%(+2.47)#20 | 0.25%(+2.54)#21 |
| 23. | Turah | 2.79% | 0.32%(+2.47)#21 | 0.25%(+2.54)#22 |
| 24. | Trego | 2.61% | 0.32%(+2.29)#22 | 0.25%(+2.36)#23 |
| 25. | Montana City | 2.58% | 0.32%(+2.26)#23 | 0.25%(+2.33)#24 |
| 26. | Plentywood | 2.02% | 0.32%(+1.70)#24 | 0.25%(+1.77)#25 |
| 27. | Geraldine | 1.93% | 0.32%(+1.61)#25 | 0.25%(+1.68)#26 |
| 28. | Carlton | 1.91% | 0.32%(+1.59)#26 | 0.25%(+1.66)#27 |
| 29. | Vida | 1.89% | 0.32%(+1.57)#27 | 0.25%(+1.64)#28 |
| 30. | Glacier Colony | 1.83% | 0.32%(+1.51)#28 | 0.25%(+1.58)#29 |
| 31. | New Miami Colony | 1.69% | 0.32%(+1.36)#29 | 0.25%(+1.44)#30 |
| 32. | Big Sandy | 1.63% | 0.32%(+1.31)#30 | 0.25%(+1.38)#31 |
| 33. | Riverview Colony | 1.51% | 0.32%(+1.19)#31 | 0.25%(+1.26)#32 |
| 34. | Shelby | 1.50% | 0.32%(+1.18)#32 | 0.25%(+1.26)#33 |
| 35. | Hot Springs | 1.47% | 0.32%(+1.15)#33 | 0.25%(+1.22)#34 |
| 36. | Malta | 1.41% | 0.32%(+1.09)#34 | 0.25%(+1.17)#35 |
| 37. | Outlook | 1.41% | 0.32%(+1.09)#35 | 0.25%(+1.16)#36 |
| 38. | Harlem | 1.39% | 0.32%(+1.07)#36 | 0.25%(+1.14)#37 |
| 39. | Whitefish | 1.33% | 0.32%(+1.01)#37 | 0.25%(+1.09)#38 |
| 40. | Ulm | 1.31% | 0.32%(+0.985)#38 | 0.25%(+1.06)#39 |
| 41. | Gallatin Gateway | 1.24% | 0.32%(+0.921)#39 | 0.25%(+0.993)#40 |
| 42. | Old Agency | 1.18% | 0.32%(+0.856)#40 | 0.25%(+0.928)#41 |
| 43. | White Sulphur Springs | 1.17% | 0.32%(+0.848)#41 | 0.25%(+0.921)#42 |
| 44. | Belt | 1.13% | 0.32%(+0.807)#42 | 0.25%(+0.880)#43 |
| 45. | Woods Bay | 1.09% | 0.32%(+0.765)#43 | 0.25%(+0.837)#44 |
| 46. | Helena West Side | 1.07% | 0.32%(+0.748)#44 | 0.25%(+0.820)#45 |
| 47. | Parker School | 1.03% | 0.32%(+0.713)#45 | 0.25%(+0.785)#46 |
| 48. | Broadview | 0.99% | 0.32%(+0.669)#46 | 0.25%(+0.742)#47 |
| 49. | Forsyth | 0.96% | 0.32%(+0.639)#47 | 0.25%(+0.712)#48 |
| 50. | Pine Creek | 0.95% | 0.32%(+0.627)#48 | 0.25%(+0.700)#49 |
| 51. | Bigfork | 0.93% | 0.32%(+0.608)#49 | 0.25%(+0.681)#50 |
| 52. | Swan Lake | 0.93% | 0.32%(+0.605)#50 | 0.25%(+0.678)#51 |
| 53. | Superior | 0.92% | 0.32%(+0.597)#51 | 0.25%(+0.669)#52 |
| 54. | Choteau | 0.88% | 0.32%(+0.554)#52 | 0.25%(+0.627)#53 |
| 55. | Big Sky | 0.85% | 0.32%(+0.529)#53 | 0.25%(+0.601)#54 |
| 56. | Kevin | 0.81% | 0.32%(+0.486)#54 | 0.25%(+0.558)#55 |
| 57. | Cut Bank | 0.75% | 0.32%(+0.431)#55 | 0.25%(+0.503)#56 |
| 58. | Fromberg | 0.73% | 0.32%(+0.413)#56 | 0.25%(+0.485)#57 |
| 59. | Lewistown | 0.72% | 0.32%(+0.397)#57 | 0.25%(+0.470)#58 |
| 60. | Rimrock Colony | 0.71% | 0.32%(+0.393)#58 | 0.25%(+0.466)#59 |
| 61. | Absarokee | 0.69% | 0.32%(+0.370)#59 | 0.25%(+0.442)#60 |
| 62. | Conrad | 0.68% | 0.32%(+0.361)#60 | 0.25%(+0.434)#61 |
| 63. | Plains | 0.68% | 0.32%(+0.357)#61 | 0.25%(+0.429)#62 |
| 64. | Clancy | 0.66% | 0.32%(+0.339)#62 | 0.25%(+0.412)#63 |
| 65. | Condon | 0.65% | 0.32%(+0.331)#63 | 0.25%(+0.403)#64 |
| 66. | Helena Valley Northwest | 0.54% | 0.32%(+0.224)#64 | 0.25%(+0.296)#65 |
| 67. | Hardin | 0.53% | 0.32%(+0.205)#65 | 0.25%(+0.278)#66 |
| 68. | Chester | 0.52% | 0.32%(+0.196)#66 | 0.25%(+0.269)#67 |
| 69. | Ronan | 0.48% | 0.32%(+0.161)#67 | 0.25%(+0.234)#68 |
| 70. | Three Forks | 0.42% | 0.32%(+0.101)#68 | 0.25%(+0.174)#69 |
| 71. | Jefferson City | 0.42% | 0.32%(+0.096)#69 | 0.25%(+0.168)#70 |
| 72. | Browning | 0.34% | 0.32%(+0.024)#70 | 0.25%(+0.096)#71 |
| 73. | Marion | 0.33% | 0.32%(+0.007)#71 | 0.25%(+0.080)#72 |
| 74. | West Glendive | 0.31% | 0.32%(-0.007)#72 | 0.25%(+0.066)#73 |
| 75. | Kalispell | 0.30% | 0.32%(-0.022)#73 | 0.25%(+0.050)#74 |
| 76. | St Ignatius | 0.29% | 0.32%(-0.026)#74 | 0.25%(+0.046)#75 |
| 77. | Charlo | 0.28% | 0.32%(-0.040)#75 | 0.25%(+0.033)#76 |
| 78. | Missoula | 0.28% | 0.32%(-0.041)#76 | 0.25%(+0.032)#1,937 |
| 79. | Bozeman | 0.28% | 0.32%(-0.042)#77 | 0.25%(+0.030)#3,134 |
| 80. | Havre | 0.26% | 0.32%(-0.064)#78 | 0.25%(+0.009)#3,135 |
| 81. | Scobey | 0.25% | 0.32%(-0.068)#79 | 0.25%(+0.005)#3,136 |
| 82. | Stevensville | 0.25% | 0.32%(-0.075)#80 | 0.25%(-0.003)#3,137 |
| 83. | Helena Valley Northeast | 0.24% | 0.32%(-0.085)#81 | 0.25%(-0.013)#3,138 |
| 84. | Glendive | 0.23% | 0.32%(-0.095)#82 | 0.25%(-0.022)#3,139 |
| 85. | Billings | 0.22% | 0.32%(-0.104)#83 | 0.25%(-0.031)#3,266 |
| 86. | Columbus | 0.21% | 0.32%(-0.114)#84 | 0.25%(-0.041)#3,267 |
| 87. | Harlowton | 0.20% | 0.32%(-0.121)#85 | 0.25%(-0.048)#3,268 |
| 88. | Great Falls | 0.20% | 0.32%(-0.125)#86 | 0.25%(-0.053)#3,269 |
| 89. | Wolf Point | 0.19% | 0.32%(-0.131)#87 | 0.25%(-0.058)#3,270 |
| 90. | Helena Flats | 0.19% | 0.32%(-0.134)#88 | 0.25%(-0.061)#3,271 |
| 91. | Big Timber | 0.18% | 0.32%(-0.145)#89 | 0.25%(-0.072)#3,272 |
| 92. | Polson | 0.17% | 0.32%(-0.148)#90 | 0.25%(-0.076)#3,273 |
| 93. | Helena | 0.17% | 0.32%(-0.152)#91 | 0.25%(-0.079)#3,274 |
| 94. | Columbia Falls | 0.17% | 0.32%(-0.155)#92 | 0.25%(-0.083)#3,275 |
| 95. | Belgrade | 0.16% | 0.32%(-0.165)#93 | 0.25%(-0.093)#3,276 |
| 96. | Sidney | 0.14% | 0.32%(-0.177)#94 | 0.25%(-0.104)#3,277 |
| 97. | Livingston | 0.14% | 0.32%(-0.179)#95 | 0.25%(-0.107)#3,278 |
| 98. | Helena Valley West Central | 0.097% | 0.32%(-0.223)#96 | 0.25%(-0.151)#3,279 |
| 99. | Butte Silver Bow Balance | 0.092% | 0.32%(-0.228)#97 | 0.25%(-0.156)#3,280 |
| 100. | Miles City | 0.071% | 0.32%(-0.250)#98 | 0.25%(-0.177)#3,281 |
Common Questions
What are the Top 10 Cities with the Highest Percentage of Immigrants from Canada in Montana?
Top 10 Cities with the Highest Percentage of Immigrants from Canada in Montana are:
#1
100.00%
#2
32.05%
#3
10.37%
#4
8.06%
#5
6.21%
#6
5.80%
#7
5.65%
#8
5.38%
#9
4.16%
#10
4.08%
What city has the Highest Percentage of Immigrants from Canada in Montana?
Niarada has the Highest Percentage of Immigrants from Canada in Montana with 100.00%.
What is the Percentage of Immigrants from Canada in the State of Montana?
Percentage of Immigrants from Canada in Montana is 0.32%.
What is the Percentage of Immigrants from Canada in the United States?
Percentage of Immigrants from Canada in the United States is 0.25%.