Cambria, CA Map & Demographics
Cambria Map
Cambria Overview
$54,483
PER CAPITA INCOME
$103,583
AVG FAMILY INCOME
$95,460
AVG HOUSEHOLD INCOME
39.4%
WAGE / INCOME GAP [ % ]
60.6¢/ $1
WAGE / INCOME GAP [ $ ]
0.45
INEQUALITY / GINI INDEX
5,825
TOTAL POPULATION
2,851
MALE POPULATION
2,974
FEMALE POPULATION
95.86
MALES / 100 FEMALES
104.31
FEMALES / 100 MALES
60.1
MEDIAN AGE
2.7
AVG FAMILY SIZE
2.1
AVG HOUSEHOLD SIZE
2,493
LABOR FORCE [ PEOPLE ]
48.6%
PERCENT IN LABOR FORCE
6.4%
UNEMPLOYMENT RATE
Cambria Zip Codes
Cambria Area Codes
Income in Cambria
Income Overview in Cambria
Per Capita Income in Cambria is $54,483, while median incomes of families and households are $103,583 and $95,460 respectively.
| Characteristic | Number | Measure |
| Per Capita Income | 5,825 | $54,483 |
| Median Family Income | 1,670 | $103,583 |
| Mean Family Income | 1,670 | $132,364 |
| Median Household Income | 2,802 | $95,460 |
| Mean Household Income | 2,802 | $112,616 |
| Income Deficit | 1,670 | $0 |
| Wage / Income Gap (%) | 5,825 | 39.44% |
| Wage / Income Gap ($) | 5,825 | 60.56¢ per $1 |
| Gini / Inequality Index | 5,825 | 0.45 |
Earnings by Sex in Cambria
Average Earnings in Cambria are $33,627, $44,096 for men and $26,705 for women, a difference of 39.4%.
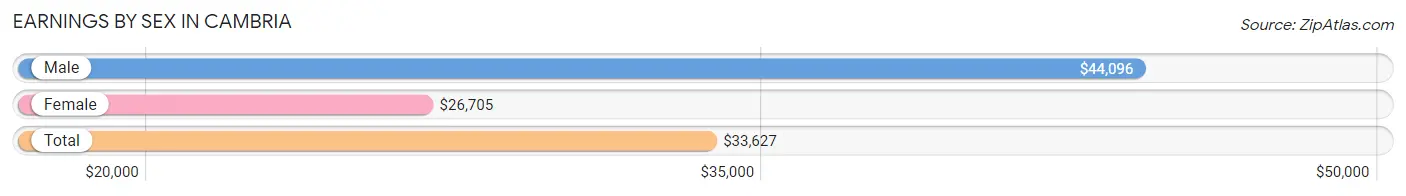
| Sex | Number | Average Earnings |
| Male | 1,500 (55.1%) | $44,096 |
| Female | 1,223 (44.9%) | $26,705 |
| Total | 2,723 (100.0%) | $33,627 |
Earnings by Sex by Income Bracket in Cambria
The most common earnings brackets in Cambria are $100,000+ for men (437 | 29.1%) and $100,000+ for women (199 | 16.3%).
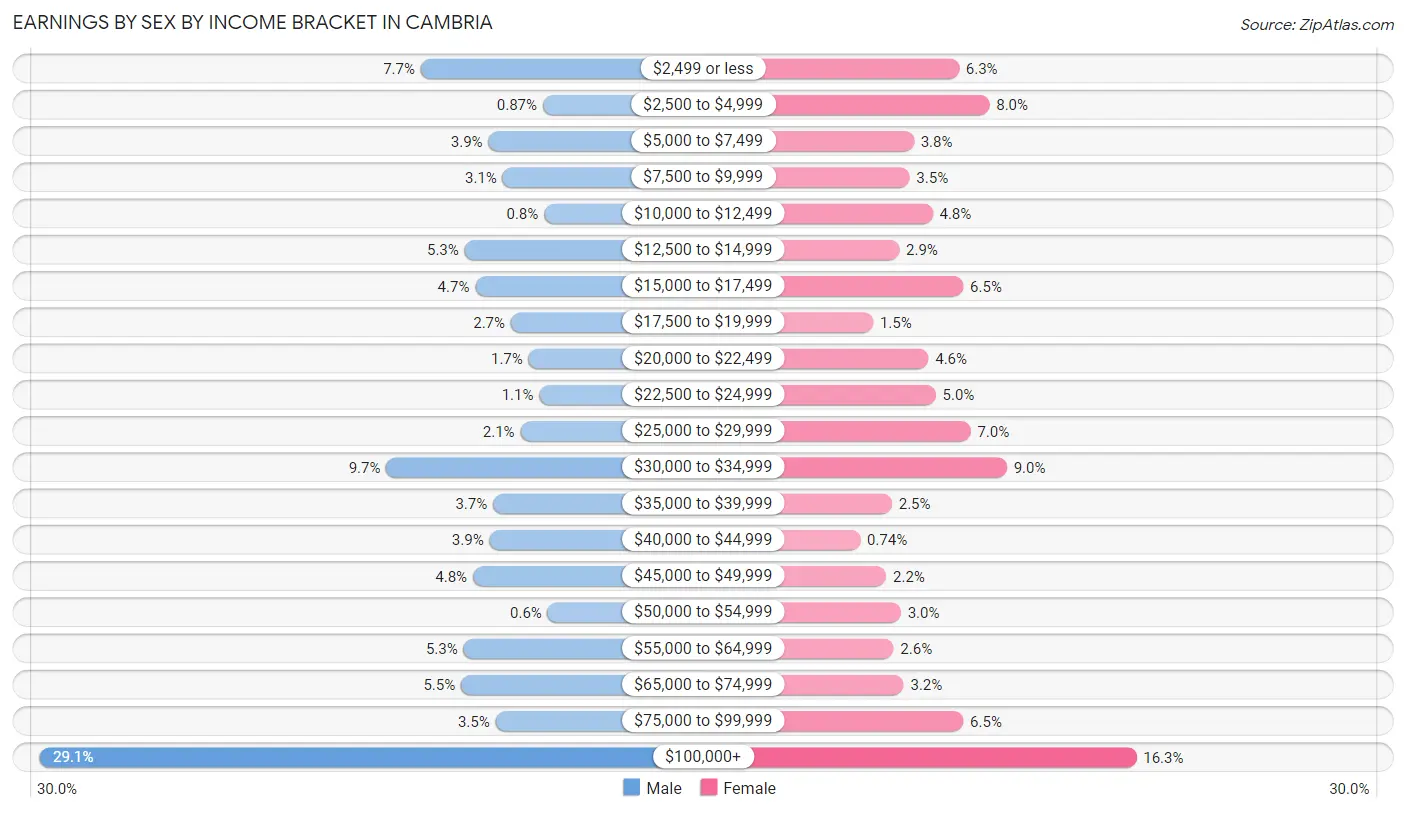
| Income | Male | Female |
| $2,499 or less | 116 (7.7%) | 77 (6.3%) |
| $2,500 to $4,999 | 13 (0.9%) | 98 (8.0%) |
| $5,000 to $7,499 | 59 (3.9%) | 46 (3.8%) |
| $7,500 to $9,999 | 47 (3.1%) | 43 (3.5%) |
| $10,000 to $12,499 | 12 (0.8%) | 59 (4.8%) |
| $12,500 to $14,999 | 79 (5.3%) | 36 (2.9%) |
| $15,000 to $17,499 | 70 (4.7%) | 80 (6.5%) |
| $17,500 to $19,999 | 40 (2.7%) | 18 (1.5%) |
| $20,000 to $22,499 | 25 (1.7%) | 56 (4.6%) |
| $22,500 to $24,999 | 16 (1.1%) | 61 (5.0%) |
| $25,000 to $29,999 | 32 (2.1%) | 85 (7.0%) |
| $30,000 to $34,999 | 145 (9.7%) | 110 (9.0%) |
| $35,000 to $39,999 | 55 (3.7%) | 31 (2.5%) |
| $40,000 to $44,999 | 58 (3.9%) | 9 (0.7%) |
| $45,000 to $49,999 | 72 (4.8%) | 27 (2.2%) |
| $50,000 to $54,999 | 9 (0.6%) | 37 (3.0%) |
| $55,000 to $64,999 | 80 (5.3%) | 32 (2.6%) |
| $65,000 to $74,999 | 82 (5.5%) | 39 (3.2%) |
| $75,000 to $99,999 | 53 (3.5%) | 80 (6.5%) |
| $100,000+ | 437 (29.1%) | 199 (16.3%) |
| Total | 1,500 (100.0%) | 1,223 (100.0%) |
Earnings by Sex by Educational Attainment in Cambria
Average earnings in Cambria are $48,431 for men and $29,333 for women, a difference of 39.4%. Men with an educational attainment of graduate degree enjoy the highest average annual earnings of $69,474, while those with less than high school education earn the least with $33,869. Women with an educational attainment of graduate degree earn the most with the average annual earnings of $45,602, while those with college or associate's degree education have the smallest earnings of $25,509.
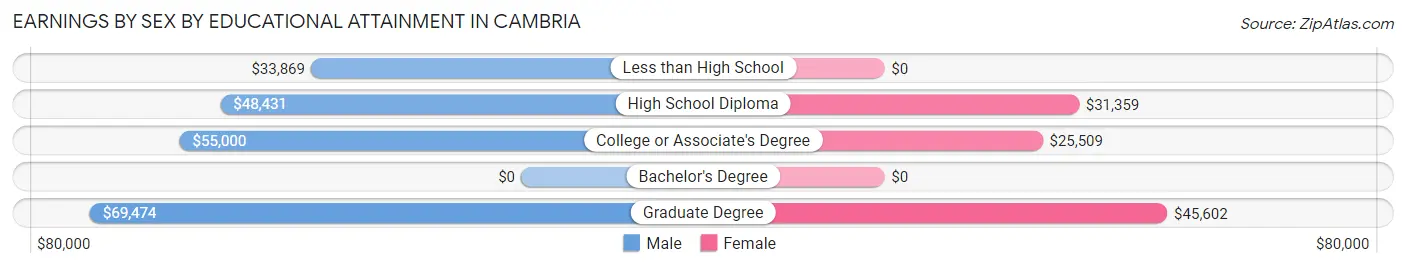
| Educational Attainment | Male Income | Female Income |
| Less than High School | $33,869 | $0 |
| High School Diploma | $48,431 | $31,359 |
| College or Associate's Degree | $55,000 | $25,509 |
| Bachelor's Degree | - | - |
| Graduate Degree | $69,474 | $45,602 |
| Total | $48,431 | $29,333 |
Family Income in Cambria
Family Income Brackets in Cambria
According to the Cambria family income data, there are 371 families falling into the $100,000 to $149,999 income range, which is the most common income bracket and makes up 22.2% of all families. Conversely, the $25,000 to $34,999 income bracket is the least frequent group with only 10 families (0.6%) belonging to this category.
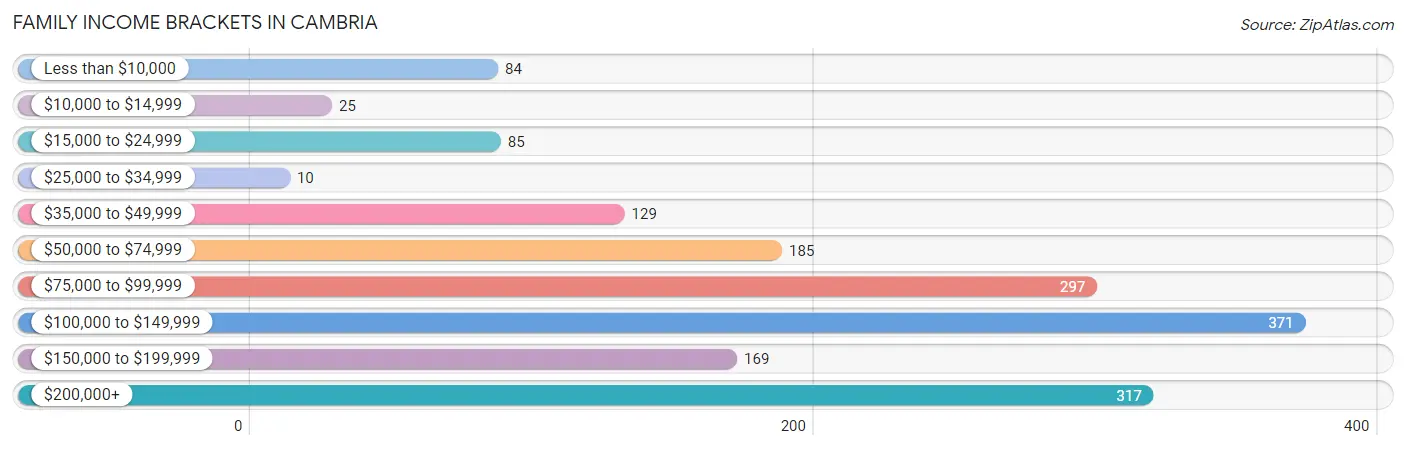
| Income Bracket | # Families | % Families |
| Less than $10,000 | 84 | 5.0% |
| $10,000 to $14,999 | 25 | 1.5% |
| $15,000 to $24,999 | 85 | 5.1% |
| $25,000 to $34,999 | 10 | 0.6% |
| $35,000 to $49,999 | 129 | 7.7% |
| $50,000 to $74,999 | 185 | 11.1% |
| $75,000 to $99,999 | 297 | 17.8% |
| $100,000 to $149,999 | 371 | 22.2% |
| $150,000 to $199,999 | 169 | 10.1% |
| $200,000+ | 317 | 19.0% |
Family Income by Famaliy Size in Cambria
4-person families (148 | 8.9%) account for the highest median family income in Cambria with $116,875 per family, while 2-person families (1,118 | 66.9%) have the highest median income of $50,156 per family member.
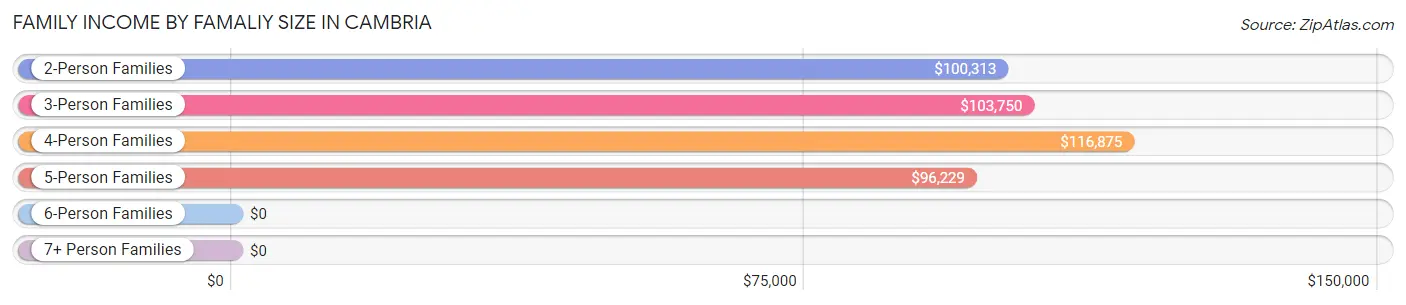
| Income Bracket | # Families | Median Income |
| 2-Person Families | 1,118 (66.9%) | $100,313 |
| 3-Person Families | 265 (15.9%) | $103,750 |
| 4-Person Families | 148 (8.9%) | $116,875 |
| 5-Person Families | 112 (6.7%) | $96,229 |
| 6-Person Families | 6 (0.4%) | $0 |
| 7+ Person Families | 21 (1.3%) | $0 |
| Total | 1,670 (100.0%) | $103,583 |
Family Income by Number of Earners in Cambria
The median family income in Cambria is $103,583, with families comprising 3+ earners (94) having the highest median family income of $138,750, while families with no earners (445) have the lowest median family income of $86,012, accounting for 5.6% and 26.7% of families, respectively.
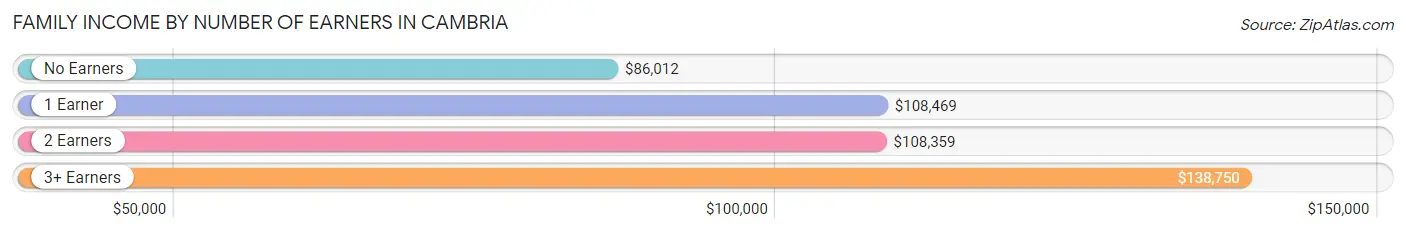
| Number of Earners | # Families | Median Income |
| No Earners | 445 (26.7%) | $86,012 |
| 1 Earner | 459 (27.5%) | $108,469 |
| 2 Earners | 672 (40.2%) | $108,359 |
| 3+ Earners | 94 (5.6%) | $138,750 |
| Total | 1,670 (100.0%) | $103,583 |
Household Income in Cambria
Household Income Brackets in Cambria
With 572 households falling in the category, the $100,000 to $149,999 income range is the most frequent in Cambria, accounting for 20.4% of all households. In contrast, only 76 households (2.7%) fall into the $10,000 to $14,999 income bracket, making it the least populous group.
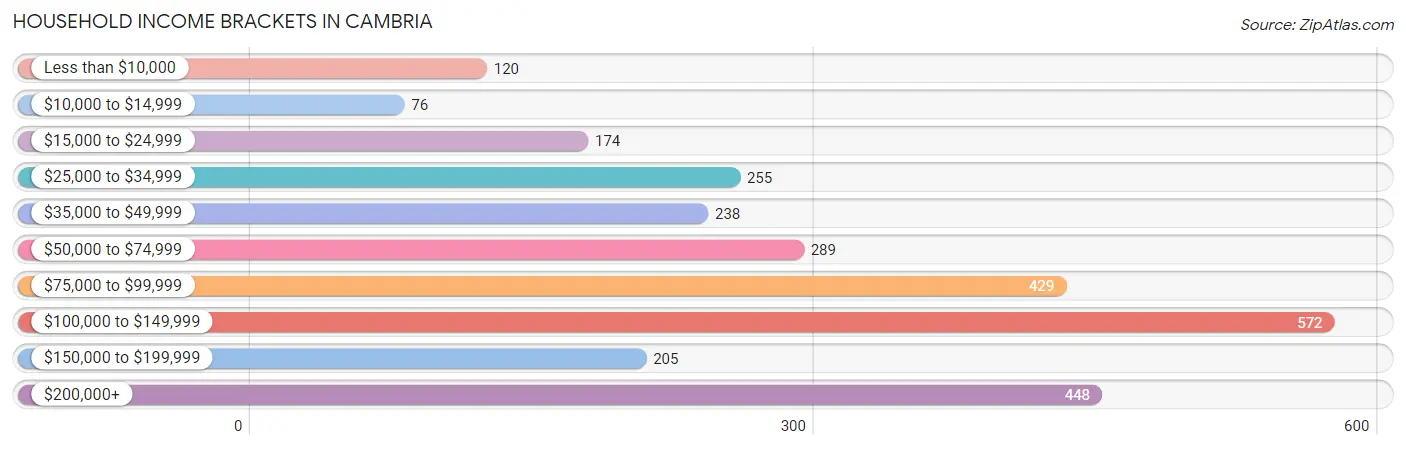
| Income Bracket | # Households | % Households |
| Less than $10,000 | 120 | 4.3% |
| $10,000 to $14,999 | 76 | 2.7% |
| $15,000 to $24,999 | 174 | 6.2% |
| $25,000 to $34,999 | 255 | 9.1% |
| $35,000 to $49,999 | 238 | 8.5% |
| $50,000 to $74,999 | 289 | 10.3% |
| $75,000 to $99,999 | 429 | 15.3% |
| $100,000 to $149,999 | 572 | 20.4% |
| $150,000 to $199,999 | 205 | 7.3% |
| $200,000+ | 448 | 16.0% |
Household Income by Householder Age in Cambria
The median household income in Cambria is $95,460, with the highest median household income of $111,250 found in the 45 to 64 years age bracket for the primary householder. A total of 845 households (30.2%) fall into this category. Meanwhile, the 15 to 24 years age bracket for the primary householder has the lowest median household income of $0, with 31 households (1.1%) in this group.
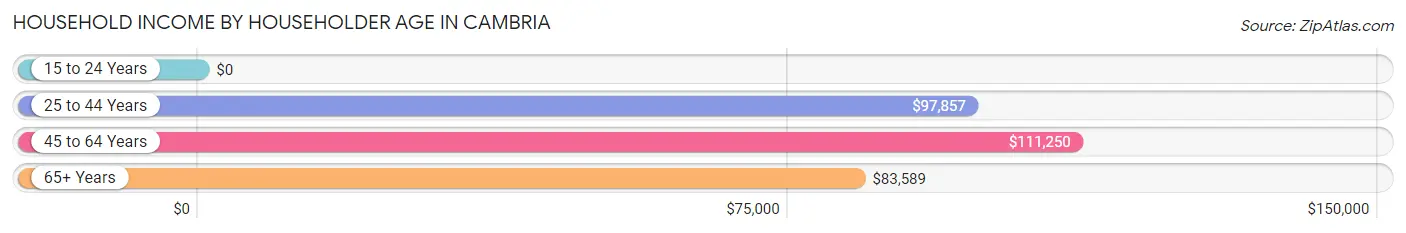
| Income Bracket | # Households | Median Income |
| 15 to 24 Years | 31 (1.1%) | $0 |
| 25 to 44 Years | 300 (10.7%) | $97,857 |
| 45 to 64 Years | 845 (30.2%) | $111,250 |
| 65+ Years | 1,626 (58.0%) | $83,589 |
| Total | 2,802 (100.0%) | $95,460 |
Poverty in Cambria
Income Below Poverty by Sex and Age in Cambria
With 10.0% poverty level for males and 7.2% for females among the residents of Cambria, 5 year old males and 25 to 34 year old females are the most vulnerable to poverty, with 28 males (43.1%) and 17 females (14.3%) in their respective age groups living below the poverty level.
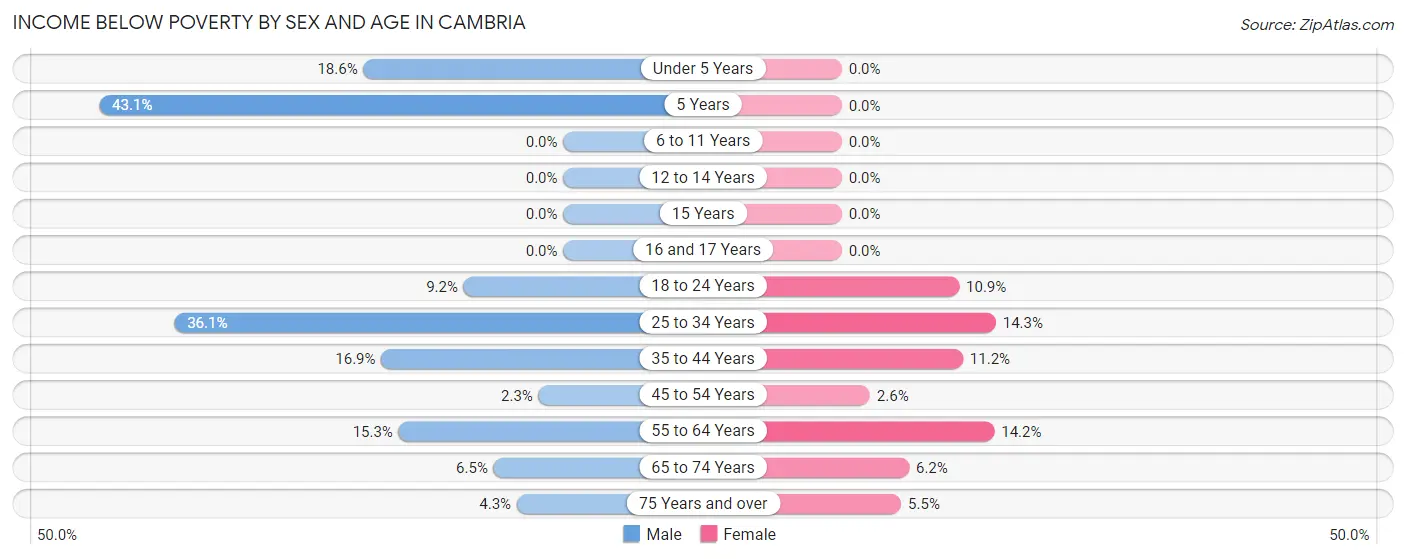
| Age Bracket | Male | Female |
| Under 5 Years | 23 (18.5%) | 0 (0.0%) |
| 5 Years | 28 (43.1%) | 0 (0.0%) |
| 6 to 11 Years | 0 (0.0%) | 0 (0.0%) |
| 12 to 14 Years | 0 (0.0%) | 0 (0.0%) |
| 15 Years | 0 (0.0%) | 0 (0.0%) |
| 16 and 17 Years | 0 (0.0%) | 0 (0.0%) |
| 18 to 24 Years | 11 (9.2%) | 11 (10.9%) |
| 25 to 34 Years | 26 (36.1%) | 17 (14.3%) |
| 35 to 44 Years | 38 (16.9%) | 30 (11.2%) |
| 45 to 54 Years | 8 (2.3%) | 8 (2.6%) |
| 55 to 64 Years | 90 (15.3%) | 72 (14.1%) |
| 65 to 74 Years | 43 (6.5%) | 48 (6.2%) |
| 75 Years and over | 18 (4.3%) | 28 (5.5%) |
| Total | 285 (10.0%) | 214 (7.2%) |
Income Above Poverty by Sex and Age in Cambria
According to the poverty statistics in Cambria, males aged 6 to 11 years and females aged under 5 years are the age groups that are most secure financially, with 100.0% of males and 100.0% of females in these age groups living above the poverty line.
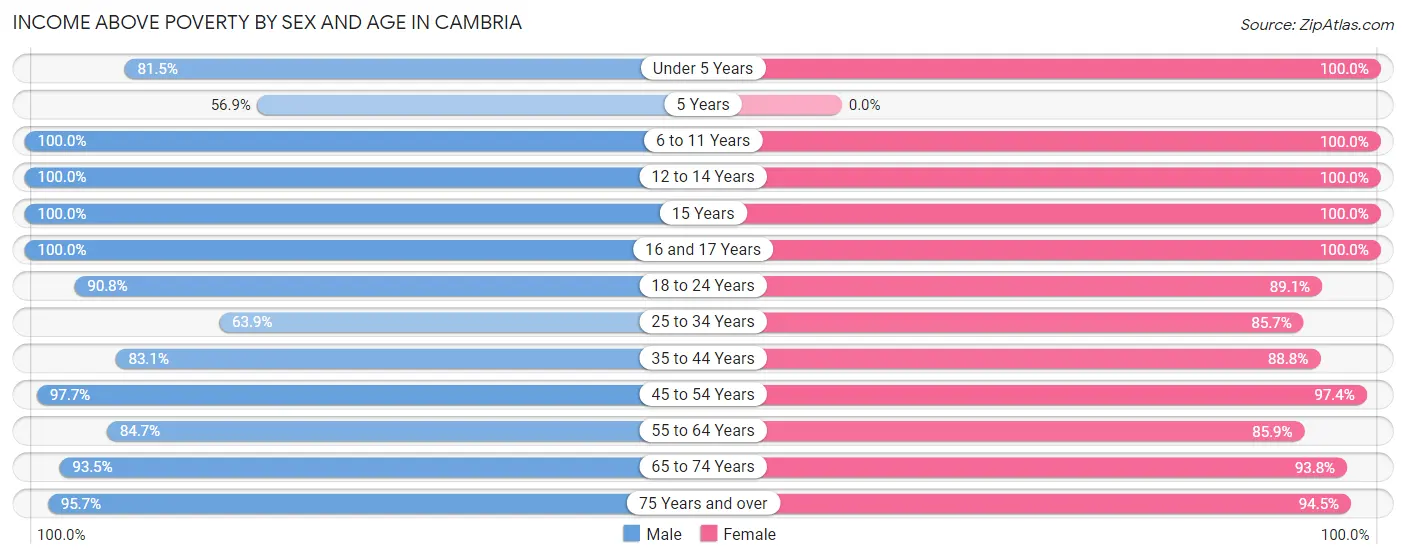
| Age Bracket | Male | Female |
| Under 5 Years | 101 (81.5%) | 93 (100.0%) |
| 5 Years | 37 (56.9%) | 0 (0.0%) |
| 6 to 11 Years | 43 (100.0%) | 92 (100.0%) |
| 12 to 14 Years | 131 (100.0%) | 116 (100.0%) |
| 15 Years | 11 (100.0%) | 19 (100.0%) |
| 16 and 17 Years | 37 (100.0%) | 75 (100.0%) |
| 18 to 24 Years | 108 (90.8%) | 90 (89.1%) |
| 25 to 34 Years | 46 (63.9%) | 102 (85.7%) |
| 35 to 44 Years | 187 (83.1%) | 237 (88.8%) |
| 45 to 54 Years | 342 (97.7%) | 298 (97.4%) |
| 55 to 64 Years | 499 (84.7%) | 437 (85.9%) |
| 65 to 74 Years | 623 (93.5%) | 721 (93.8%) |
| 75 Years and over | 400 (95.7%) | 480 (94.5%) |
| Total | 2,565 (90.0%) | 2,760 (92.8%) |
Income Below Poverty Among Married-Couple Families in Cambria
The poverty statistics for married-couple families in Cambria show that 7.6% or 116 of the total 1,519 families live below the poverty line. Families with 1 or 2 children have the highest poverty rate of 8.0%, comprising of 30 families. On the other hand, families with 3 or 4 children have the lowest poverty rate of 0.0%, which includes 0 families.
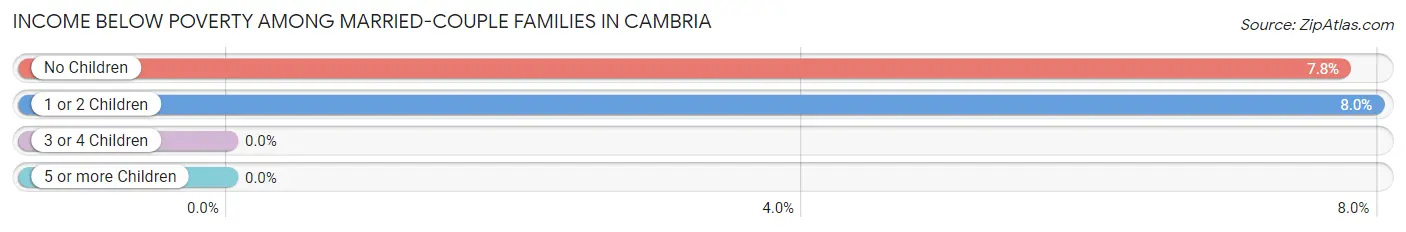
| Children | Above Poverty | Below Poverty |
| No Children | 1,023 (92.2%) | 86 (7.7%) |
| 1 or 2 Children | 346 (92.0%) | 30 (8.0%) |
| 3 or 4 Children | 34 (100.0%) | 0 (0.0%) |
| 5 or more Children | 0 (0.0%) | 0 (0.0%) |
| Total | 1,403 (92.4%) | 116 (7.6%) |
Income Below Poverty Among Single-Parent Households in Cambria
According to the poverty data in Cambria, 23.9% or 11 single-father households and 25.7% or 27 single-mother households are living below the poverty line. Among single-father households, those with no children have the highest poverty rate, with 11 households (73.3%) experiencing poverty. Likewise, among single-mother households, those with 1 or 2 children have the highest poverty rate, with 17 households (51.5%) falling below the poverty line.
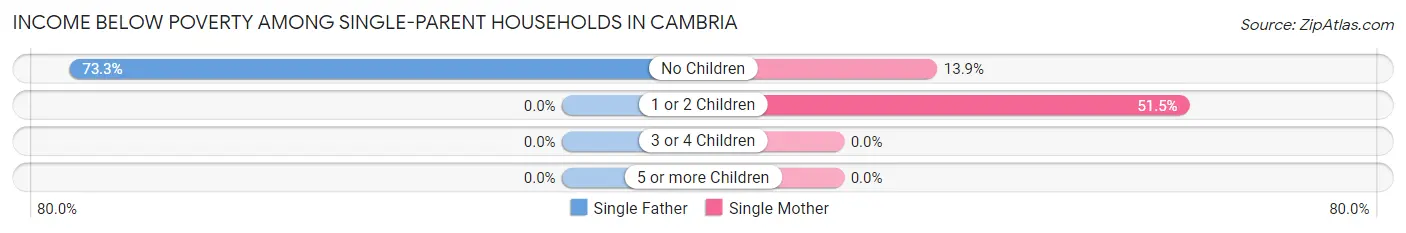
| Children | Single Father | Single Mother |
| No Children | 11 (73.3%) | 10 (13.9%) |
| 1 or 2 Children | 0 (0.0%) | 17 (51.5%) |
| 3 or 4 Children | 0 (0.0%) | 0 (0.0%) |
| 5 or more Children | 0 (0.0%) | 0 (0.0%) |
| Total | 11 (23.9%) | 27 (25.7%) |
Income Below Poverty Among Married-Couple vs Single-Parent Households in Cambria
The poverty data for Cambria shows that 116 of the married-couple family households (7.6%) and 38 of the single-parent households (25.2%) are living below the poverty level. Within the married-couple family households, those with 1 or 2 children have the highest poverty rate, with 30 households (8.0%) falling below the poverty line. Among the single-parent households, those with 1 or 2 children have the highest poverty rate, with 17 household (26.6%) living below poverty.
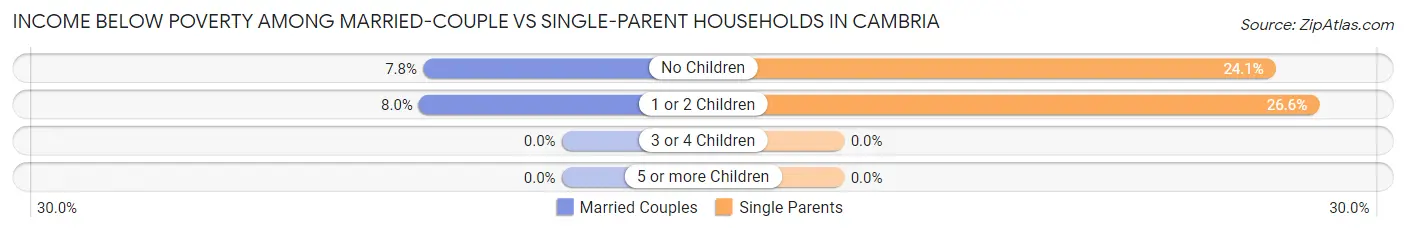
| Children | Married-Couple Families | Single-Parent Households |
| No Children | 86 (7.7%) | 21 (24.1%) |
| 1 or 2 Children | 30 (8.0%) | 17 (26.6%) |
| 3 or 4 Children | 0 (0.0%) | 0 (0.0%) |
| 5 or more Children | 0 (0.0%) | 0 (0.0%) |
| Total | 116 (7.6%) | 38 (25.2%) |
Race in Cambria
The most populous races in Cambria are White / Caucasian (4,648 | 79.8%), Hispanic or Latino (1,597 | 27.4%), and Two or more Races (954 | 16.4%).
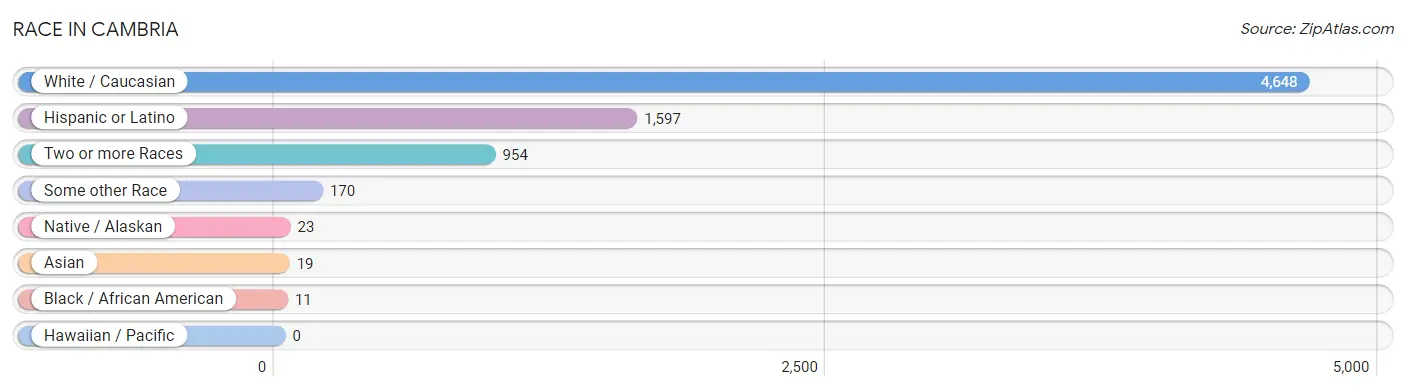
| Race | # Population | % Population |
| Asian | 19 | 0.3% |
| Black / African American | 11 | 0.2% |
| Hawaiian / Pacific | 0 | 0.0% |
| Hispanic or Latino | 1,597 | 27.4% |
| Native / Alaskan | 23 | 0.4% |
| White / Caucasian | 4,648 | 79.8% |
| Two or more Races | 954 | 16.4% |
| Some other Race | 170 | 2.9% |
| Total | 5,825 | 100.0% |
Ancestry in Cambria
The most populous ancestries reported in Cambria are Mexican (1,447 | 24.8%), English (1,020 | 17.5%), German (864 | 14.8%), Irish (666 | 11.4%), and Italian (288 | 4.9%), together accounting for 73.5% of all Cambria residents.
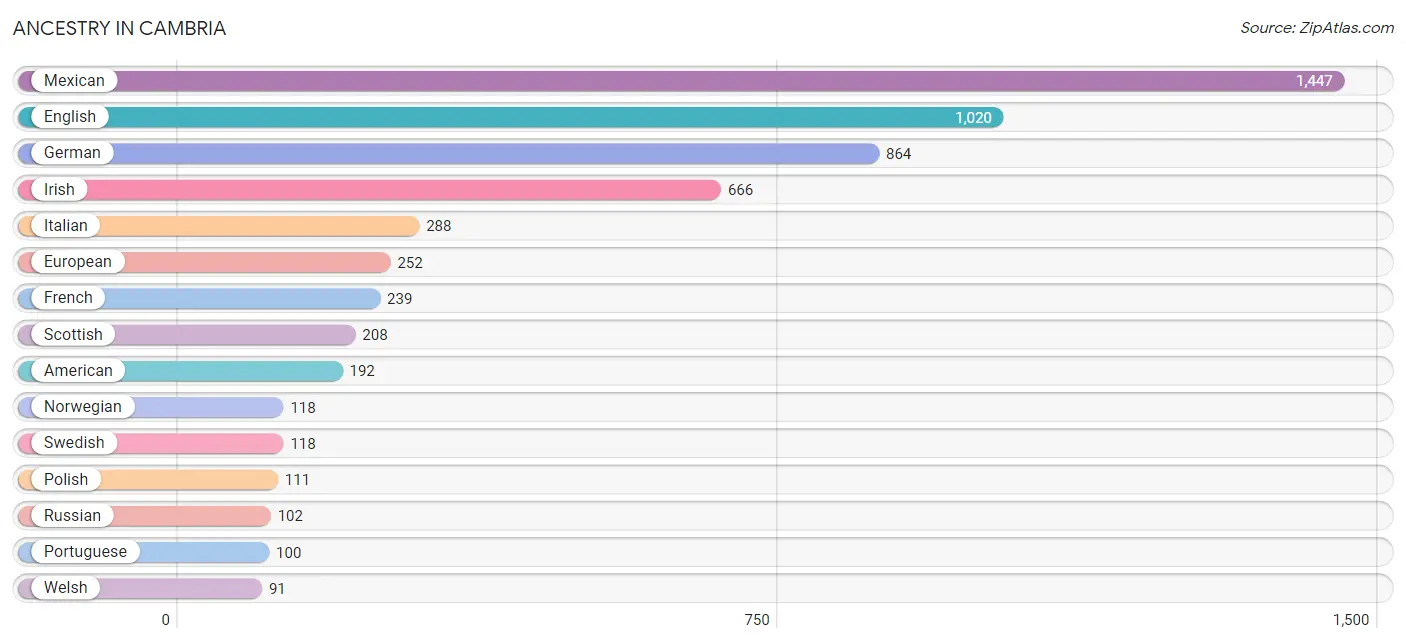
| Ancestry | # Population | % Population |
| American | 192 | 3.3% |
| Arab | 13 | 0.2% |
| Argentinean | 6 | 0.1% |
| Armenian | 21 | 0.4% |
| Austrian | 2 | 0.0% |
| Basque | 18 | 0.3% |
| Belgian | 32 | 0.5% |
| Bhutanese | 12 | 0.2% |
| British | 83 | 1.4% |
| Burmese | 6 | 0.1% |
| Canadian | 30 | 0.5% |
| Central American | 29 | 0.5% |
| Cherokee | 12 | 0.2% |
| Colombian | 21 | 0.4% |
| Costa Rican | 24 | 0.4% |
| Cree | 2 | 0.0% |
| Croatian | 14 | 0.2% |
| Czechoslovakian | 14 | 0.2% |
| Danish | 44 | 0.8% |
| Dutch | 31 | 0.5% |
| Eastern European | 27 | 0.5% |
| Egyptian | 4 | 0.1% |
| English | 1,020 | 17.5% |
| Estonian | 8 | 0.1% |
| European | 252 | 4.3% |
| Finnish | 9 | 0.2% |
| French | 239 | 4.1% |
| French Canadian | 8 | 0.1% |
| German | 864 | 14.8% |
| Greek | 9 | 0.2% |
| Hungarian | 15 | 0.3% |
| Indian (Asian) | 5 | 0.1% |
| Iranian | 6 | 0.1% |
| Irish | 666 | 11.4% |
| Israeli | 9 | 0.2% |
| Italian | 288 | 4.9% |
| Japanese | 1 | 0.0% |
| Korean | 9 | 0.2% |
| Lebanese | 9 | 0.2% |
| Lithuanian | 7 | 0.1% |
| Mexican | 1,447 | 24.8% |
| Mexican American Indian | 6 | 0.1% |
| Northern European | 10 | 0.2% |
| Norwegian | 118 | 2.0% |
| Polish | 111 | 1.9% |
| Portuguese | 100 | 1.7% |
| Russian | 102 | 1.8% |
| Salvadoran | 5 | 0.1% |
| Scandinavian | 9 | 0.2% |
| Scotch-Irish | 44 | 0.8% |
| Scottish | 208 | 3.6% |
| Serbian | 12 | 0.2% |
| Sioux | 12 | 0.2% |
| Slavic | 5 | 0.1% |
| South African | 28 | 0.5% |
| South American | 27 | 0.5% |
| Spaniard | 15 | 0.3% |
| Spanish | 63 | 1.1% |
| Sri Lankan | 1 | 0.0% |
| Subsaharan African | 28 | 0.5% |
| Swedish | 118 | 2.0% |
| Swiss | 11 | 0.2% |
| Thai | 17 | 0.3% |
| Ukrainian | 15 | 0.3% |
| Welsh | 91 | 1.6% | View All 65 Rows |
Immigrants in Cambria
The most numerous immigrant groups reported in Cambria came from Latin America (442 | 7.6%), Central America (430 | 7.4%), Mexico (401 | 6.9%), Canada (97 | 1.7%), and Europe (67 | 1.1%), together accounting for 24.7% of all Cambria residents.
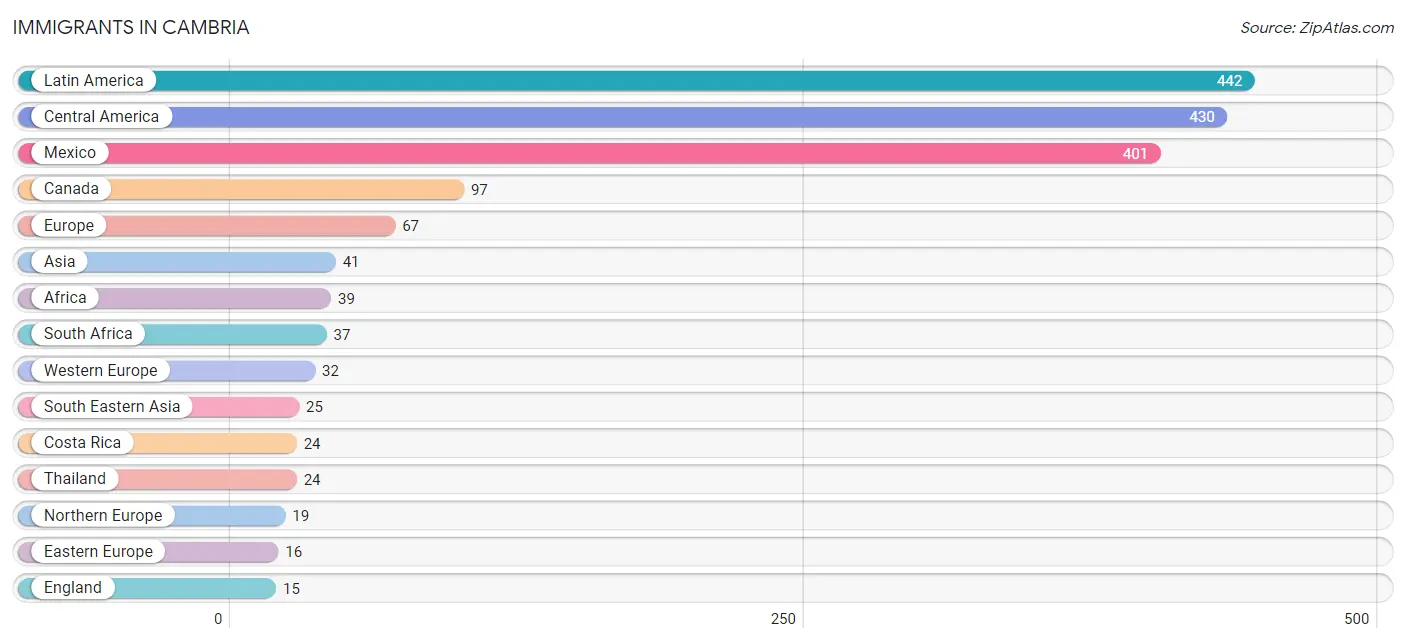
| Immigration Origin | # Population | % Population |
| Africa | 39 | 0.7% |
| Argentina | 6 | 0.1% |
| Asia | 41 | 0.7% |
| Australia | 7 | 0.1% |
| Austria | 4 | 0.1% |
| Brazil | 6 | 0.1% |
| Canada | 97 | 1.7% |
| Central America | 430 | 7.4% |
| China | 4 | 0.1% |
| Costa Rica | 24 | 0.4% |
| Eastern Asia | 7 | 0.1% |
| Eastern Europe | 16 | 0.3% |
| Egypt | 2 | 0.0% |
| El Salvador | 5 | 0.1% |
| England | 15 | 0.3% |
| Europe | 67 | 1.1% |
| Germany | 15 | 0.3% |
| Iran | 6 | 0.1% |
| Japan | 3 | 0.1% |
| Latin America | 442 | 7.6% |
| Lebanon | 3 | 0.1% |
| Lithuania | 8 | 0.1% |
| Mexico | 401 | 6.9% |
| Netherlands | 13 | 0.2% |
| Northern Africa | 2 | 0.0% |
| Northern Europe | 19 | 0.3% |
| Oceania | 10 | 0.2% |
| Scotland | 4 | 0.1% |
| South Africa | 37 | 0.6% |
| South America | 12 | 0.2% |
| South Central Asia | 6 | 0.1% |
| South Eastern Asia | 25 | 0.4% |
| Thailand | 24 | 0.4% |
| Vietnam | 1 | 0.0% |
| Western Asia | 3 | 0.1% |
| Western Europe | 32 | 0.5% | View All 36 Rows |
Sex and Age in Cambria
Sex and Age in Cambria
The most populous age groups in Cambria are 65 to 69 Years (368 | 12.9%) for men and 65 to 69 Years (475 | 16.0%) for women.
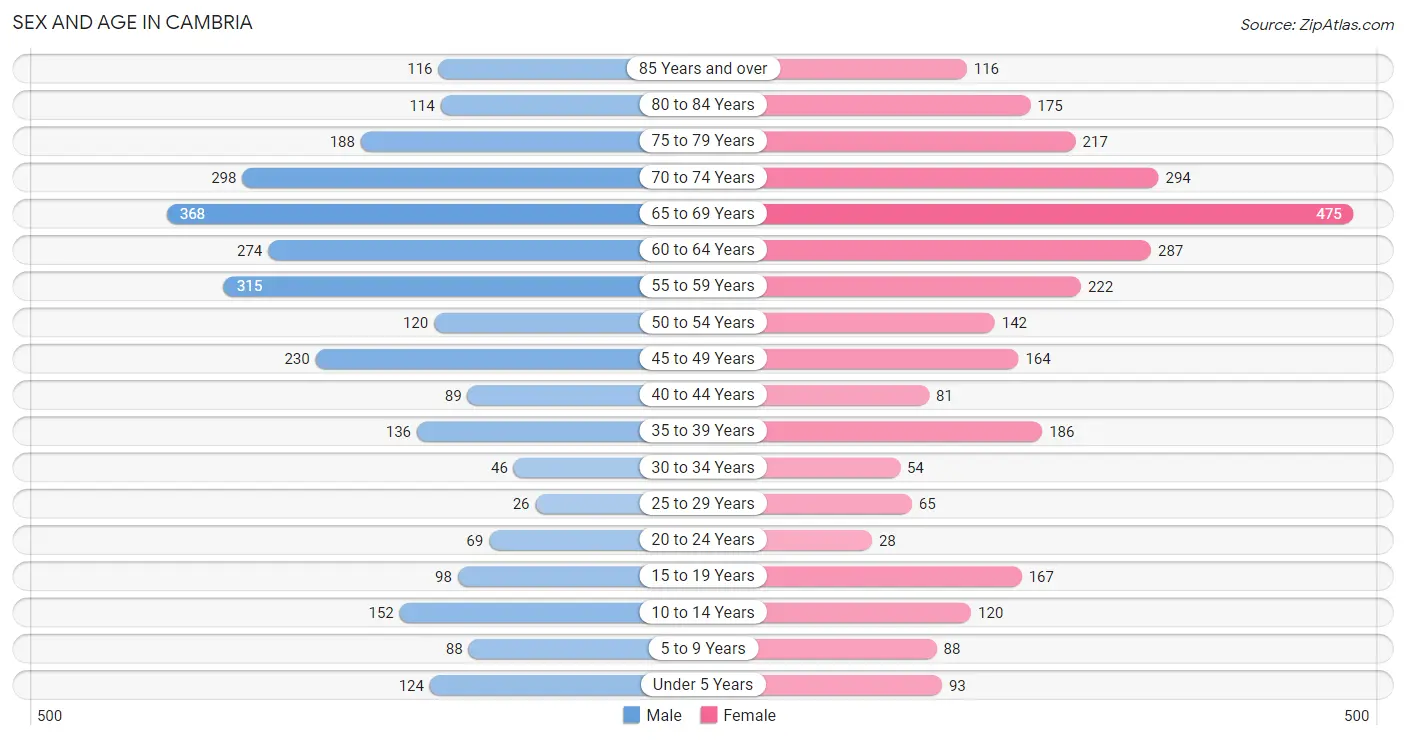
| Age Bracket | Male | Female |
| Under 5 Years | 124 (4.3%) | 93 (3.1%) |
| 5 to 9 Years | 88 (3.1%) | 88 (3.0%) |
| 10 to 14 Years | 152 (5.3%) | 120 (4.0%) |
| 15 to 19 Years | 98 (3.4%) | 167 (5.6%) |
| 20 to 24 Years | 69 (2.4%) | 28 (0.9%) |
| 25 to 29 Years | 26 (0.9%) | 65 (2.2%) |
| 30 to 34 Years | 46 (1.6%) | 54 (1.8%) |
| 35 to 39 Years | 136 (4.8%) | 186 (6.2%) |
| 40 to 44 Years | 89 (3.1%) | 81 (2.7%) |
| 45 to 49 Years | 230 (8.1%) | 164 (5.5%) |
| 50 to 54 Years | 120 (4.2%) | 142 (4.8%) |
| 55 to 59 Years | 315 (11.1%) | 222 (7.5%) |
| 60 to 64 Years | 274 (9.6%) | 287 (9.7%) |
| 65 to 69 Years | 368 (12.9%) | 475 (16.0%) |
| 70 to 74 Years | 298 (10.4%) | 294 (9.9%) |
| 75 to 79 Years | 188 (6.6%) | 217 (7.3%) |
| 80 to 84 Years | 114 (4.0%) | 175 (5.9%) |
| 85 Years and over | 116 (4.1%) | 116 (3.9%) |
| Total | 2,851 (100.0%) | 2,974 (100.0%) |
Families and Households in Cambria
Median Family Size in Cambria
The median family size in Cambria is 2.66 persons per family, with single male/father families (46 | 2.8%) accounting for the largest median family size of 3.61 persons per family. On the other hand, single female/mother families (105 | 6.3%) represent the smallest median family size with 2.26 persons per family.
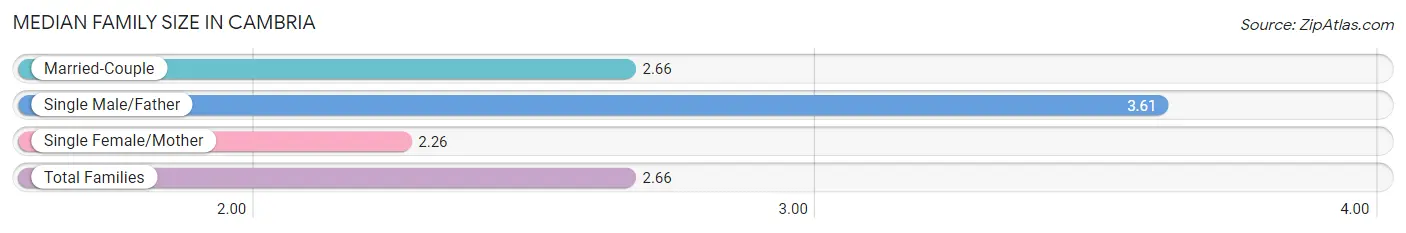
| Family Type | # Families | Family Size |
| Married-Couple | 1,519 (91.0%) | 2.66 |
| Single Male/Father | 46 (2.8%) | 3.61 |
| Single Female/Mother | 105 (6.3%) | 2.26 |
| Total Families | 1,670 (100.0%) | 2.66 |
Median Household Size in Cambria
The median household size in Cambria is 2.08 persons per household, with single male/father households (46 | 1.6%) accounting for the largest median household size of 4.46 persons per household. non-family households (1,132 | 40.4%) represent the smallest median household size with 1.16 persons per household.
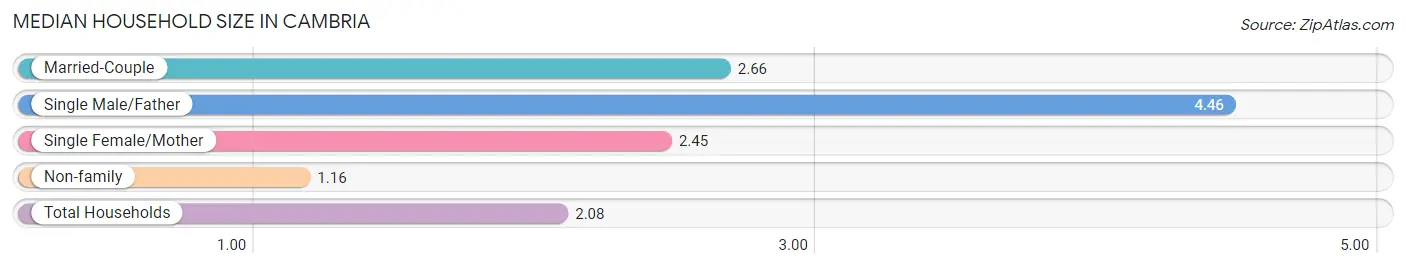
| Household Type | # Households | Household Size |
| Married-Couple | 1,519 (54.2%) | 2.66 |
| Single Male/Father | 46 (1.6%) | 4.46 |
| Single Female/Mother | 105 (3.7%) | 2.45 |
| Non-family | 1,132 (40.4%) | 1.16 |
| Total Households | 2,802 (100.0%) | 2.08 |
Household Size by Marriage Status in Cambria
Out of a total of 2,802 households in Cambria, 1,670 (59.6%) are family households, while 1,132 (40.4%) are nonfamily households. The most numerous type of family households are 2-person households, comprising 1,099, and the most common type of nonfamily households are 1-person households, comprising 983.
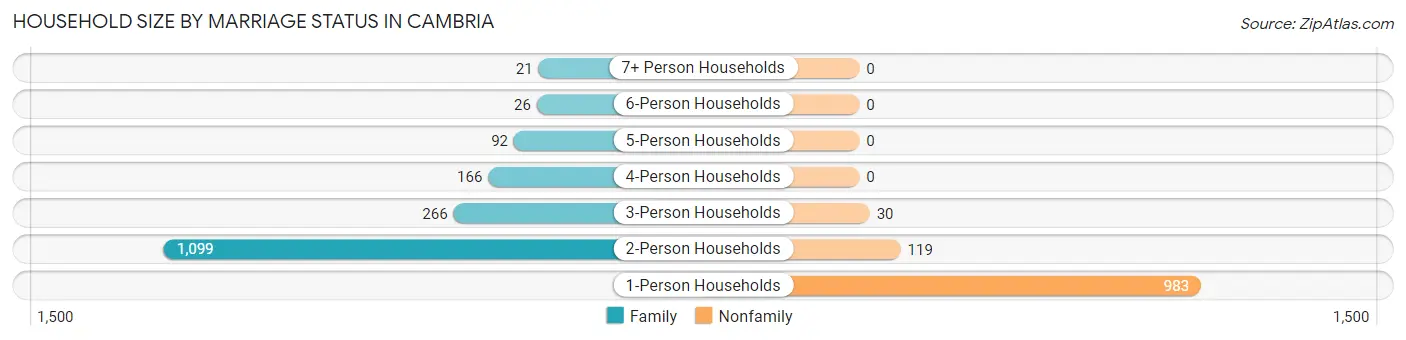
| Household Size | Family Households | Nonfamily Households |
| 1-Person Households | - | 983 (35.1%) |
| 2-Person Households | 1,099 (39.2%) | 119 (4.3%) |
| 3-Person Households | 266 (9.5%) | 30 (1.1%) |
| 4-Person Households | 166 (5.9%) | 0 (0.0%) |
| 5-Person Households | 92 (3.3%) | 0 (0.0%) |
| 6-Person Households | 26 (0.9%) | 0 (0.0%) |
| 7+ Person Households | 21 (0.7%) | 0 (0.0%) |
| Total | 1,670 (59.6%) | 1,132 (40.4%) |
Female Fertility in Cambria
Fertility by Age in Cambria
Average fertility rate in Cambria is 41.0 births per 1,000 women. Women in the age bracket of 20 to 34 years have the highest fertility rate with 211.0 births per 1,000 women. Women in the age bracket of 20 to 34 years acount for 100.0% of all women with births.
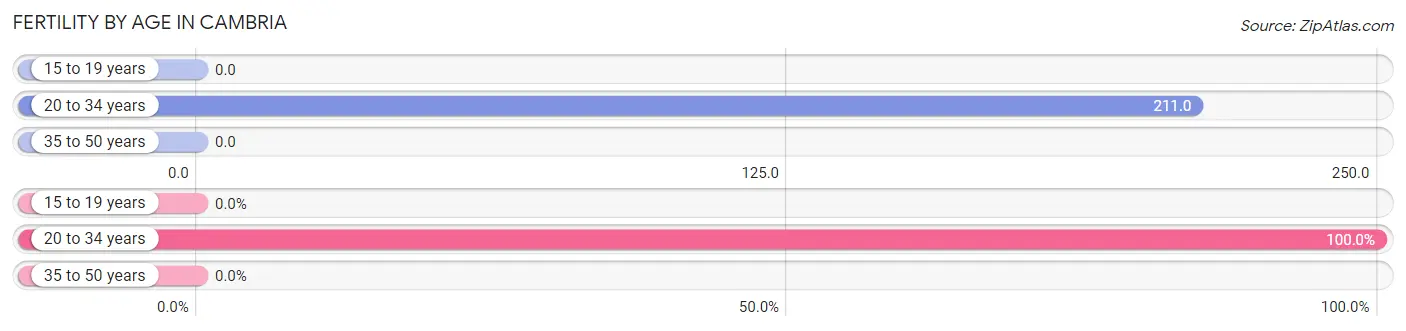
| Age Bracket | Women with Births | Births / 1,000 Women |
| 15 to 19 years | 0 (0.0%) | 0.0 |
| 20 to 34 years | 31 (100.0%) | 211.0 |
| 35 to 50 years | 0 (0.0%) | 0.0 |
| Total | 31 (100.0%) | 41.0 |
Fertility by Age by Marriage Status in Cambria
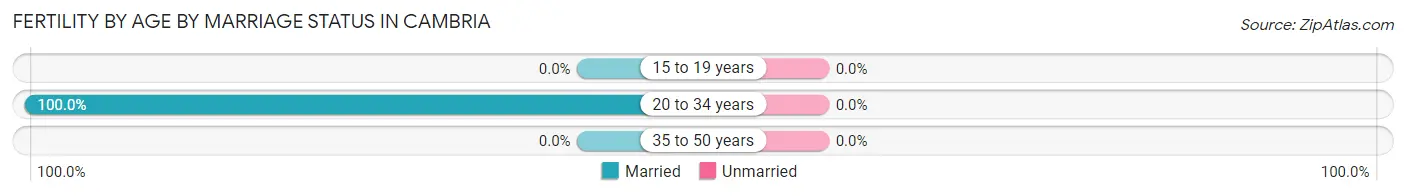
| Age Bracket | Married | Unmarried |
| 15 to 19 years | 0 (0.0%) | 0 (0.0%) |
| 20 to 34 years | 31 (100.0%) | 0 (0.0%) |
| 35 to 50 years | 0 (0.0%) | 0 (0.0%) |
| Total | 31 (100.0%) | 0 (0.0%) |
Fertility by Education in Cambria
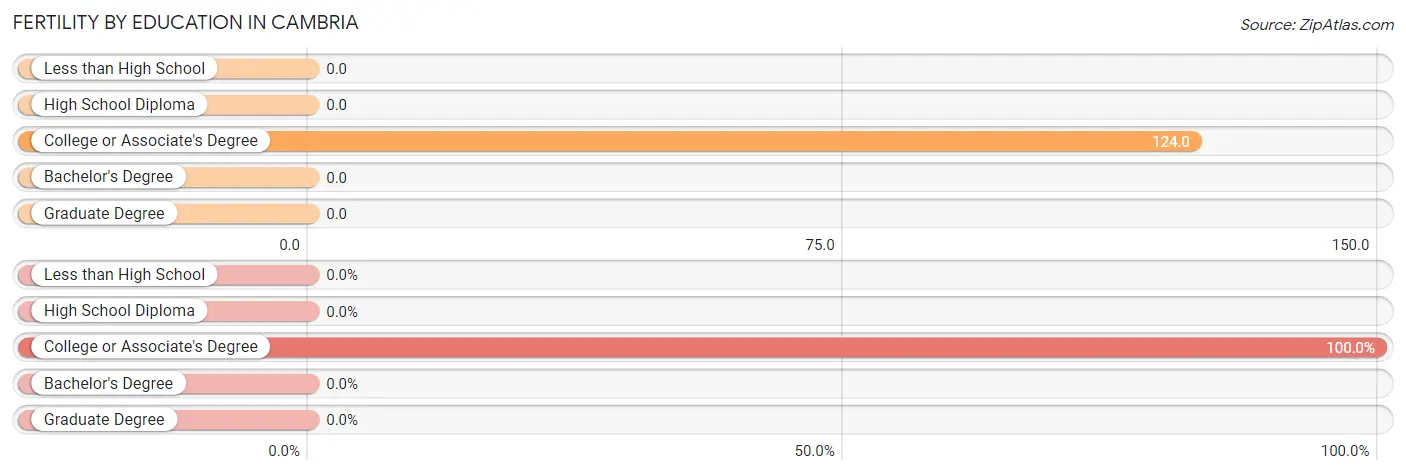
| Educational Attainment | Women with Births | Births / 1,000 Women |
| Less than High School | 0 (0.0%) | 0.0 |
| High School Diploma | 0 (0.0%) | 0.0 |
| College or Associate's Degree | 31 (100.0%) | 124.0 |
| Bachelor's Degree | 0 (0.0%) | 0.0 |
| Graduate Degree | 0 (0.0%) | 0.0 |
| Total | 31 (100.0%) | 41.0 |
Fertility by Education by Marriage Status in Cambria
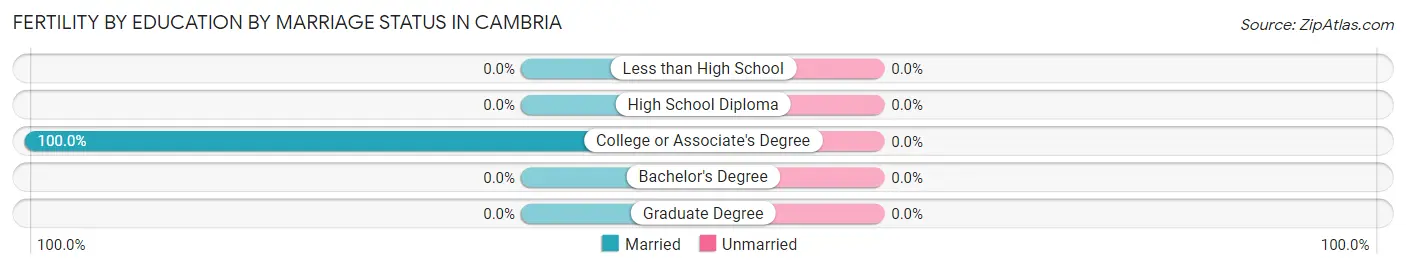
| Educational Attainment | Married | Unmarried |
| Less than High School | 0 (0.0%) | 0 (0.0%) |
| High School Diploma | 0 (0.0%) | 0 (0.0%) |
| College or Associate's Degree | 31 (100.0%) | 0 (0.0%) |
| Bachelor's Degree | 0 (0.0%) | 0 (0.0%) |
| Graduate Degree | 0 (0.0%) | 0 (0.0%) |
| Total | 31 (100.0%) | 0 (0.0%) |
Employment Characteristics in Cambria
Employment by Class of Employer in Cambria
Among the 2,279 employed individuals in Cambria, private company employees (1,269 | 55.7%), self-employed (not incorporated) (385 | 16.9%), and self-employed (incorporated) (161 | 7.1%) make up the most common classes of employment.
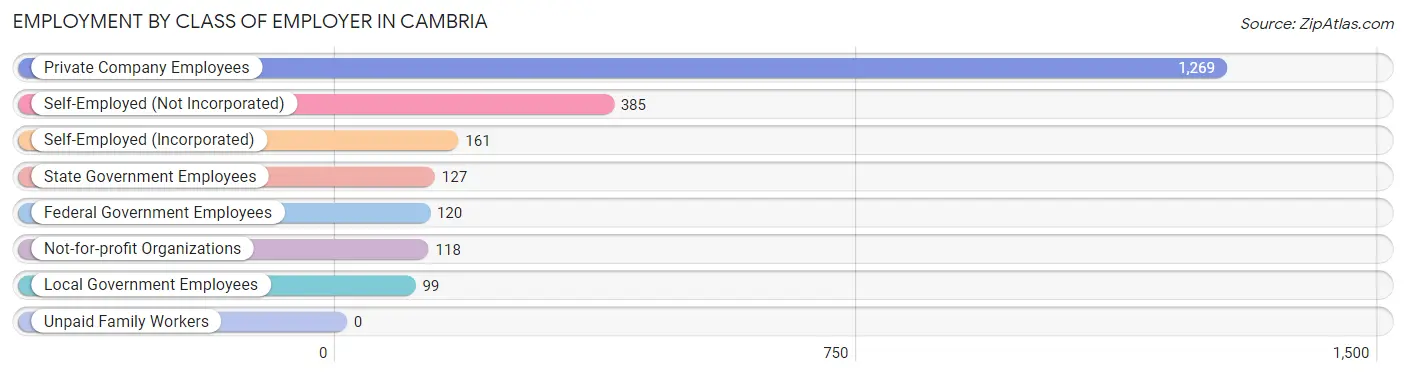
| Employer Class | # Employees | % Employees |
| Private Company Employees | 1,269 | 55.7% |
| Self-Employed (Incorporated) | 161 | 7.1% |
| Self-Employed (Not Incorporated) | 385 | 16.9% |
| Not-for-profit Organizations | 118 | 5.2% |
| Local Government Employees | 99 | 4.3% |
| State Government Employees | 127 | 5.6% |
| Federal Government Employees | 120 | 5.3% |
| Unpaid Family Workers | 0 | 0.0% |
| Total | 2,279 | 100.0% |
Employment Status by Age in Cambria
According to the labor force statistics for Cambria, out of the total population over 16 years of age (5,130), 48.6% or 2,493 individuals are in the labor force, with 6.4% or 160 of them unemployed. The age group with the highest labor force participation rate is 20 to 24 years, with 97.9% or 95 individuals in the labor force. Within the labor force, the 25 to 29 years age range has the highest percentage of unemployed individuals, with 30.6% or 26 of them being unemployed.
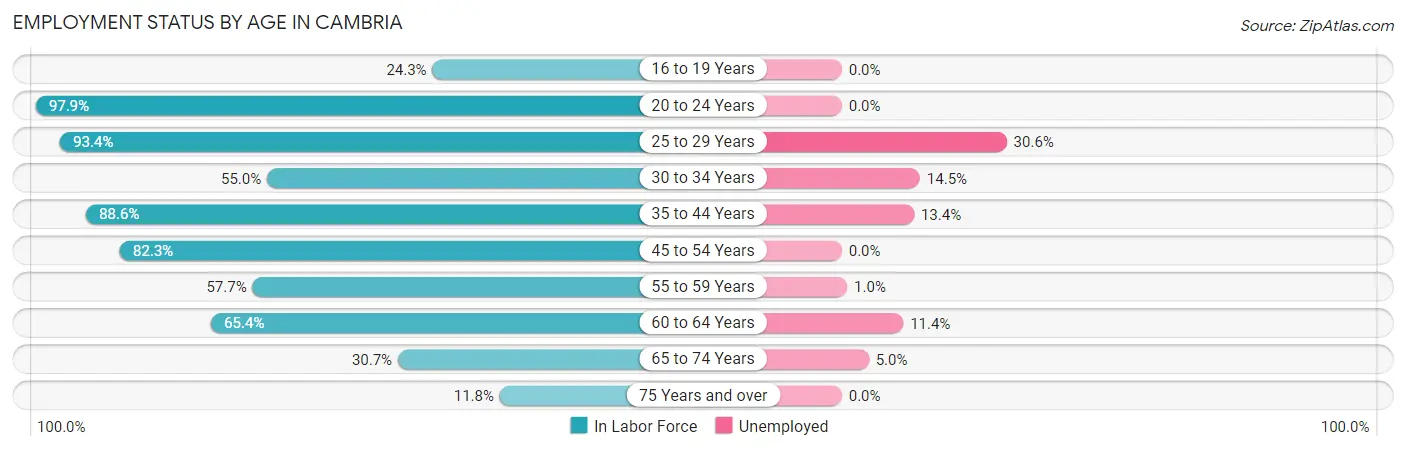
| Age Bracket | In Labor Force | Unemployed |
| 16 to 19 Years | 57 (24.3%) | 0 (0.0%) |
| 20 to 24 Years | 95 (97.9%) | 0 (0.0%) |
| 25 to 29 Years | 85 (93.4%) | 26 (30.6%) |
| 30 to 34 Years | 55 (55.0%) | 8 (14.5%) |
| 35 to 44 Years | 436 (88.6%) | 58 (13.4%) |
| 45 to 54 Years | 540 (82.3%) | 0 (0.0%) |
| 55 to 59 Years | 310 (57.7%) | 3 (1.0%) |
| 60 to 64 Years | 367 (65.4%) | 42 (11.4%) |
| 65 to 74 Years | 441 (30.7%) | 22 (5.0%) |
| 75 Years and over | 109 (11.8%) | 0 (0.0%) |
| Total | 2,493 (48.6%) | 160 (6.4%) |
Employment Status by Educational Attainment in Cambria
According to labor force statistics for Cambria, 73.6% of individuals (1,794) out of the total population between 25 and 64 years of age (2,437) are in the labor force, with 7.7% or 138 of them being unemployed. The group with the highest labor force participation rate are those with the educational attainment of less than high school, with 82.4% or 168 individuals in the labor force. Within the labor force, individuals with less than high school education have the highest percentage of unemployment, with 9.5% or 16 of them being unemployed.
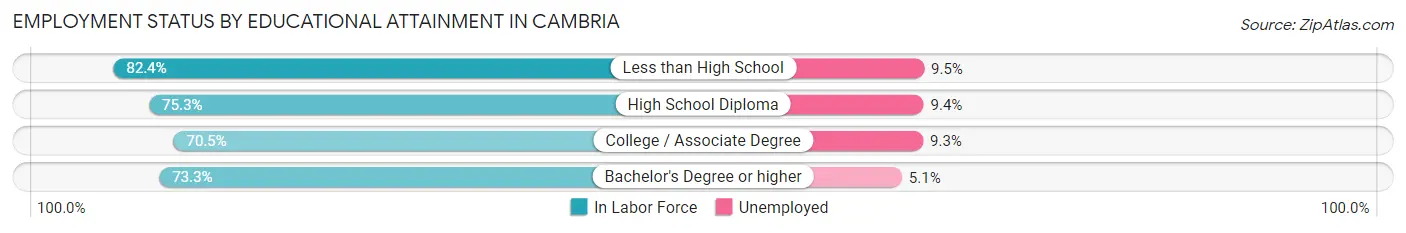
| Educational Attainment | In Labor Force | Unemployed |
| Less than High School | 168 (82.4%) | 19 (9.5%) |
| High School Diploma | 399 (75.3%) | 50 (9.4%) |
| College / Associate Degree | 558 (70.5%) | 74 (9.3%) |
| Bachelor's Degree or higher | 668 (73.3%) | 46 (5.1%) |
| Total | 1,794 (73.6%) | 188 (7.7%) |
Employment Occupations by Sex in Cambria
Management, Business, Science and Arts Occupations
The most common Management, Business, Science and Arts occupations in Cambria are Management (356 | 15.7%), Community & Social Service (304 | 13.4%), Health Diagnosing & Treating (182 | 8.0%), Computers, Engineering & Science (148 | 6.5%), and Health Technologists (142 | 6.3%).
Management, Business, Science and Arts Occupations by Sex
Within the Management, Business, Science and Arts occupations in Cambria, the most male-oriented occupations are Architecture & Engineering (100.0%), Life, Physical & Social Science (100.0%), and Computers, Engineering & Science (94.6%), while the most female-oriented occupations are Education, Arts & Media (100.0%), Business & Financial (88.6%), and Health Technologists (78.9%).
| Occupation | Male | Female |
| Management | 231 (64.9%) | 125 (35.1%) |
| Business & Financial | 10 (11.4%) | 78 (88.6%) |
| Computers, Engineering & Science | 140 (94.6%) | 8 (5.4%) |
| Computers & Mathematics | 42 (84.0%) | 8 (16.0%) |
| Architecture & Engineering | 43 (100.0%) | 0 (0.0%) |
| Life, Physical & Social Science | 55 (100.0%) | 0 (0.0%) |
| Community & Social Service | 120 (39.5%) | 184 (60.5%) |
| Education, Arts & Media | 0 (0.0%) | 27 (100.0%) |
| Legal Services & Support | 9 (33.3%) | 18 (66.7%) |
| Education Instruction & Library | 35 (29.2%) | 85 (70.8%) |
| Arts, Media & Entertainment | 76 (58.5%) | 54 (41.5%) |
| Health Diagnosing & Treating | 49 (26.9%) | 133 (73.1%) |
| Health Technologists | 30 (21.1%) | 112 (78.9%) |
| Total (Category) | 550 (51.0%) | 528 (49.0%) |
| Total (Overall) | 1,216 (53.6%) | 1,054 (46.4%) |
Services Occupations
The most common Services occupations in Cambria are Food Preparation & Serving (241 | 10.6%), Cleaning & Maintenance (175 | 7.7%), Personal Care & Service (79 | 3.5%), Security & Protection (27 | 1.2%), and Firefighting & Prevention (27 | 1.2%).
Services Occupations by Sex
Within the Services occupations in Cambria, the most male-oriented occupations are Security & Protection (92.6%), Firefighting & Prevention (92.6%), and Cleaning & Maintenance (86.3%), while the most female-oriented occupations are Personal Care & Service (87.3%), Healthcare Support (35.7%), and Food Preparation & Serving (35.3%).
| Occupation | Male | Female |
| Healthcare Support | 9 (64.3%) | 5 (35.7%) |
| Security & Protection | 25 (92.6%) | 2 (7.4%) |
| Firefighting & Prevention | 25 (92.6%) | 2 (7.4%) |
| Law Enforcement | 0 (0.0%) | 0 (0.0%) |
| Food Preparation & Serving | 156 (64.7%) | 85 (35.3%) |
| Cleaning & Maintenance | 151 (86.3%) | 24 (13.7%) |
| Personal Care & Service | 10 (12.7%) | 69 (87.3%) |
| Total (Category) | 351 (65.5%) | 185 (34.5%) |
| Total (Overall) | 1,216 (53.6%) | 1,054 (46.4%) |
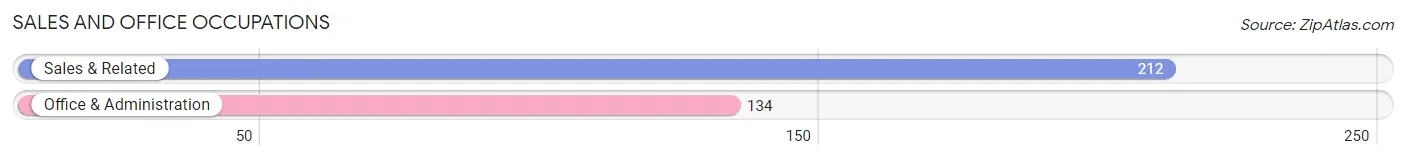
Sales and Office Occupations
The most common Sales and Office occupations in Cambria are Sales & Related (212 | 9.3%), and Office & Administration (134 | 5.9%).
Sales and Office Occupations by Sex
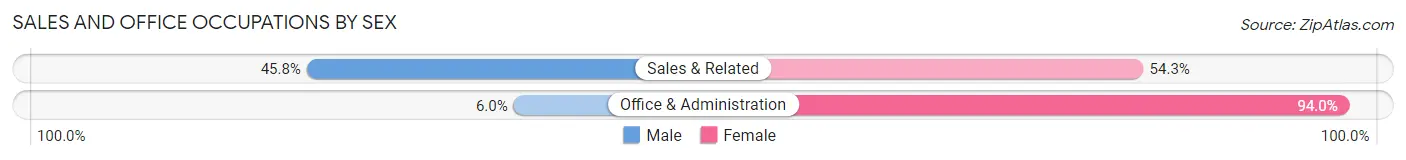
| Occupation | Male | Female |
| Sales & Related | 97 (45.8%) | 115 (54.2%) |
| Office & Administration | 8 (6.0%) | 126 (94.0%) |
| Total (Category) | 105 (30.3%) | 241 (69.7%) |
| Total (Overall) | 1,216 (53.6%) | 1,054 (46.4%) |
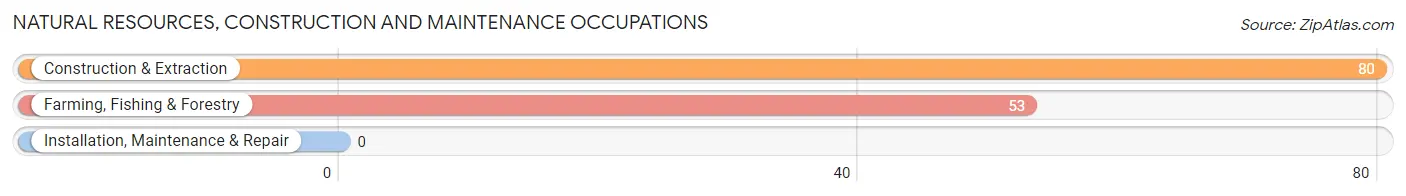
Natural Resources, Construction and Maintenance Occupations
The most common Natural Resources, Construction and Maintenance occupations in Cambria are Construction & Extraction (80 | 3.5%), and Farming, Fishing & Forestry (53 | 2.3%).
Natural Resources, Construction and Maintenance Occupations by Sex
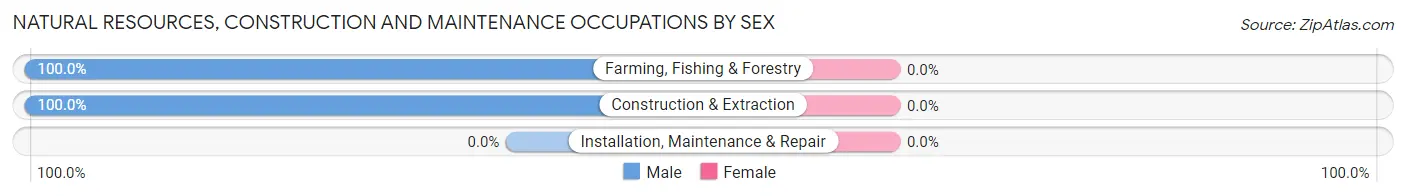
| Occupation | Male | Female |
| Farming, Fishing & Forestry | 53 (100.0%) | 0 (0.0%) |
| Construction & Extraction | 80 (100.0%) | 0 (0.0%) |
| Installation, Maintenance & Repair | 0 (0.0%) | 0 (0.0%) |
| Total (Category) | 133 (100.0%) | 0 (0.0%) |
| Total (Overall) | 1,216 (53.6%) | 1,054 (46.4%) |
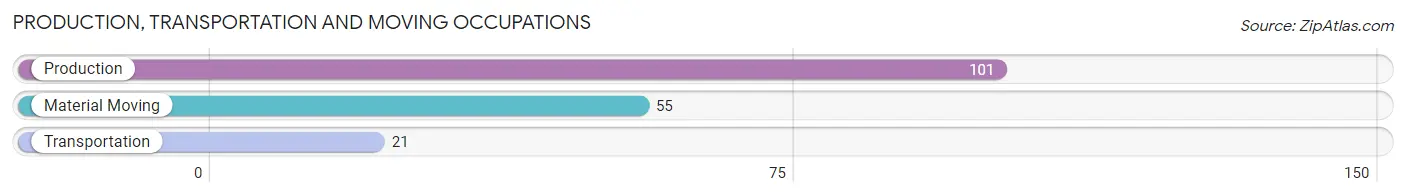
Production, Transportation and Moving Occupations
The most common Production, Transportation and Moving occupations in Cambria are Production (101 | 4.4%), Material Moving (55 | 2.4%), and Transportation (21 | 0.9%).
Production, Transportation and Moving Occupations by Sex
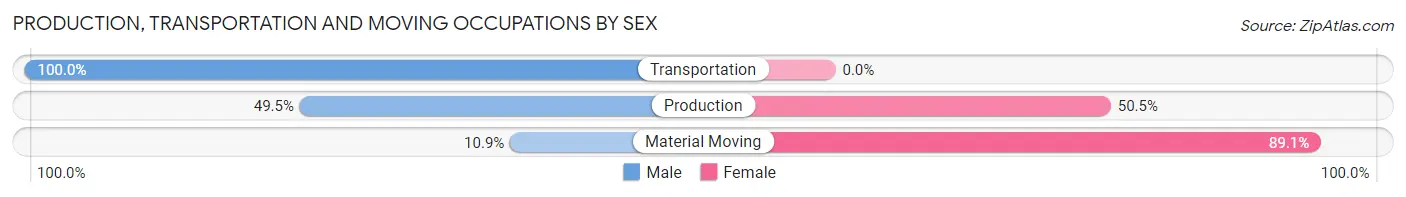
| Occupation | Male | Female |
| Production | 50 (49.5%) | 51 (50.5%) |
| Transportation | 21 (100.0%) | 0 (0.0%) |
| Material Moving | 6 (10.9%) | 49 (89.1%) |
| Total (Category) | 77 (43.5%) | 100 (56.5%) |
| Total (Overall) | 1,216 (53.6%) | 1,054 (46.4%) |
Employment Industries by Sex in Cambria
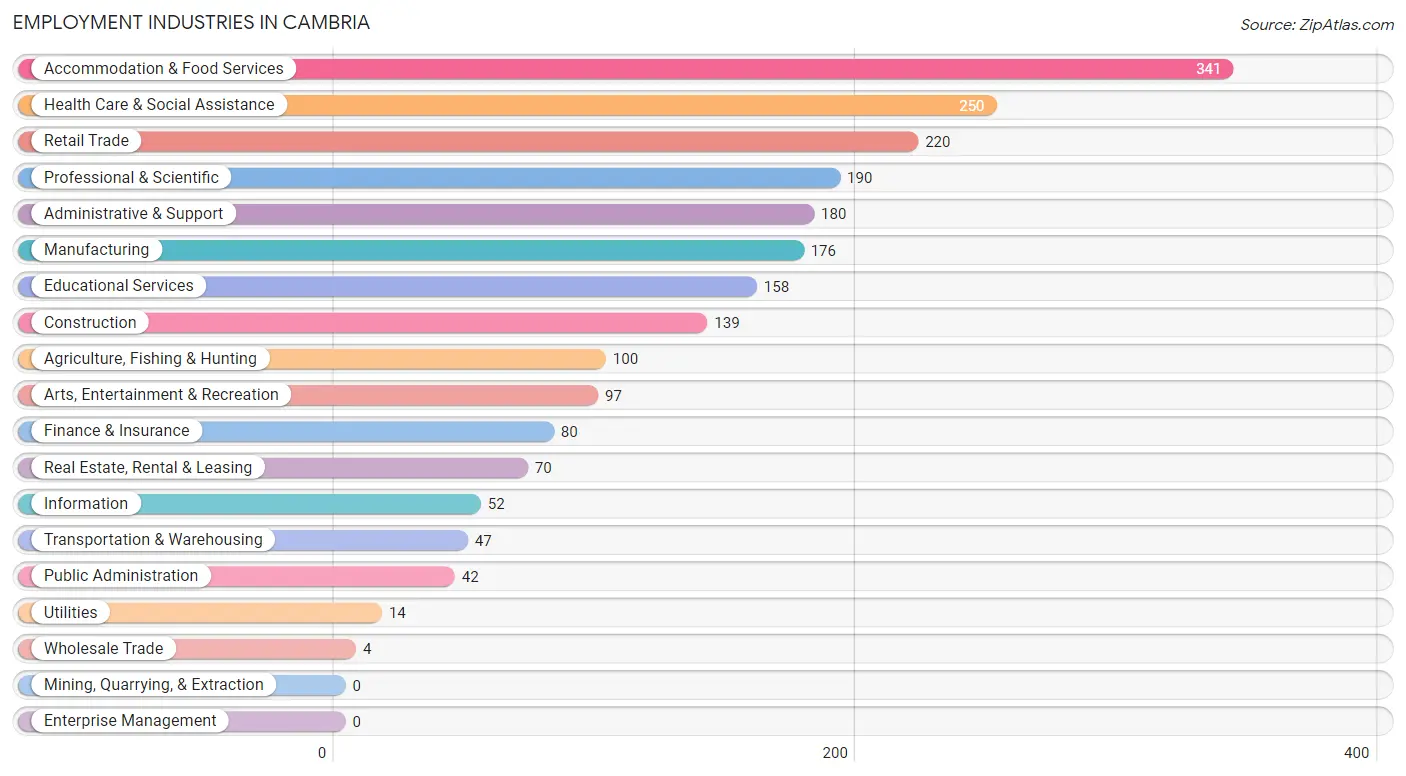
Employment Industries in Cambria
The major employment industries in Cambria include Accommodation & Food Services (341 | 15.0%), Health Care & Social Assistance (250 | 11.0%), Retail Trade (220 | 9.7%), Professional & Scientific (190 | 8.4%), and Administrative & Support (180 | 7.9%).
Employment Industries by Sex in Cambria
The Cambria industries that see more men than women are Transportation & Warehousing (100.0%), Utilities (100.0%), and Construction (93.5%), whereas the industries that tend to have a higher number of women are Wholesale Trade (100.0%), Finance & Insurance (97.5%), and Health Care & Social Assistance (73.6%).
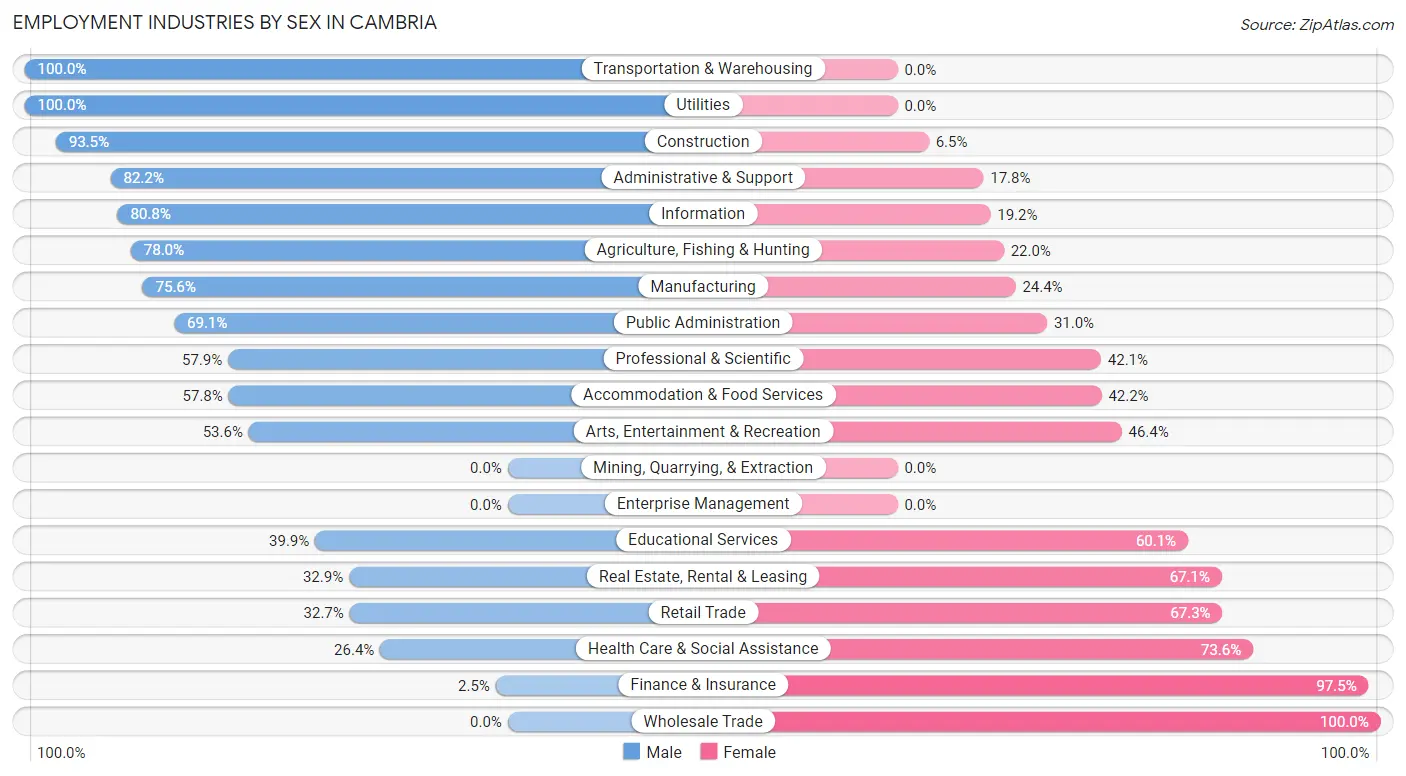
| Industry | Male | Female |
| Agriculture, Fishing & Hunting | 78 (78.0%) | 22 (22.0%) |
| Mining, Quarrying, & Extraction | 0 (0.0%) | 0 (0.0%) |
| Construction | 130 (93.5%) | 9 (6.5%) |
| Manufacturing | 133 (75.6%) | 43 (24.4%) |
| Wholesale Trade | 0 (0.0%) | 4 (100.0%) |
| Retail Trade | 72 (32.7%) | 148 (67.3%) |
| Transportation & Warehousing | 47 (100.0%) | 0 (0.0%) |
| Utilities | 14 (100.0%) | 0 (0.0%) |
| Information | 42 (80.8%) | 10 (19.2%) |
| Finance & Insurance | 2 (2.5%) | 78 (97.5%) |
| Real Estate, Rental & Leasing | 23 (32.9%) | 47 (67.1%) |
| Professional & Scientific | 110 (57.9%) | 80 (42.1%) |
| Enterprise Management | 0 (0.0%) | 0 (0.0%) |
| Administrative & Support | 148 (82.2%) | 32 (17.8%) |
| Educational Services | 63 (39.9%) | 95 (60.1%) |
| Health Care & Social Assistance | 66 (26.4%) | 184 (73.6%) |
| Arts, Entertainment & Recreation | 52 (53.6%) | 45 (46.4%) |
| Accommodation & Food Services | 197 (57.8%) | 144 (42.2%) |
| Public Administration | 29 (69.1%) | 13 (30.9%) |
| Total | 1,216 (53.6%) | 1,054 (46.4%) |
Education in Cambria
School Enrollment in Cambria
The most common levels of schooling among the 778 students in Cambria are high school (311 | 40.0%), middle school (160 | 20.6%), and college / undergraduate (110 | 14.1%).
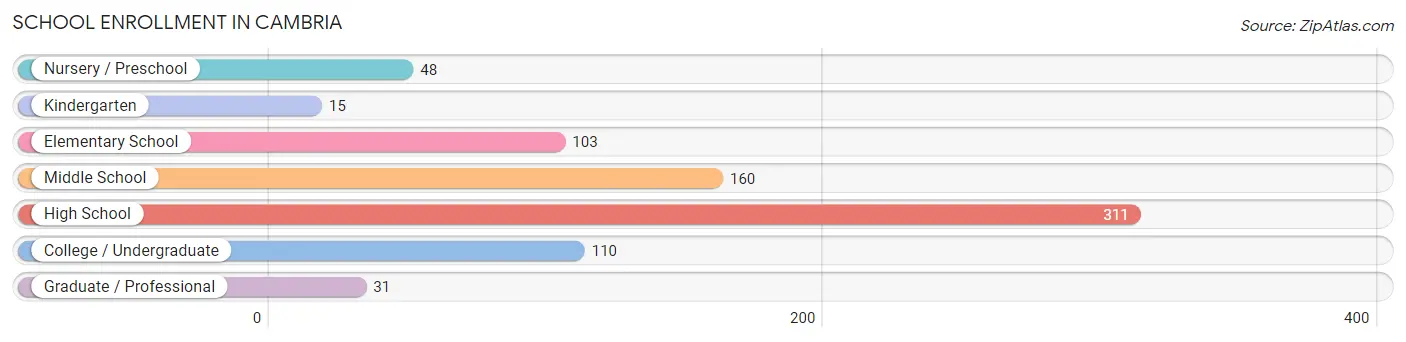
| School Level | # Students | % Students |
| Nursery / Preschool | 48 | 6.2% |
| Kindergarten | 15 | 1.9% |
| Elementary School | 103 | 13.2% |
| Middle School | 160 | 20.6% |
| High School | 311 | 40.0% |
| College / Undergraduate | 110 | 14.1% |
| Graduate / Professional | 31 | 4.0% |
| Total | 778 | 100.0% |
School Enrollment by Age by Funding Source in Cambria
Out of a total of 778 students who are enrolled in schools in Cambria, 88 (11.3%) attend a private institution, while the remaining 690 (88.7%) are enrolled in public schools. The age group of 10 to 14 year olds has the highest likelihood of being enrolled in private schools, with 41 (15.1% in the age bracket) enrolled. Conversely, the age group of 3 to 4 year olds has the lowest likelihood of being enrolled in a private school, with 23 (100.0% in the age bracket) attending a public institution.
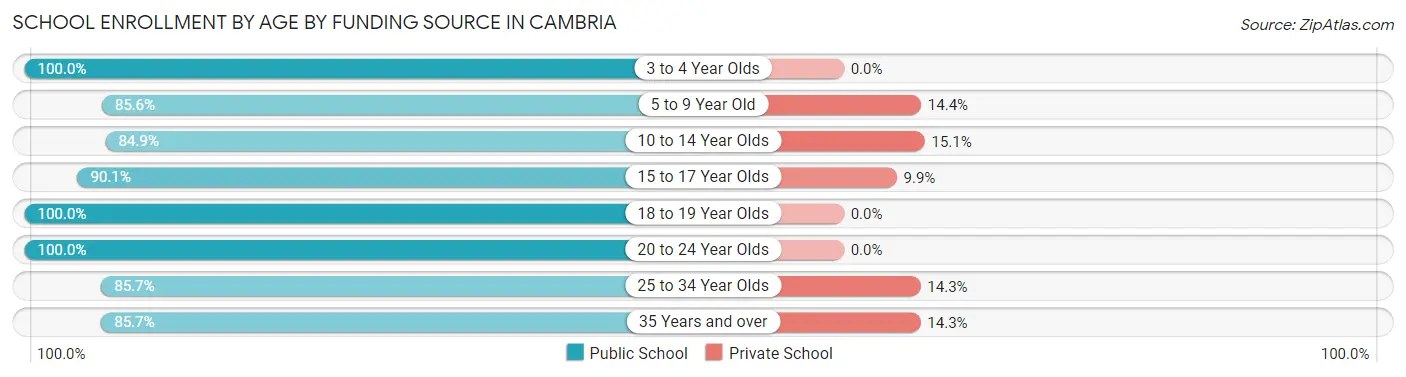
| Age Bracket | Public School | Private School |
| 3 to 4 Year Olds | 23 (100.0%) | 0 (0.0%) |
| 5 to 9 Year Old | 119 (85.6%) | 20 (14.4%) |
| 10 to 14 Year Olds | 231 (84.9%) | 41 (15.1%) |
| 15 to 17 Year Olds | 128 (90.1%) | 14 (9.9%) |
| 18 to 19 Year Olds | 95 (100.0%) | 0 (0.0%) |
| 20 to 24 Year Olds | 16 (100.0%) | 0 (0.0%) |
| 25 to 34 Year Olds | 36 (85.7%) | 6 (14.3%) |
| 35 Years and over | 42 (85.7%) | 7 (14.3%) |
| Total | 690 (88.7%) | 88 (11.3%) |
Educational Attainment by Field of Study in Cambria
Social sciences (270 | 11.3%), bio, nature & agricultural (245 | 10.3%), education (241 | 10.1%), liberal arts & history (238 | 10.0%), and visual & performing arts (228 | 9.6%) are the most common fields of study among 2,380 individuals in Cambria who have obtained a bachelor's degree or higher.
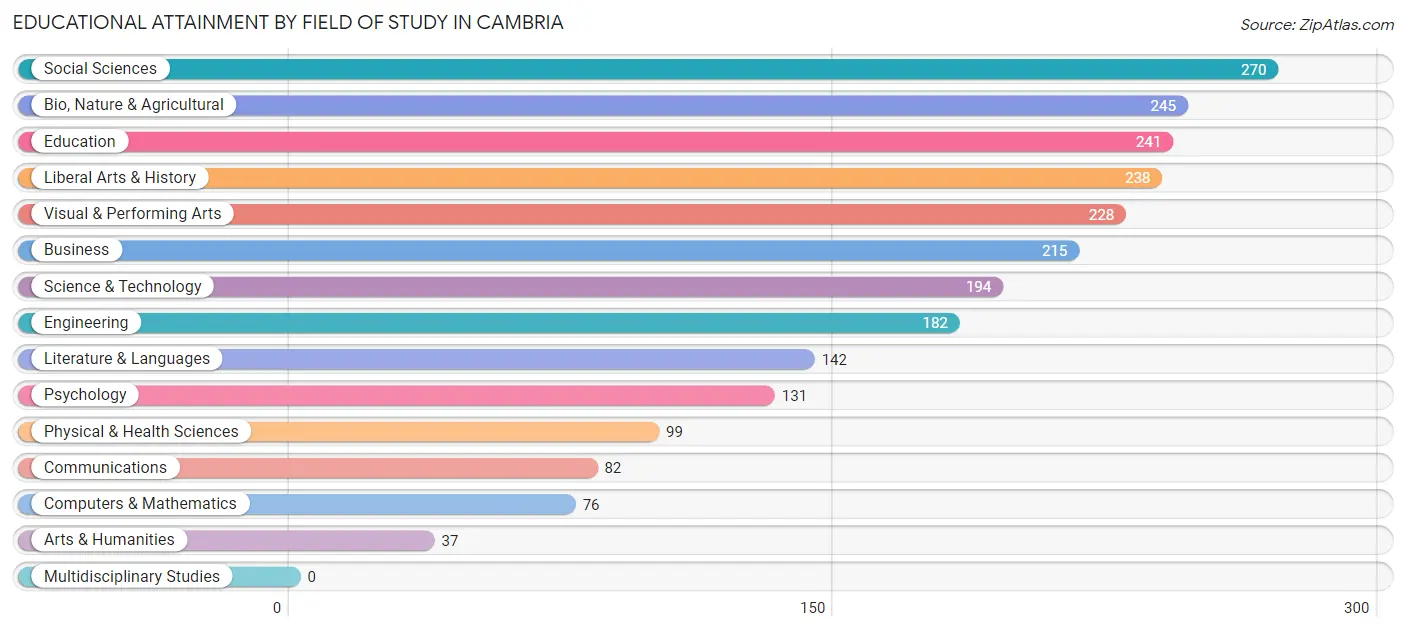
| Field of Study | # Graduates | % Graduates |
| Computers & Mathematics | 76 | 3.2% |
| Bio, Nature & Agricultural | 245 | 10.3% |
| Physical & Health Sciences | 99 | 4.2% |
| Psychology | 131 | 5.5% |
| Social Sciences | 270 | 11.3% |
| Engineering | 182 | 7.6% |
| Multidisciplinary Studies | 0 | 0.0% |
| Science & Technology | 194 | 8.2% |
| Business | 215 | 9.0% |
| Education | 241 | 10.1% |
| Literature & Languages | 142 | 6.0% |
| Liberal Arts & History | 238 | 10.0% |
| Visual & Performing Arts | 228 | 9.6% |
| Communications | 82 | 3.5% |
| Arts & Humanities | 37 | 1.5% |
| Total | 2,380 | 100.0% |
Transportation & Commute in Cambria
Vehicle Availability by Sex in Cambria
The most prevalent vehicle ownership categories in Cambria are males with 2 vehicles (595, accounting for 47.6%) and females with 2 vehicles (536, making up 57.9%).
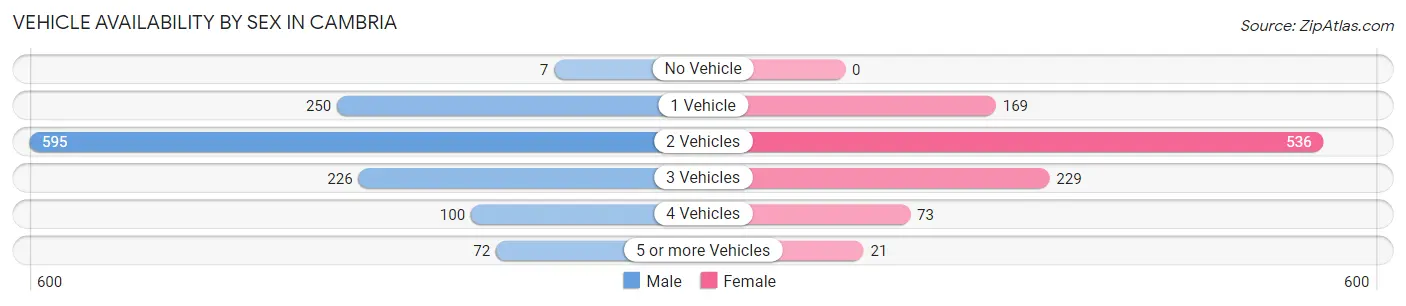
| Vehicles Available | Male | Female |
| No Vehicle | 7 (0.6%) | 0 (0.0%) |
| 1 Vehicle | 250 (20.0%) | 169 (16.4%) |
| 2 Vehicles | 595 (47.6%) | 536 (52.1%) |
| 3 Vehicles | 226 (18.1%) | 229 (22.3%) |
| 4 Vehicles | 100 (8.0%) | 73 (7.1%) |
| 5 or more Vehicles | 72 (5.8%) | 21 (2.0%) |
| Total | 1,250 (100.0%) | 1,028 (100.0%) |
Commute Time in Cambria
The most frequently occuring commute durations in Cambria are 5 to 9 minutes (562 commuters, 32.4%), 10 to 14 minutes (189 commuters, 10.9%), and 45 to 59 minutes (185 commuters, 10.7%).
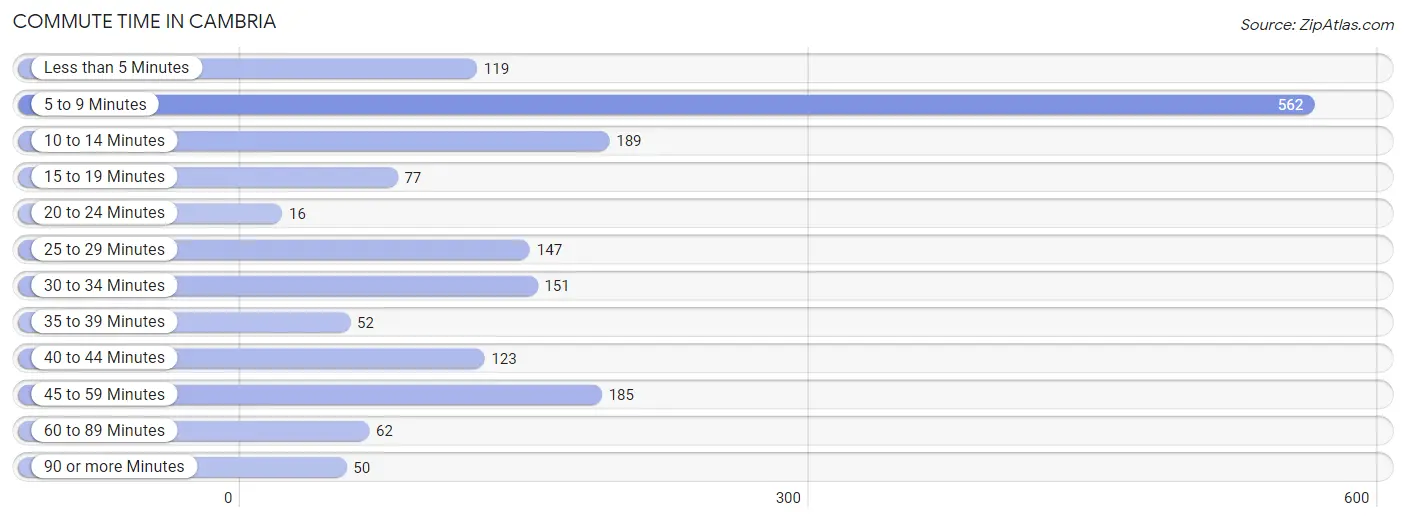
| Commute Time | # Commuters | % Commuters |
| Less than 5 Minutes | 119 | 6.9% |
| 5 to 9 Minutes | 562 | 32.4% |
| 10 to 14 Minutes | 189 | 10.9% |
| 15 to 19 Minutes | 77 | 4.4% |
| 20 to 24 Minutes | 16 | 0.9% |
| 25 to 29 Minutes | 147 | 8.5% |
| 30 to 34 Minutes | 151 | 8.7% |
| 35 to 39 Minutes | 52 | 3.0% |
| 40 to 44 Minutes | 123 | 7.1% |
| 45 to 59 Minutes | 185 | 10.7% |
| 60 to 89 Minutes | 62 | 3.6% |
| 90 or more Minutes | 50 | 2.9% |
Commute Time by Sex in Cambria
The most common commute times in Cambria are 5 to 9 minutes (313 commuters, 33.1%) for males and 5 to 9 minutes (249 commuters, 31.6%) for females.
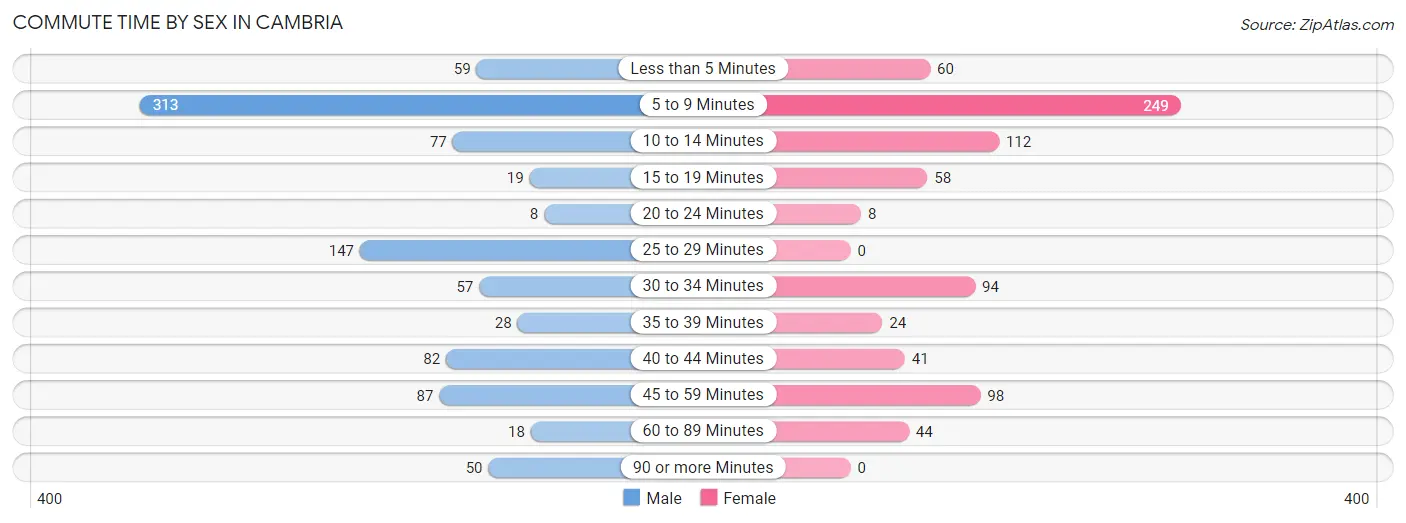
| Commute Time | Male | Female |
| Less than 5 Minutes | 59 (6.2%) | 60 (7.6%) |
| 5 to 9 Minutes | 313 (33.1%) | 249 (31.6%) |
| 10 to 14 Minutes | 77 (8.2%) | 112 (14.2%) |
| 15 to 19 Minutes | 19 (2.0%) | 58 (7.4%) |
| 20 to 24 Minutes | 8 (0.9%) | 8 (1.0%) |
| 25 to 29 Minutes | 147 (15.6%) | 0 (0.0%) |
| 30 to 34 Minutes | 57 (6.0%) | 94 (11.9%) |
| 35 to 39 Minutes | 28 (3.0%) | 24 (3.0%) |
| 40 to 44 Minutes | 82 (8.7%) | 41 (5.2%) |
| 45 to 59 Minutes | 87 (9.2%) | 98 (12.4%) |
| 60 to 89 Minutes | 18 (1.9%) | 44 (5.6%) |
| 90 or more Minutes | 50 (5.3%) | 0 (0.0%) |
Time of Departure to Work by Sex in Cambria
The most frequent times of departure to work in Cambria are 6:00 AM to 6:29 AM (211, 22.3%) for males and 8:00 AM to 8:29 AM (151, 19.2%) for females.
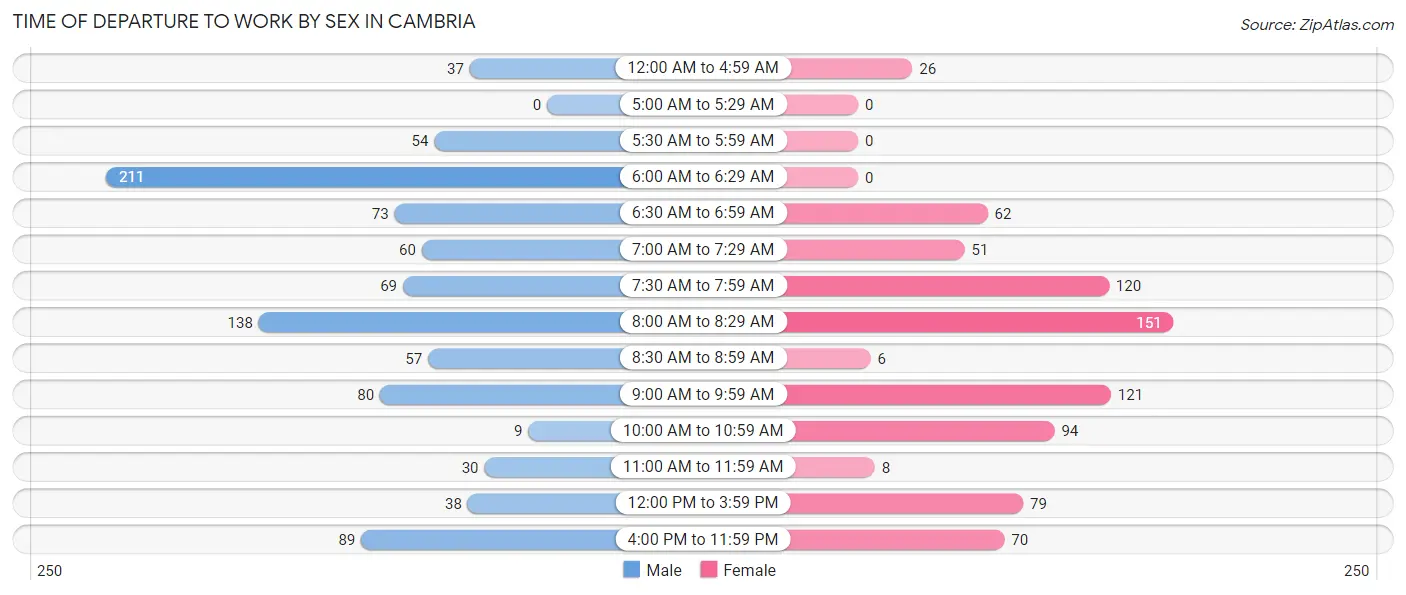
| Time of Departure | Male | Female |
| 12:00 AM to 4:59 AM | 37 (3.9%) | 26 (3.3%) |
| 5:00 AM to 5:29 AM | 0 (0.0%) | 0 (0.0%) |
| 5:30 AM to 5:59 AM | 54 (5.7%) | 0 (0.0%) |
| 6:00 AM to 6:29 AM | 211 (22.3%) | 0 (0.0%) |
| 6:30 AM to 6:59 AM | 73 (7.7%) | 62 (7.9%) |
| 7:00 AM to 7:29 AM | 60 (6.4%) | 51 (6.5%) |
| 7:30 AM to 7:59 AM | 69 (7.3%) | 120 (15.2%) |
| 8:00 AM to 8:29 AM | 138 (14.6%) | 151 (19.2%) |
| 8:30 AM to 8:59 AM | 57 (6.0%) | 6 (0.8%) |
| 9:00 AM to 9:59 AM | 80 (8.5%) | 121 (15.4%) |
| 10:00 AM to 10:59 AM | 9 (0.9%) | 94 (11.9%) |
| 11:00 AM to 11:59 AM | 30 (3.2%) | 8 (1.0%) |
| 12:00 PM to 3:59 PM | 38 (4.0%) | 79 (10.0%) |
| 4:00 PM to 11:59 PM | 89 (9.4%) | 70 (8.9%) |
| Total | 945 (100.0%) | 788 (100.0%) |
Housing Occupancy in Cambria
Occupancy by Ownership in Cambria
Of the total 2,802 dwellings in Cambria, owner-occupied units account for 2,087 (74.5%), while renter-occupied units make up 715 (25.5%).
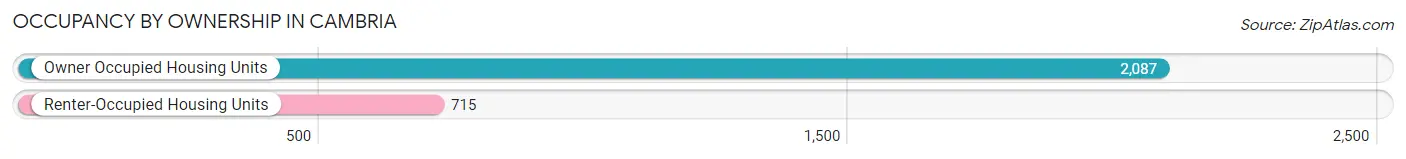
| Occupancy | # Housing Units | % Housing Units |
| Owner Occupied Housing Units | 2,087 | 74.5% |
| Renter-Occupied Housing Units | 715 | 25.5% |
| Total Occupied Housing Units | 2,802 | 100.0% |
Occupancy by Household Size in Cambria
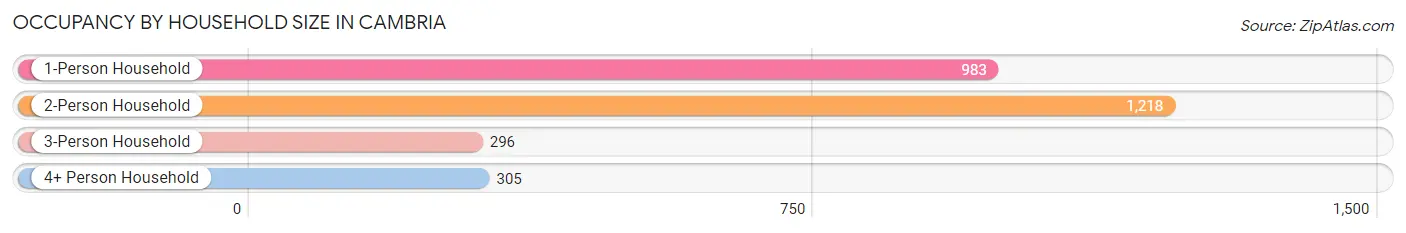
| Household Size | # Housing Units | % Housing Units |
| 1-Person Household | 983 | 35.1% |
| 2-Person Household | 1,218 | 43.5% |
| 3-Person Household | 296 | 10.6% |
| 4+ Person Household | 305 | 10.9% |
| Total Housing Units | 2,802 | 100.0% |
Occupancy by Ownership by Household Size in Cambria
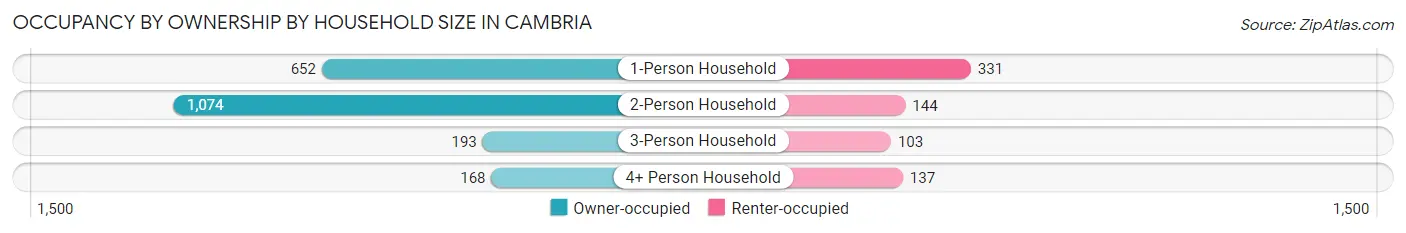
| Household Size | Owner-occupied | Renter-occupied |
| 1-Person Household | 652 (66.3%) | 331 (33.7%) |
| 2-Person Household | 1,074 (88.2%) | 144 (11.8%) |
| 3-Person Household | 193 (65.2%) | 103 (34.8%) |
| 4+ Person Household | 168 (55.1%) | 137 (44.9%) |
| Total Housing Units | 2,087 (74.5%) | 715 (25.5%) |
Occupancy by Educational Attainment in Cambria
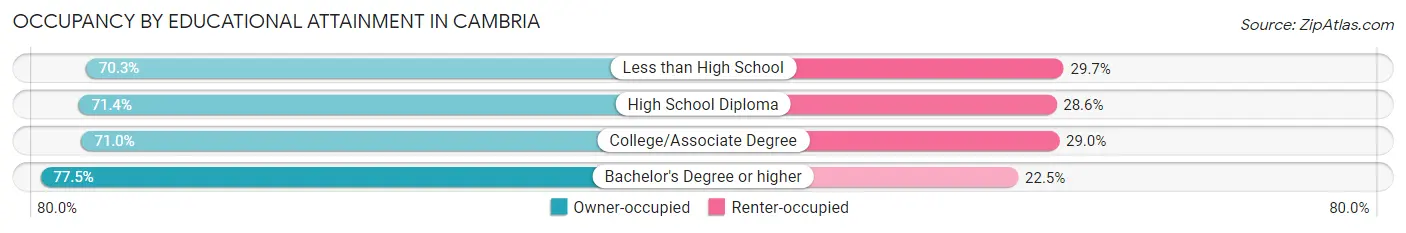
| Household Size | Owner-occupied | Renter-occupied |
| Less than High School | 52 (70.3%) | 22 (29.7%) |
| High School Diploma | 215 (71.4%) | 86 (28.6%) |
| College/Associate Degree | 663 (71.0%) | 271 (29.0%) |
| Bachelor's Degree or higher | 1,157 (77.5%) | 336 (22.5%) |
Occupancy by Age of Householder in Cambria
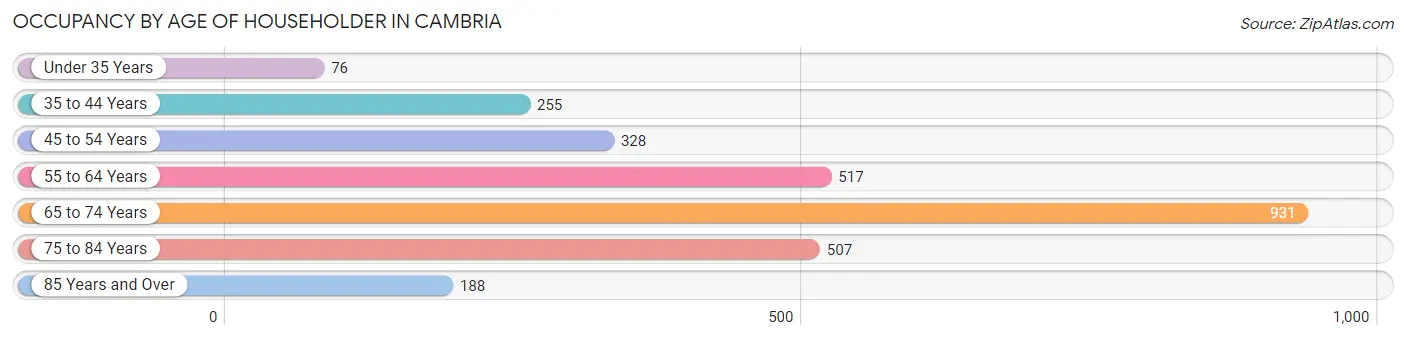
| Age Bracket | # Households | % Households |
| Under 35 Years | 76 | 2.7% |
| 35 to 44 Years | 255 | 9.1% |
| 45 to 54 Years | 328 | 11.7% |
| 55 to 64 Years | 517 | 18.4% |
| 65 to 74 Years | 931 | 33.2% |
| 75 to 84 Years | 507 | 18.1% |
| 85 Years and Over | 188 | 6.7% |
| Total | 2,802 | 100.0% |
Housing Finances in Cambria
Median Income by Occupancy in Cambria
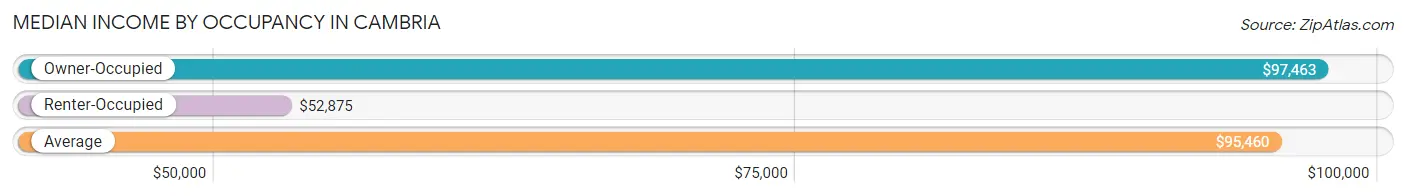
| Occupancy Type | # Households | Median Income |
| Owner-Occupied | 2,087 (74.5%) | $97,463 |
| Renter-Occupied | 715 (25.5%) | $52,875 |
| Average | 2,802 (100.0%) | $95,460 |
Occupancy by Householder Income Bracket in Cambria
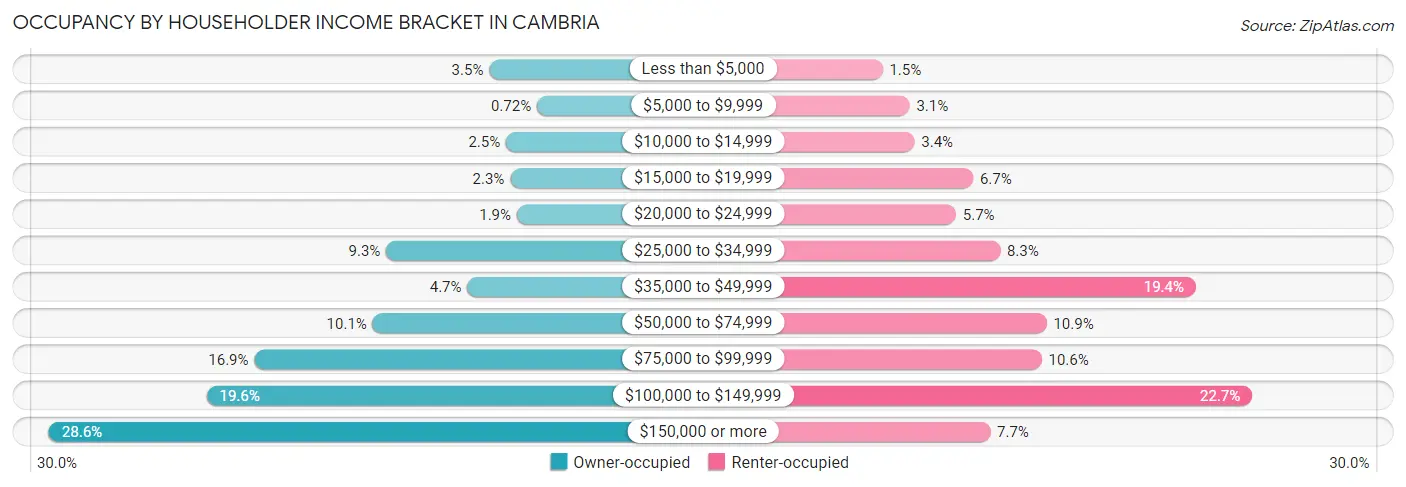
| Income Bracket | Owner-occupied | Renter-occupied |
| Less than $5,000 | 72 (3.5%) | 11 (1.5%) |
| $5,000 to $9,999 | 15 (0.7%) | 22 (3.1%) |
| $10,000 to $14,999 | 52 (2.5%) | 24 (3.4%) |
| $15,000 to $19,999 | 47 (2.2%) | 48 (6.7%) |
| $20,000 to $24,999 | 39 (1.9%) | 41 (5.7%) |
| $25,000 to $34,999 | 195 (9.3%) | 59 (8.3%) |
| $35,000 to $49,999 | 98 (4.7%) | 139 (19.4%) |
| $50,000 to $74,999 | 211 (10.1%) | 78 (10.9%) |
| $75,000 to $99,999 | 352 (16.9%) | 76 (10.6%) |
| $100,000 to $149,999 | 409 (19.6%) | 162 (22.7%) |
| $150,000 or more | 597 (28.6%) | 55 (7.7%) |
| Total | 2,087 (100.0%) | 715 (100.0%) |
Monthly Housing Cost Tiers in Cambria
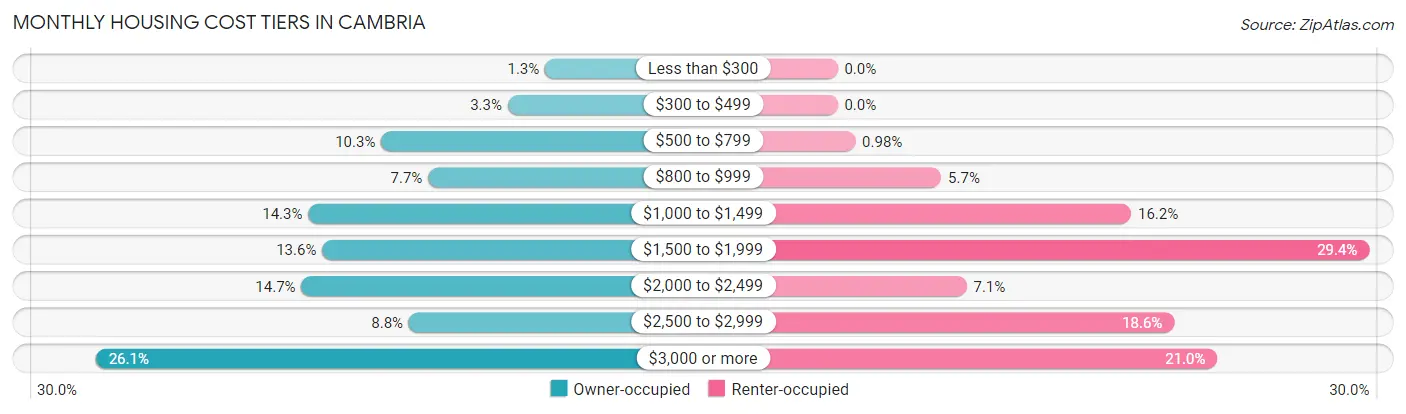
| Monthly Cost | Owner-occupied | Renter-occupied |
| Less than $300 | 26 (1.3%) | 0 (0.0%) |
| $300 to $499 | 69 (3.3%) | 0 (0.0%) |
| $500 to $799 | 215 (10.3%) | 7 (1.0%) |
| $800 to $999 | 161 (7.7%) | 41 (5.7%) |
| $1,000 to $1,499 | 299 (14.3%) | 116 (16.2%) |
| $1,500 to $1,999 | 283 (13.6%) | 210 (29.4%) |
| $2,000 to $2,499 | 307 (14.7%) | 51 (7.1%) |
| $2,500 to $2,999 | 183 (8.8%) | 133 (18.6%) |
| $3,000 or more | 544 (26.1%) | 150 (21.0%) |
| Total | 2,087 (100.0%) | 715 (100.0%) |
Physical Housing Characteristics in Cambria
Housing Structures in Cambria
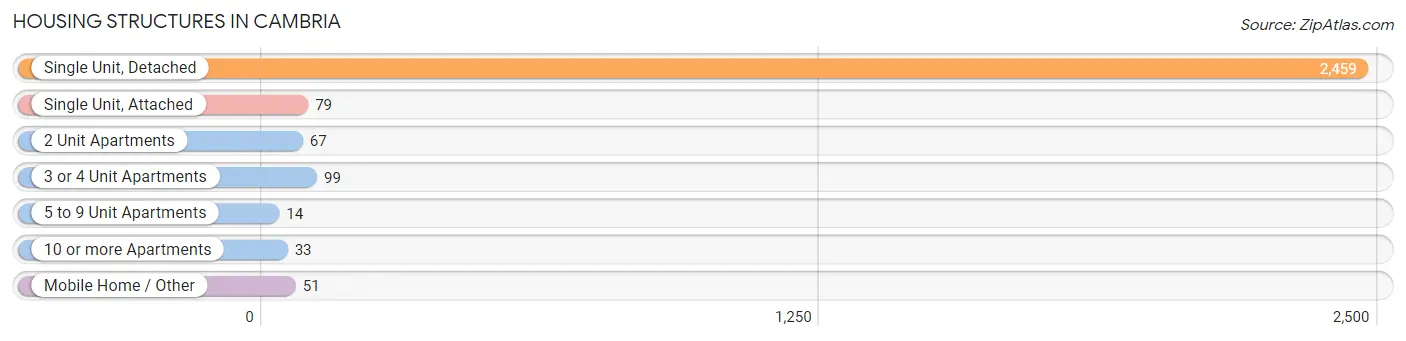
| Structure Type | # Housing Units | % Housing Units |
| Single Unit, Detached | 2,459 | 87.8% |
| Single Unit, Attached | 79 | 2.8% |
| 2 Unit Apartments | 67 | 2.4% |
| 3 or 4 Unit Apartments | 99 | 3.5% |
| 5 to 9 Unit Apartments | 14 | 0.5% |
| 10 or more Apartments | 33 | 1.2% |
| Mobile Home / Other | 51 | 1.8% |
| Total | 2,802 | 100.0% |
Housing Structures by Occupancy in Cambria
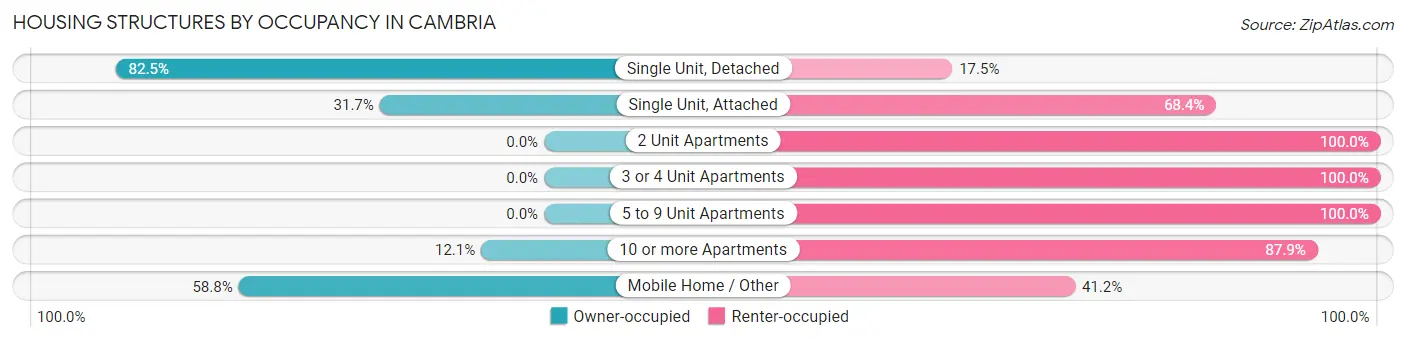
| Structure Type | Owner-occupied | Renter-occupied |
| Single Unit, Detached | 2,028 (82.5%) | 431 (17.5%) |
| Single Unit, Attached | 25 (31.7%) | 54 (68.3%) |
| 2 Unit Apartments | 0 (0.0%) | 67 (100.0%) |
| 3 or 4 Unit Apartments | 0 (0.0%) | 99 (100.0%) |
| 5 to 9 Unit Apartments | 0 (0.0%) | 14 (100.0%) |
| 10 or more Apartments | 4 (12.1%) | 29 (87.9%) |
| Mobile Home / Other | 30 (58.8%) | 21 (41.2%) |
| Total | 2,087 (74.5%) | 715 (25.5%) |
Housing Structures by Number of Rooms in Cambria
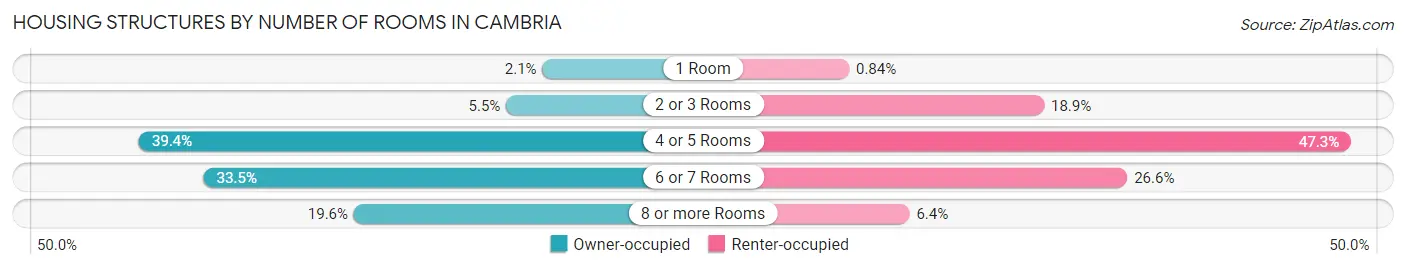
| Number of Rooms | Owner-occupied | Renter-occupied |
| 1 Room | 44 (2.1%) | 6 (0.8%) |
| 2 or 3 Rooms | 114 (5.5%) | 135 (18.9%) |
| 4 or 5 Rooms | 823 (39.4%) | 338 (47.3%) |
| 6 or 7 Rooms | 698 (33.5%) | 190 (26.6%) |
| 8 or more Rooms | 408 (19.6%) | 46 (6.4%) |
| Total | 2,087 (100.0%) | 715 (100.0%) |
Housing Structure by Heating Type in Cambria
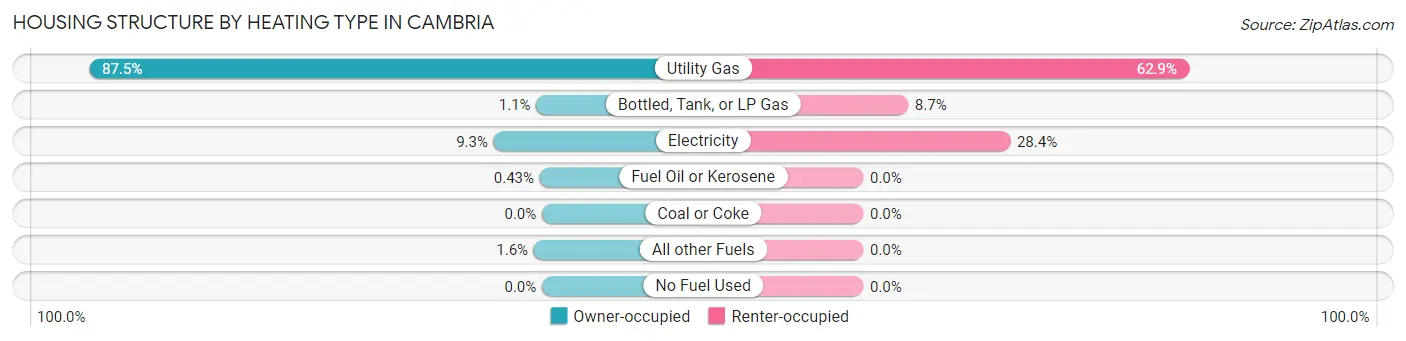
| Heating Type | Owner-occupied | Renter-occupied |
| Utility Gas | 1,827 (87.5%) | 450 (62.9%) |
| Bottled, Tank, or LP Gas | 23 (1.1%) | 62 (8.7%) |
| Electricity | 195 (9.3%) | 203 (28.4%) |
| Fuel Oil or Kerosene | 9 (0.4%) | 0 (0.0%) |
| Coal or Coke | 0 (0.0%) | 0 (0.0%) |
| All other Fuels | 33 (1.6%) | 0 (0.0%) |
| No Fuel Used | 0 (0.0%) | 0 (0.0%) |
| Total | 2,087 (100.0%) | 715 (100.0%) |
Household Vehicle Usage in Cambria
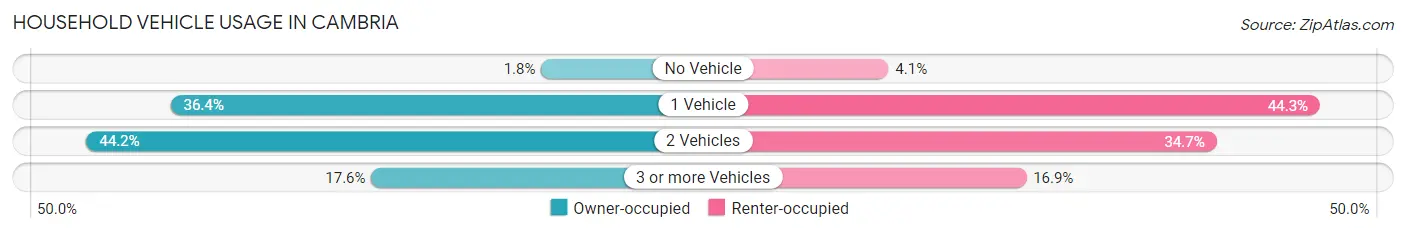
| Vehicles per Household | Owner-occupied | Renter-occupied |
| No Vehicle | 37 (1.8%) | 29 (4.1%) |
| 1 Vehicle | 759 (36.4%) | 317 (44.3%) |
| 2 Vehicles | 923 (44.2%) | 248 (34.7%) |
| 3 or more Vehicles | 368 (17.6%) | 121 (16.9%) |
| Total | 2,087 (100.0%) | 715 (100.0%) |
Real Estate & Mortgages in Cambria
Real Estate and Mortgage Overview in Cambria
| Characteristic | Without Mortgage | With Mortgage |
| Housing Units | 752 | 1,335 |
| Median Property Value | $914,400 | $808,900 |
| Median Household Income | $93,750 | $423 |
| Monthly Housing Costs | $893 | $544 |
| Real Estate Taxes | $5,673 | $8 |
Property Value by Mortgage Status in Cambria
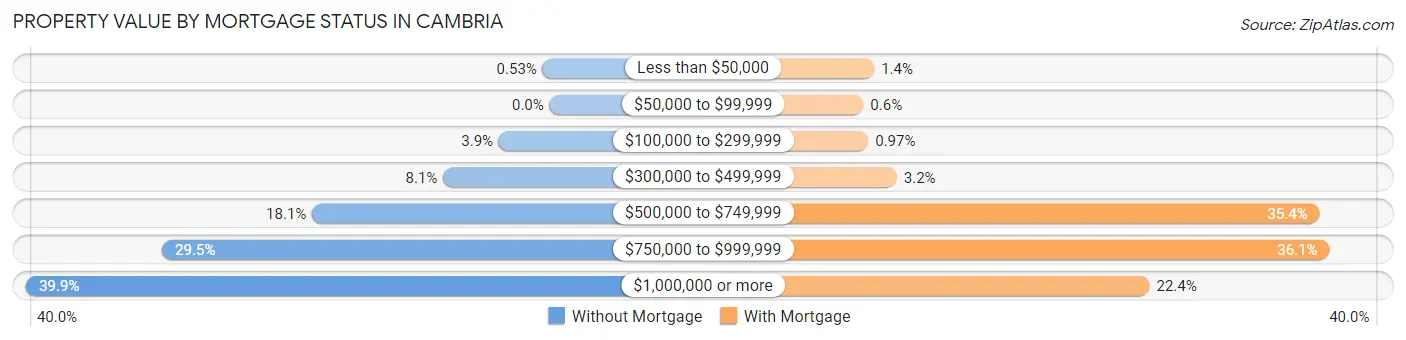
| Property Value | Without Mortgage | With Mortgage |
| Less than $50,000 | 4 (0.5%) | 19 (1.4%) |
| $50,000 to $99,999 | 0 (0.0%) | 8 (0.6%) |
| $100,000 to $299,999 | 29 (3.9%) | 13 (1.0%) |
| $300,000 to $499,999 | 61 (8.1%) | 42 (3.2%) |
| $500,000 to $749,999 | 136 (18.1%) | 472 (35.4%) |
| $750,000 to $999,999 | 222 (29.5%) | 482 (36.1%) |
| $1,000,000 or more | 300 (39.9%) | 299 (22.4%) |
| Total | 752 (100.0%) | 1,335 (100.0%) |
Household Income by Mortgage Status in Cambria
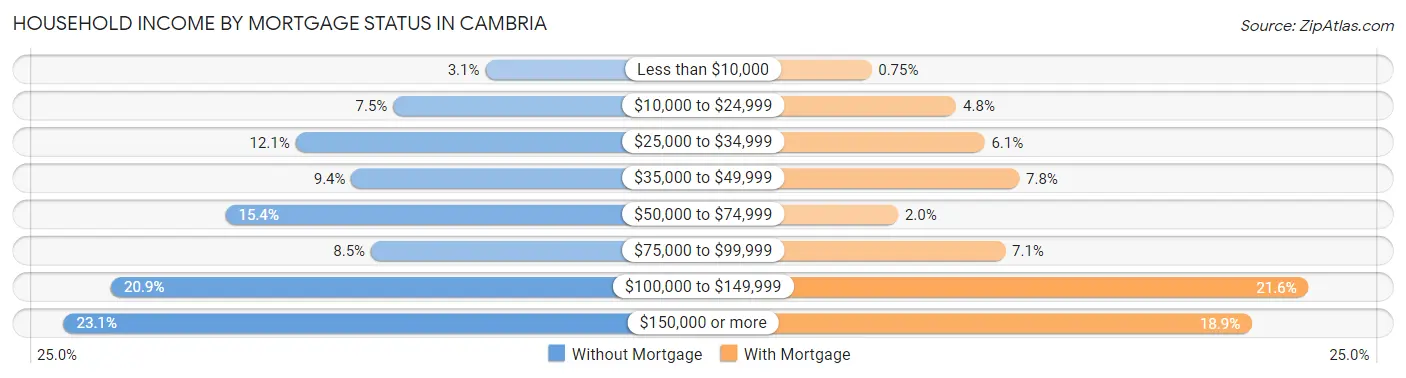
| Household Income | Without Mortgage | With Mortgage |
| Less than $10,000 | 23 (3.1%) | 10 (0.7%) |
| $10,000 to $24,999 | 56 (7.4%) | 64 (4.8%) |
| $25,000 to $34,999 | 91 (12.1%) | 82 (6.1%) |
| $35,000 to $49,999 | 71 (9.4%) | 104 (7.8%) |
| $50,000 to $74,999 | 116 (15.4%) | 27 (2.0%) |
| $75,000 to $99,999 | 64 (8.5%) | 95 (7.1%) |
| $100,000 to $149,999 | 157 (20.9%) | 288 (21.6%) |
| $150,000 or more | 174 (23.1%) | 252 (18.9%) |
| Total | 752 (100.0%) | 1,335 (100.0%) |
Property Value to Household Income Ratio in Cambria
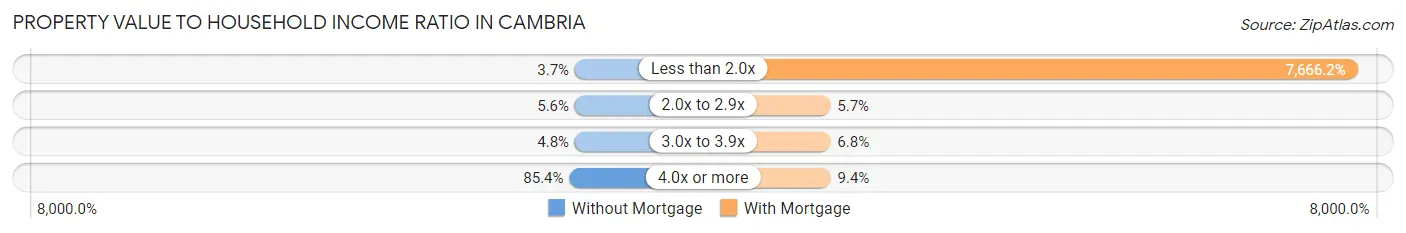
| Value-to-Income Ratio | Without Mortgage | With Mortgage |
| Less than 2.0x | 28 (3.7%) | 102,344 (7,666.2%) |
| 2.0x to 2.9x | 42 (5.6%) | 76 (5.7%) |
| 3.0x to 3.9x | 36 (4.8%) | 91 (6.8%) |
| 4.0x or more | 642 (85.4%) | 126 (9.4%) |
| Total | 752 (100.0%) | 1,335 (100.0%) |
Real Estate Taxes by Mortgage Status in Cambria
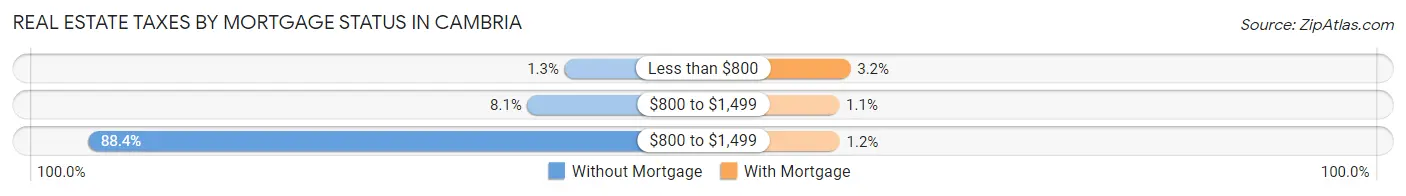
| Property Taxes | Without Mortgage | With Mortgage |
| Less than $800 | 10 (1.3%) | 42 (3.2%) |
| $800 to $1,499 | 61 (8.1%) | 15 (1.1%) |
| $800 to $1,499 | 665 (88.4%) | 16 (1.2%) |
| Total | 752 (100.0%) | 1,335 (100.0%) |
Health & Disability in Cambria
Health Insurance Coverage by Age in Cambria
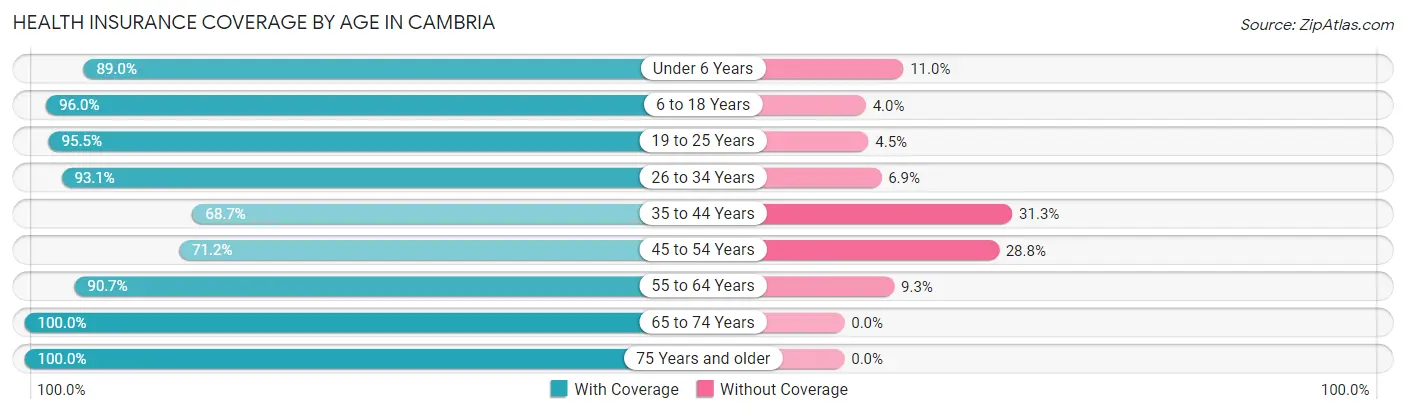
| Age Bracket | With Coverage | Without Coverage |
| Under 6 Years | 251 (89.0%) | 31 (11.0%) |
| 6 to 18 Years | 552 (96.0%) | 23 (4.0%) |
| 19 to 25 Years | 192 (95.5%) | 9 (4.5%) |
| 26 to 34 Years | 149 (93.1%) | 11 (6.9%) |
| 35 to 44 Years | 316 (68.7%) | 144 (31.3%) |
| 45 to 54 Years | 440 (71.2%) | 178 (28.8%) |
| 55 to 64 Years | 996 (90.7%) | 102 (9.3%) |
| 65 to 74 Years | 1,435 (100.0%) | 0 (0.0%) |
| 75 Years and older | 926 (100.0%) | 0 (0.0%) |
| Total | 5,257 (91.3%) | 498 (8.6%) |
Health Insurance Coverage by Citizenship Status in Cambria
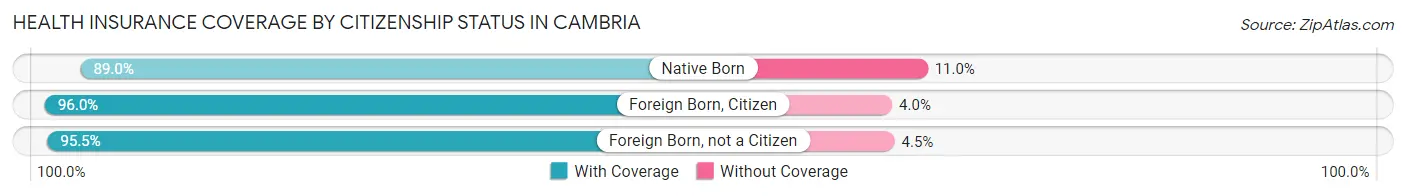
| Citizenship Status | With Coverage | Without Coverage |
| Native Born | 251 (89.0%) | 31 (11.0%) |
| Foreign Born, Citizen | 552 (96.0%) | 23 (4.0%) |
| Foreign Born, not a Citizen | 192 (95.5%) | 9 (4.5%) |
Health Insurance Coverage by Household Income in Cambria
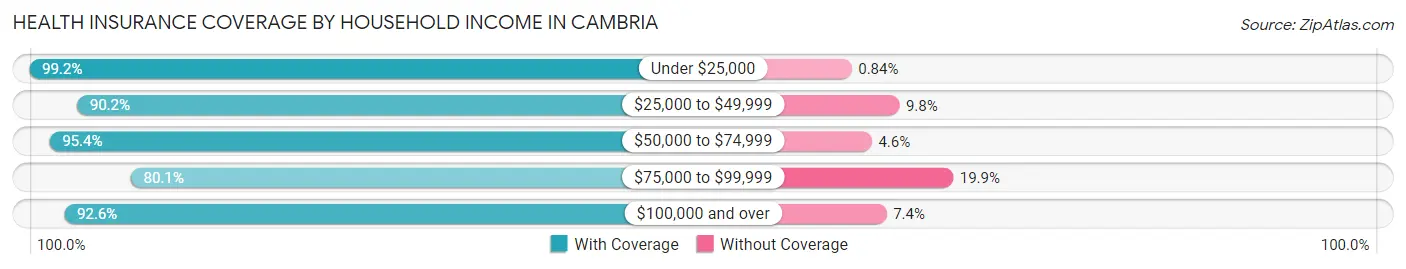
| Household Income | With Coverage | Without Coverage |
| Under $25,000 | 589 (99.2%) | 5 (0.8%) |
| $25,000 to $49,999 | 701 (90.2%) | 76 (9.8%) |
| $50,000 to $74,999 | 557 (95.4%) | 27 (4.6%) |
| $75,000 to $99,999 | 706 (80.1%) | 175 (19.9%) |
| $100,000 and over | 2,700 (92.6%) | 215 (7.4%) |
Public vs Private Health Insurance Coverage by Age in Cambria
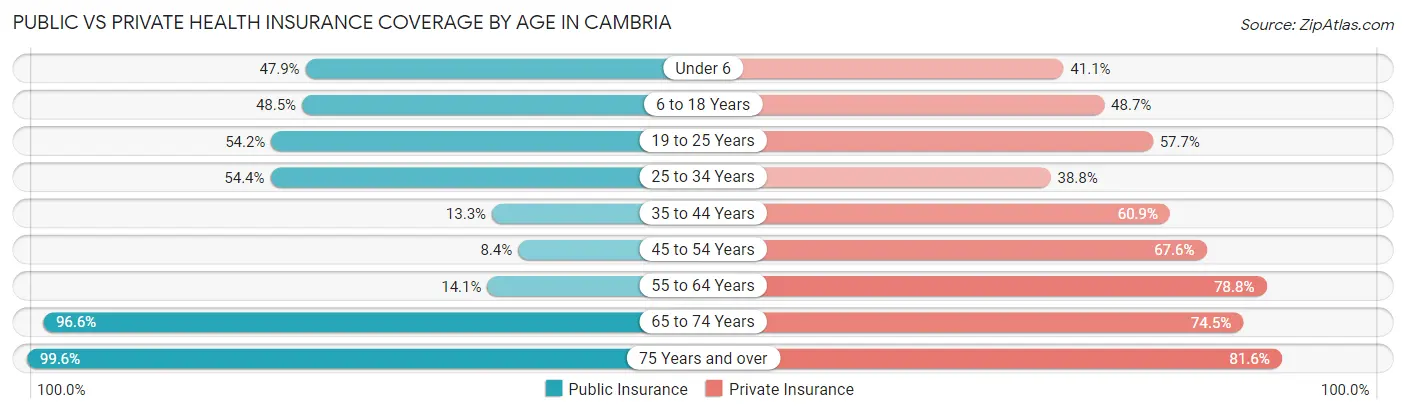
| Age Bracket | Public Insurance | Private Insurance |
| Under 6 | 135 (47.9%) | 116 (41.1%) |
| 6 to 18 Years | 279 (48.5%) | 280 (48.7%) |
| 19 to 25 Years | 109 (54.2%) | 116 (57.7%) |
| 25 to 34 Years | 87 (54.4%) | 62 (38.8%) |
| 35 to 44 Years | 61 (13.3%) | 280 (60.9%) |
| 45 to 54 Years | 52 (8.4%) | 418 (67.6%) |
| 55 to 64 Years | 155 (14.1%) | 865 (78.8%) |
| 65 to 74 Years | 1,386 (96.6%) | 1,069 (74.5%) |
| 75 Years and over | 922 (99.6%) | 756 (81.6%) |
| Total | 3,186 (55.4%) | 3,962 (68.8%) |
Disability Status by Sex by Age in Cambria
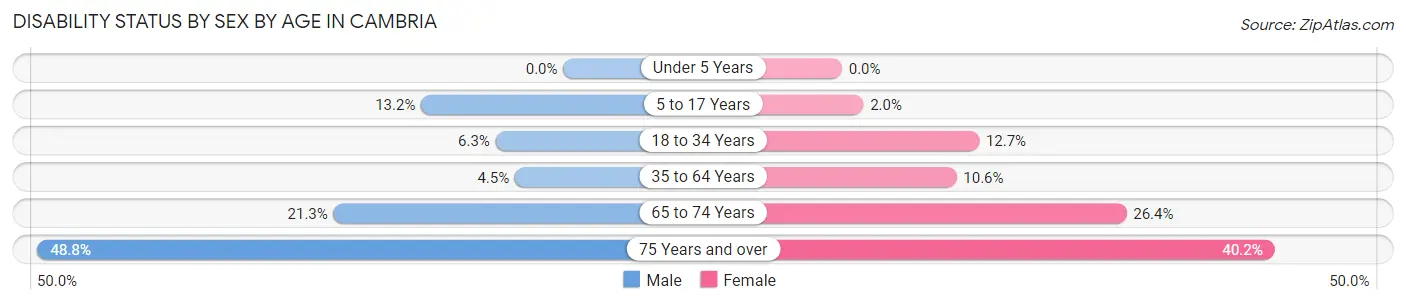
| Age Bracket | Male | Female |
| Under 5 Years | 0 (0.0%) | 0 (0.0%) |
| 5 to 17 Years | 38 (13.2%) | 6 (2.0%) |
| 18 to 34 Years | 12 (6.3%) | 28 (12.7%) |
| 35 to 64 Years | 49 (4.5%) | 115 (10.6%) |
| 65 to 74 Years | 142 (21.3%) | 203 (26.4%) |
| 75 Years and over | 204 (48.8%) | 204 (40.2%) |
Disability Class by Sex by Age in Cambria
Disability Class: Hearing Difficulty
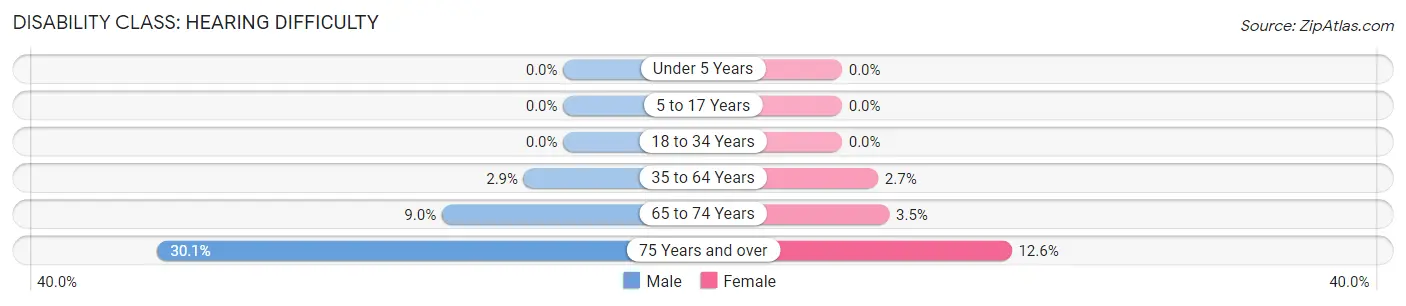
| Age Bracket | Male | Female |
| Under 5 Years | 0 (0.0%) | 0 (0.0%) |
| 5 to 17 Years | 0 (0.0%) | 0 (0.0%) |
| 18 to 34 Years | 0 (0.0%) | 0 (0.0%) |
| 35 to 64 Years | 32 (2.9%) | 29 (2.7%) |
| 65 to 74 Years | 60 (9.0%) | 27 (3.5%) |
| 75 Years and over | 126 (30.1%) | 64 (12.6%) |
Disability Class: Vision Difficulty
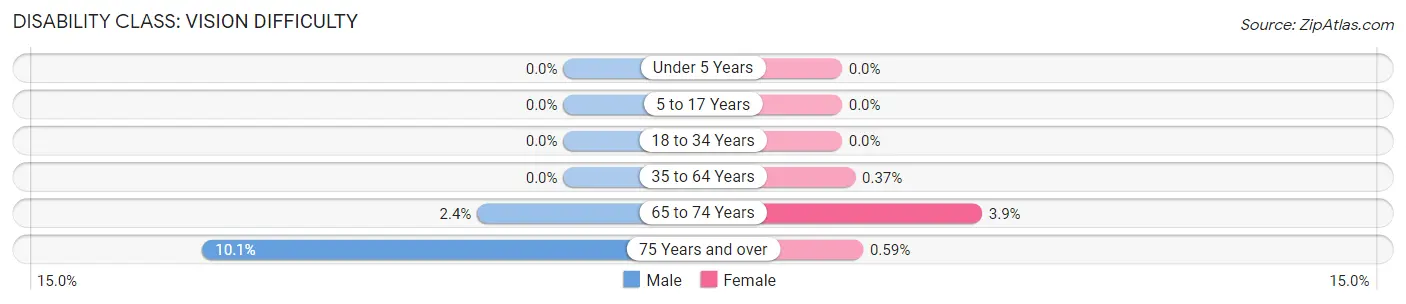
| Age Bracket | Male | Female |
| Under 5 Years | 0 (0.0%) | 0 (0.0%) |
| 5 to 17 Years | 0 (0.0%) | 0 (0.0%) |
| 18 to 34 Years | 0 (0.0%) | 0 (0.0%) |
| 35 to 64 Years | 0 (0.0%) | 4 (0.4%) |
| 65 to 74 Years | 16 (2.4%) | 30 (3.9%) |
| 75 Years and over | 42 (10.1%) | 3 (0.6%) |
Disability Class: Cognitive Difficulty
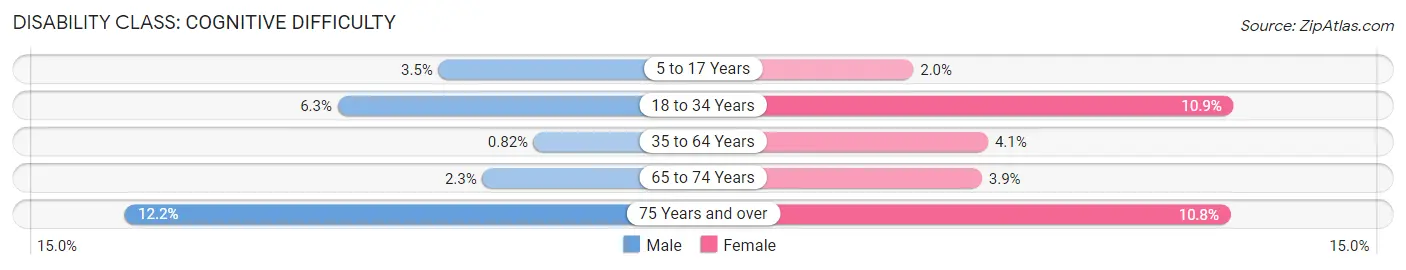
| Age Bracket | Male | Female |
| 5 to 17 Years | 10 (3.5%) | 6 (2.0%) |
| 18 to 34 Years | 12 (6.3%) | 24 (10.9%) |
| 35 to 64 Years | 9 (0.8%) | 44 (4.1%) |
| 65 to 74 Years | 15 (2.2%) | 30 (3.9%) |
| 75 Years and over | 51 (12.2%) | 55 (10.8%) |
Disability Class: Ambulatory Difficulty
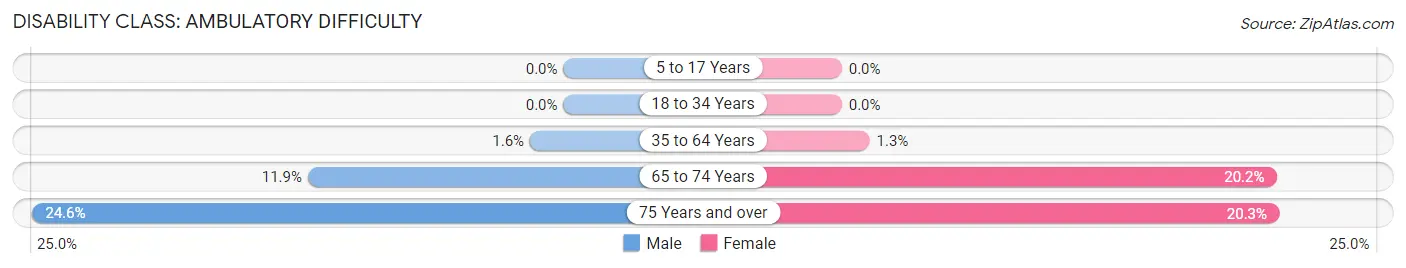
| Age Bracket | Male | Female |
| 5 to 17 Years | 0 (0.0%) | 0 (0.0%) |
| 18 to 34 Years | 0 (0.0%) | 0 (0.0%) |
| 35 to 64 Years | 17 (1.5%) | 14 (1.3%) |
| 65 to 74 Years | 79 (11.9%) | 155 (20.2%) |
| 75 Years and over | 103 (24.6%) | 103 (20.3%) |
Disability Class: Self-Care Difficulty
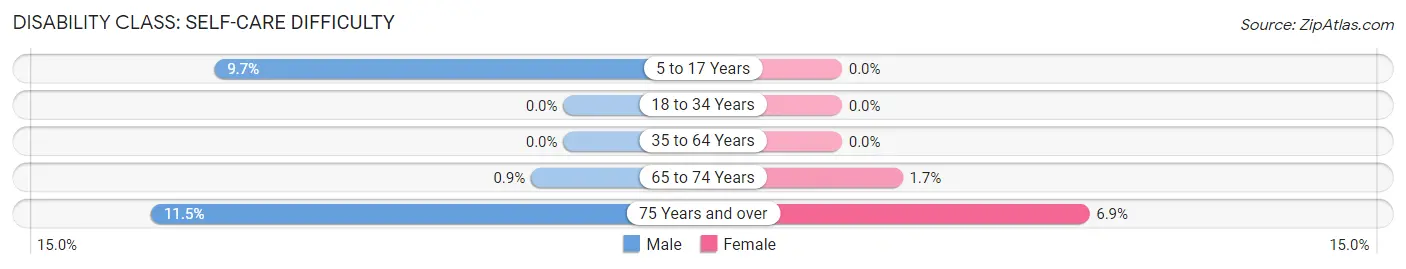
| Age Bracket | Male | Female |
| 5 to 17 Years | 28 (9.7%) | 0 (0.0%) |
| 18 to 34 Years | 0 (0.0%) | 0 (0.0%) |
| 35 to 64 Years | 0 (0.0%) | 0 (0.0%) |
| 65 to 74 Years | 6 (0.9%) | 13 (1.7%) |
| 75 Years and over | 48 (11.5%) | 35 (6.9%) |
Technology Access in Cambria
Computing Device Access in Cambria
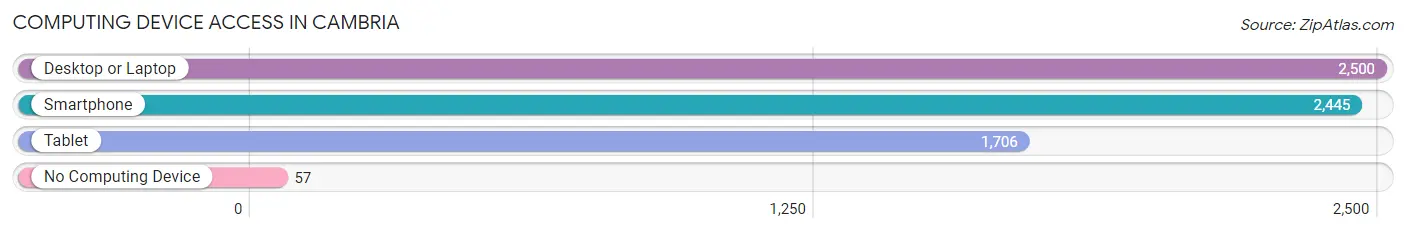
| Device Type | # Households | % Households |
| Desktop or Laptop | 2,500 | 89.2% |
| Smartphone | 2,445 | 87.3% |
| Tablet | 1,706 | 60.9% |
| No Computing Device | 57 | 2.0% |
| Total | 2,802 | 100.0% |
Internet Access in Cambria
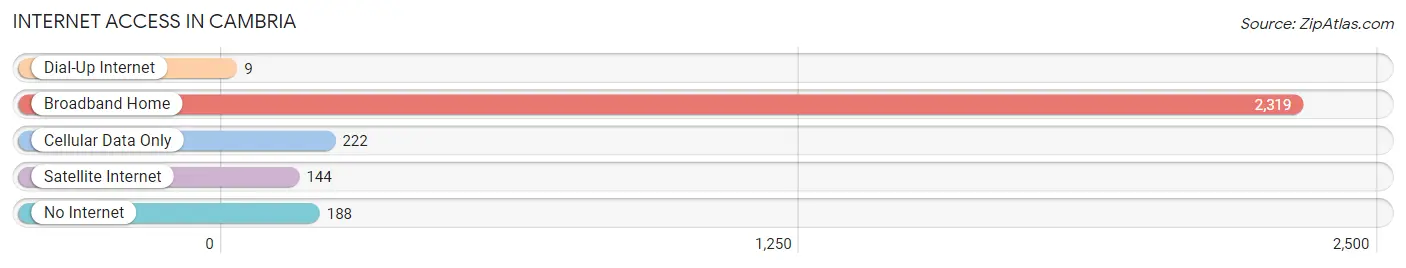
| Internet Type | # Households | % Households |
| Dial-Up Internet | 9 | 0.3% |
| Broadband Home | 2,319 | 82.8% |
| Cellular Data Only | 222 | 7.9% |
| Satellite Internet | 144 | 5.1% |
| No Internet | 188 | 6.7% |
| Total | 2,802 | 100.0% |
Cambria Summary
Cambria is a small coastal town located in San Luis Obispo County, California. It is situated on the Pacific Coast, just south of Big Sur and north of San Simeon. The town is known for its picturesque scenery, quaint shops, and wineries. Cambria is a popular tourist destination, and its population swells during the summer months.
History
The area now known as Cambria was originally inhabited by the Chumash people, who lived in the area for thousands of years. The first European settlers arrived in the area in the late 1700s, and the town was officially founded in 1869. The town was named after the Cambrian period, which is a period of geological time.
In the late 1800s, Cambria became a popular tourist destination, and many of the town’s buildings were built during this time. The town was also home to a number of lumber mills, which provided jobs for many of the town’s residents.
In the early 1900s, Cambria became a popular destination for Hollywood filmmakers, who used the town as a backdrop for many of their films. The town was also home to a number of artists, writers, and musicians, who were drawn to the area’s natural beauty.
Geography
Cambria is located on the Pacific Coast, just south of Big Sur and north of San Simeon. The town is situated on a coastal plain, and is surrounded by rolling hills and mountains. The town is located near the Santa Lucia Mountains, which provide a stunning backdrop for the town.
The climate in Cambria is mild and temperate, with warm summers and cool winters. The average temperature in the summer is around 70 degrees Fahrenheit, and the average temperature in the winter is around 50 degrees Fahrenheit.
Economy
The economy of Cambria is largely based on tourism. The town is a popular destination for visitors from all over the world, and the town’s shops, restaurants, and wineries attract many visitors. The town is also home to a number of art galleries, which showcase the work of local artists.
In addition to tourism, Cambria is also home to a number of businesses, including a number of wineries, a brewery, and a distillery. The town is also home to a number of small businesses, such as antique stores, gift shops, and restaurants.
Demographics
As of the 2010 census, the population of Cambria was 6,032. The town is predominantly white, with a small Hispanic population. The median household income in Cambria is $60,000, and the median home value is $541,000. The town has a low unemployment rate, and the majority of the town’s residents are employed in the tourism industry.
Common Questions
What is Per Capita Income in Cambria?
Per Capita income in Cambria is $54,483.
What is the Median Family Income in Cambria?
Median Family Income in Cambria is $103,583.
What is the Median Household income in Cambria?
Median Household Income in Cambria is $95,460.
What is Income or Wage Gap in Cambria?
Income or Wage Gap in Cambria is 39.4%.
Women in Cambria earn 60.6 cents for every dollar earned by a man.
What is Inequality or Gini Index in Cambria?
Inequality or Gini Index in Cambria is 0.45.
What is the Total Population of Cambria?
Total Population of Cambria is 5,825.
What is the Total Male Population of Cambria?
Total Male Population of Cambria is 2,851.
What is the Total Female Population of Cambria?
Total Female Population of Cambria is 2,974.
What is the Ratio of Males per 100 Females in Cambria?
There are 95.86 Males per 100 Females in Cambria.
What is the Ratio of Females per 100 Males in Cambria?
There are 104.31 Females per 100 Males in Cambria.
What is the Median Population Age in Cambria?
Median Population Age in Cambria is 60.1 Years.
What is the Average Family Size in Cambria
Average Family Size in Cambria is 2.7 People.
What is the Average Household Size in Cambria
Average Household Size in Cambria is 2.1 People.
How Large is the Labor Force in Cambria?
There are 2,493 People in the Labor Forcein in Cambria.
What is the Percentage of People in the Labor Force in Cambria?
48.6% of People are in the Labor Force in Cambria.
What is the Unemployment Rate in Cambria?
Unemployment Rate in Cambria is 6.4%.