Livingston, CA Map & Demographics
Livingston Map
Livingston Overview
$20,356
PER CAPITA INCOME
$72,667
AVG FAMILY INCOME
$70,918
AVG HOUSEHOLD INCOME
37.1%
WAGE / INCOME GAP [ % ]
62.9¢/ $1
WAGE / INCOME GAP [ $ ]
$10,703
FAMILY INCOME DEFICIT
0.34
INEQUALITY / GINI INDEX
14,344
TOTAL POPULATION
6,860
MALE POPULATION
7,484
FEMALE POPULATION
91.66
MALES / 100 FEMALES
109.10
FEMALES / 100 MALES
32.1
MEDIAN AGE
4.5
AVG FAMILY SIZE
4.3
AVG HOUSEHOLD SIZE
6,929
LABOR FORCE [ PEOPLE ]
63.7%
PERCENT IN LABOR FORCE
10.1%
UNEMPLOYMENT RATE
Livingston Zip Codes
Livingston Area Codes
Income in Livingston
Income Overview in Livingston
Per Capita Income in Livingston is $20,356, while median incomes of families and households are $72,667 and $70,918 respectively.
| Characteristic | Number | Measure |
| Per Capita Income | 14,344 | $20,356 |
| Median Family Income | 2,894 | $72,667 |
| Mean Family Income | 2,894 | $79,968 |
| Median Household Income | 3,348 | $70,918 |
| Mean Household Income | 3,348 | $78,719 |
| Income Deficit | 2,894 | $10,703 |
| Wage / Income Gap (%) | 14,344 | 37.05% |
| Wage / Income Gap ($) | 14,344 | 62.95¢ per $1 |
| Gini / Inequality Index | 14,344 | 0.34 |
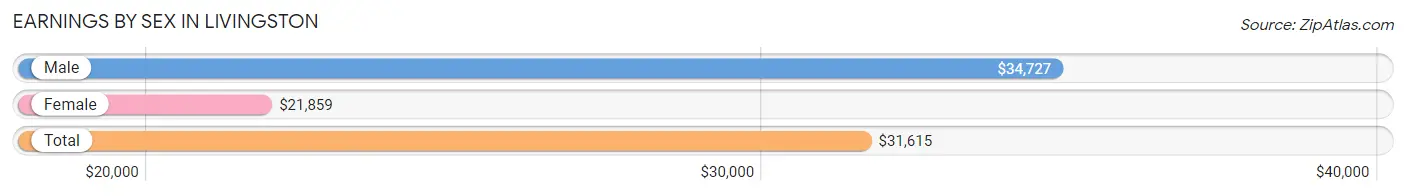
Earnings by Sex in Livingston
Average Earnings in Livingston are $31,615, $34,727 for men and $21,859 for women, a difference of 37.0%.
| Sex | Number | Average Earnings |
| Male | 3,825 (54.9%) | $34,727 |
| Female | 3,147 (45.1%) | $21,859 |
| Total | 6,972 (100.0%) | $31,615 |
Earnings by Sex by Income Bracket in Livingston
The most common earnings brackets in Livingston are $30,000 to $34,999 for men (643 | 16.8%) and $17,500 to $19,999 for women (278 | 8.8%).
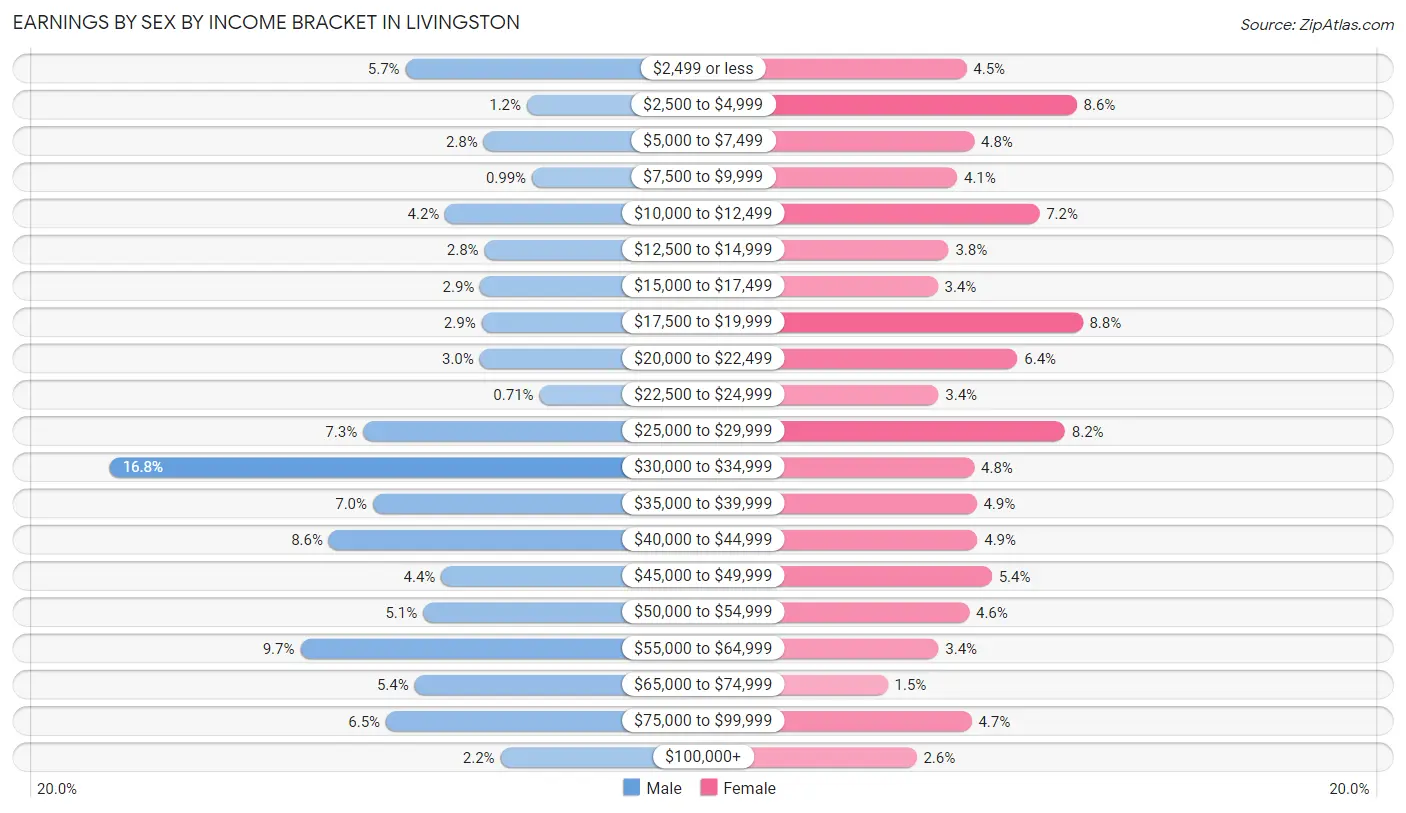
| Income | Male | Female |
| $2,499 or less | 219 (5.7%) | 141 (4.5%) |
| $2,500 to $4,999 | 45 (1.2%) | 271 (8.6%) |
| $5,000 to $7,499 | 107 (2.8%) | 150 (4.8%) |
| $7,500 to $9,999 | 38 (1.0%) | 130 (4.1%) |
| $10,000 to $12,499 | 162 (4.2%) | 227 (7.2%) |
| $12,500 to $14,999 | 106 (2.8%) | 120 (3.8%) |
| $15,000 to $17,499 | 112 (2.9%) | 107 (3.4%) |
| $17,500 to $19,999 | 110 (2.9%) | 278 (8.8%) |
| $20,000 to $22,499 | 113 (2.9%) | 201 (6.4%) |
| $22,500 to $24,999 | 27 (0.7%) | 108 (3.4%) |
| $25,000 to $29,999 | 280 (7.3%) | 257 (8.2%) |
| $30,000 to $34,999 | 643 (16.8%) | 150 (4.8%) |
| $35,000 to $39,999 | 266 (7.0%) | 153 (4.9%) |
| $40,000 to $44,999 | 329 (8.6%) | 154 (4.9%) |
| $45,000 to $49,999 | 168 (4.4%) | 171 (5.4%) |
| $50,000 to $54,999 | 194 (5.1%) | 144 (4.6%) |
| $55,000 to $64,999 | 370 (9.7%) | 108 (3.4%) |
| $65,000 to $74,999 | 206 (5.4%) | 48 (1.5%) |
| $75,000 to $99,999 | 247 (6.5%) | 147 (4.7%) |
| $100,000+ | 83 (2.2%) | 82 (2.6%) |
| Total | 3,825 (100.0%) | 3,147 (100.0%) |
Earnings by Sex by Educational Attainment in Livingston
Average earnings in Livingston are $38,817 for men and $26,638 for women, a difference of 31.4%. Men with an educational attainment of graduate degree enjoy the highest average annual earnings of $63,239, while those with less than high school education earn the least with $34,193. Women with an educational attainment of bachelor's degree earn the most with the average annual earnings of $45,517, while those with less than high school education have the smallest earnings of $19,444.
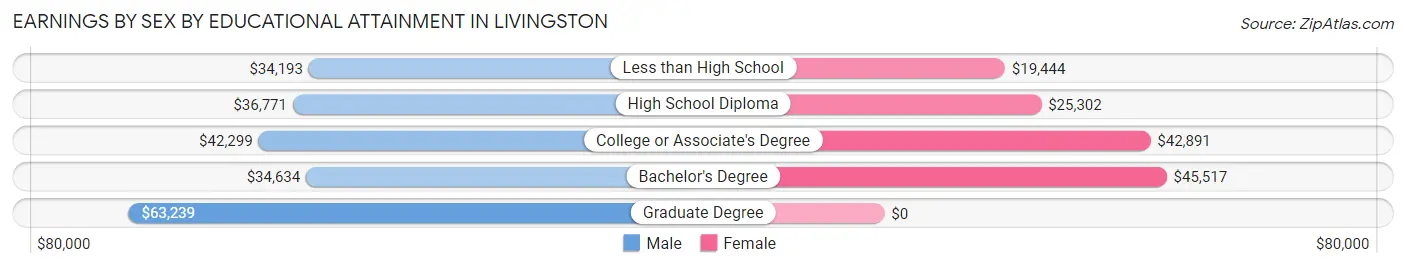
| Educational Attainment | Male Income | Female Income |
| Less than High School | $34,193 | $19,444 |
| High School Diploma | $36,771 | $25,302 |
| College or Associate's Degree | $42,299 | $42,891 |
| Bachelor's Degree | $34,634 | $45,517 |
| Graduate Degree | $63,239 | $0 |
| Total | $38,817 | $26,638 |
Family Income in Livingston
Family Income Brackets in Livingston
According to the Livingston family income data, there are 738 families falling into the $100,000 to $149,999 income range, which is the most common income bracket and makes up 25.5% of all families. Conversely, the $10,000 to $14,999 income bracket is the least frequent group with only 26 families (0.9%) belonging to this category.
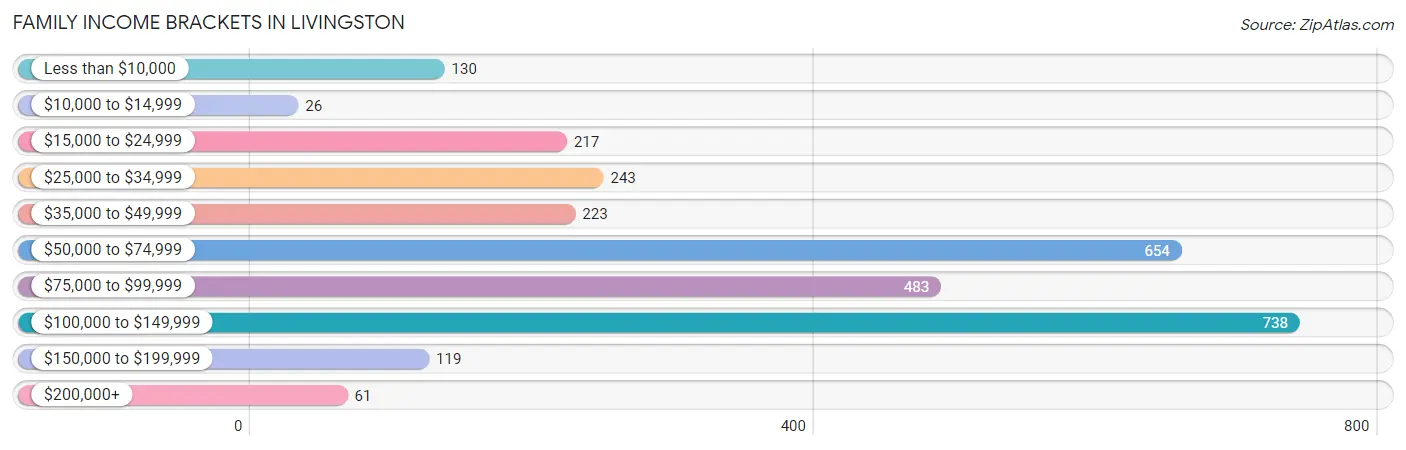
| Income Bracket | # Families | % Families |
| Less than $10,000 | 130 | 4.5% |
| $10,000 to $14,999 | 26 | 0.9% |
| $15,000 to $24,999 | 217 | 7.5% |
| $25,000 to $34,999 | 243 | 8.4% |
| $35,000 to $49,999 | 223 | 7.7% |
| $50,000 to $74,999 | 654 | 22.6% |
| $75,000 to $99,999 | 483 | 16.7% |
| $100,000 to $149,999 | 738 | 25.5% |
| $150,000 to $199,999 | 119 | 4.1% |
| $200,000+ | 61 | 2.1% |
Family Income by Famaliy Size in Livingston
5-person families (553 | 19.1%) account for the highest median family income in Livingston with $108,305 per family, while 2-person families (681 | 23.5%) have the highest median income of $31,468 per family member.
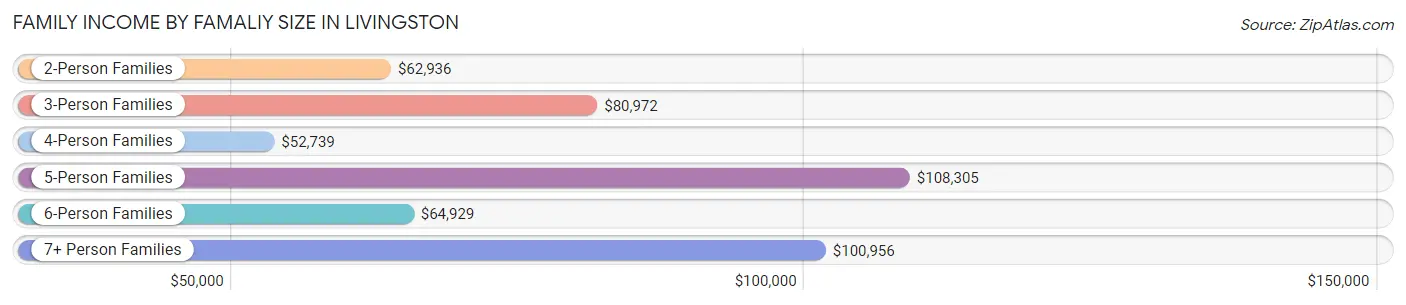
| Income Bracket | # Families | Median Income |
| 2-Person Families | 681 (23.5%) | $62,936 |
| 3-Person Families | 622 (21.5%) | $80,972 |
| 4-Person Families | 627 (21.7%) | $52,739 |
| 5-Person Families | 553 (19.1%) | $108,305 |
| 6-Person Families | 203 (7.0%) | $64,929 |
| 7+ Person Families | 208 (7.2%) | $100,956 |
| Total | 2,894 (100.0%) | $72,667 |
Family Income by Number of Earners in Livingston
The median family income in Livingston is $72,667, with families comprising 3+ earners (757) having the highest median family income of $110,302, while families with no earners (179) have the lowest median family income of $21,886, accounting for 26.2% and 6.2% of families, respectively.
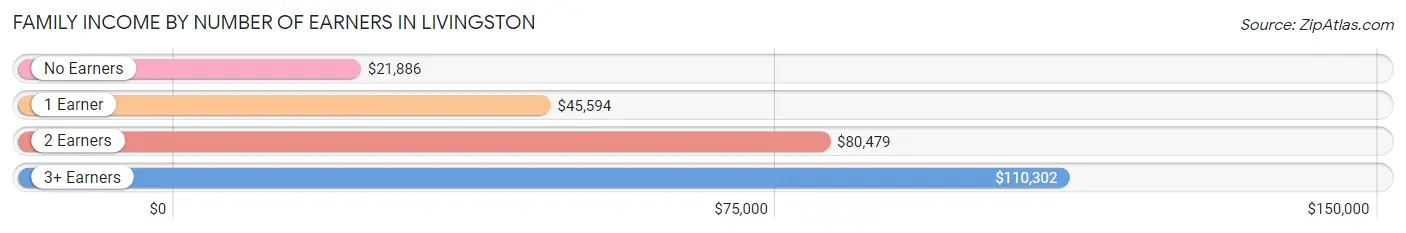
| Number of Earners | # Families | Median Income |
| No Earners | 179 (6.2%) | $21,886 |
| 1 Earner | 917 (31.7%) | $45,594 |
| 2 Earners | 1,041 (36.0%) | $80,479 |
| 3+ Earners | 757 (26.2%) | $110,302 |
| Total | 2,894 (100.0%) | $72,667 |
Household Income in Livingston
Household Income Brackets in Livingston
With 804 households falling in the category, the $50,000 to $74,999 income range is the most frequent in Livingston, accounting for 24.0% of all households. In contrast, only 64 households (1.9%) fall into the $200,000+ income bracket, making it the least populous group.
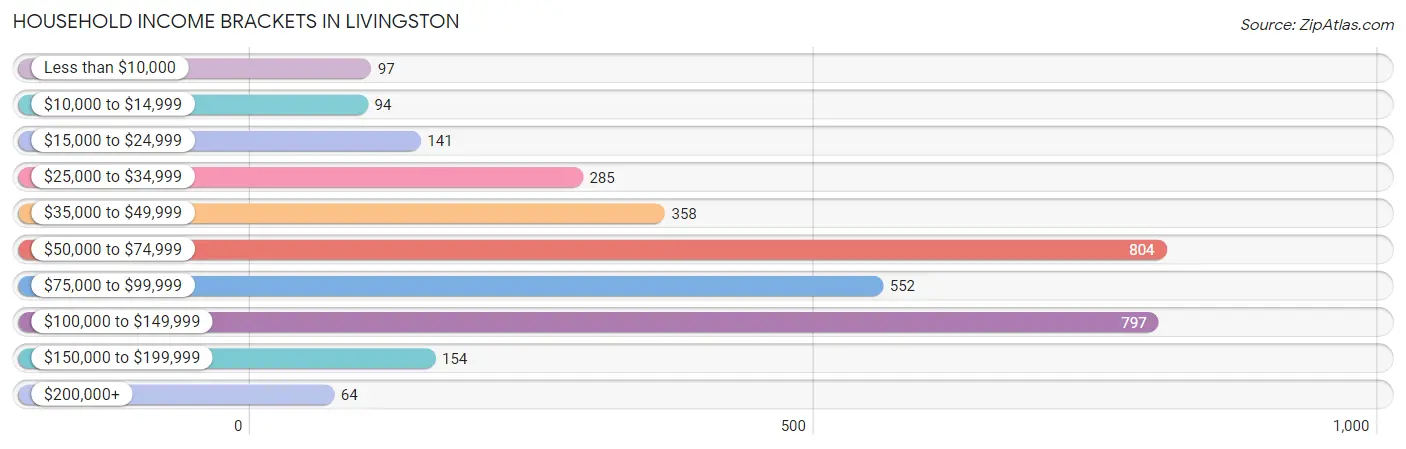
| Income Bracket | # Households | % Households |
| Less than $10,000 | 97 | 2.9% |
| $10,000 to $14,999 | 94 | 2.8% |
| $15,000 to $24,999 | 141 | 4.2% |
| $25,000 to $34,999 | 285 | 8.5% |
| $35,000 to $49,999 | 358 | 10.7% |
| $50,000 to $74,999 | 804 | 24.0% |
| $75,000 to $99,999 | 552 | 16.5% |
| $100,000 to $149,999 | 797 | 23.8% |
| $150,000 to $199,999 | 154 | 4.6% |
| $200,000+ | 64 | 1.9% |
Household Income by Householder Age in Livingston
The median household income in Livingston is $70,918, with the highest median household income of $101,429 found in the 15 to 24 years age bracket for the primary householder. A total of 24 households (0.7%) fall into this category. Meanwhile, the 65+ years age bracket for the primary householder has the lowest median household income of $59,000, with 640 households (19.1%) in this group.
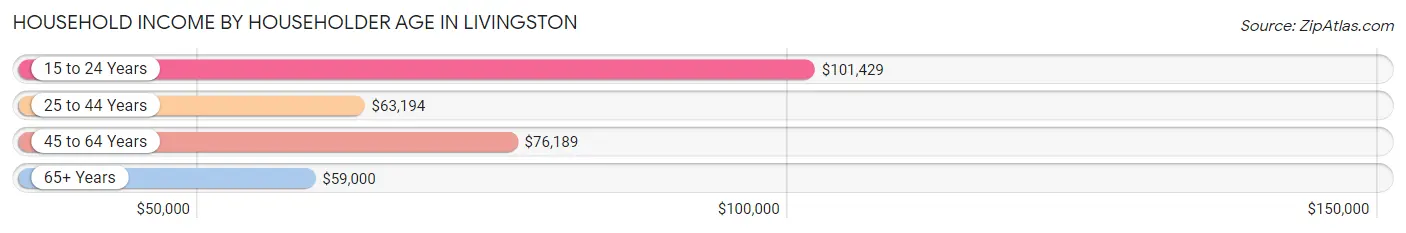
| Income Bracket | # Households | Median Income |
| 15 to 24 Years | 24 (0.7%) | $101,429 |
| 25 to 44 Years | 1,095 (32.7%) | $63,194 |
| 45 to 64 Years | 1,589 (47.5%) | $76,189 |
| 65+ Years | 640 (19.1%) | $59,000 |
| Total | 3,348 (100.0%) | $70,918 |
Poverty in Livingston
Income Below Poverty by Sex and Age in Livingston
With 15.7% poverty level for males and 17.5% for females among the residents of Livingston, 6 to 11 year old males and 15 year old females are the most vulnerable to poverty, with 209 males (45.3%) and 52 females (50.5%) in their respective age groups living below the poverty level.
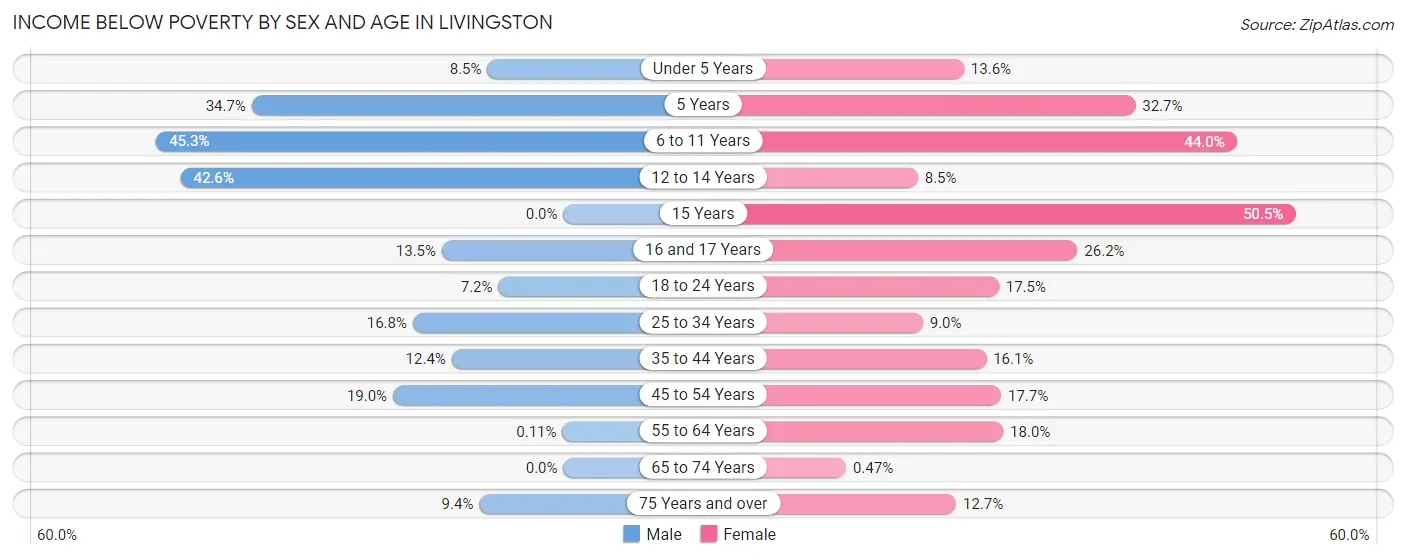
| Age Bracket | Male | Female |
| Under 5 Years | 44 (8.5%) | 88 (13.6%) |
| 5 Years | 42 (34.7%) | 51 (32.7%) |
| 6 to 11 Years | 209 (45.3%) | 262 (44.0%) |
| 12 to 14 Years | 214 (42.6%) | 23 (8.5%) |
| 15 Years | 0 (0.0%) | 52 (50.5%) |
| 16 and 17 Years | 28 (13.5%) | 95 (26.2%) |
| 18 to 24 Years | 42 (7.2%) | 143 (17.5%) |
| 25 to 34 Years | 185 (16.8%) | 110 (9.0%) |
| 35 to 44 Years | 111 (12.4%) | 124 (16.1%) |
| 45 to 54 Years | 160 (19.0%) | 168 (17.7%) |
| 55 to 64 Years | 1 (0.1%) | 129 (18.0%) |
| 65 to 74 Years | 0 (0.0%) | 2 (0.5%) |
| 75 Years and over | 34 (9.4%) | 49 (12.7%) |
| Total | 1,070 (15.7%) | 1,296 (17.5%) |
Income Above Poverty by Sex and Age in Livingston
According to the poverty statistics in Livingston, males aged 65 to 74 years and females aged 65 to 74 years are the age groups that are most secure financially, with 100.0% of males and 99.5% of females in these age groups living above the poverty line.
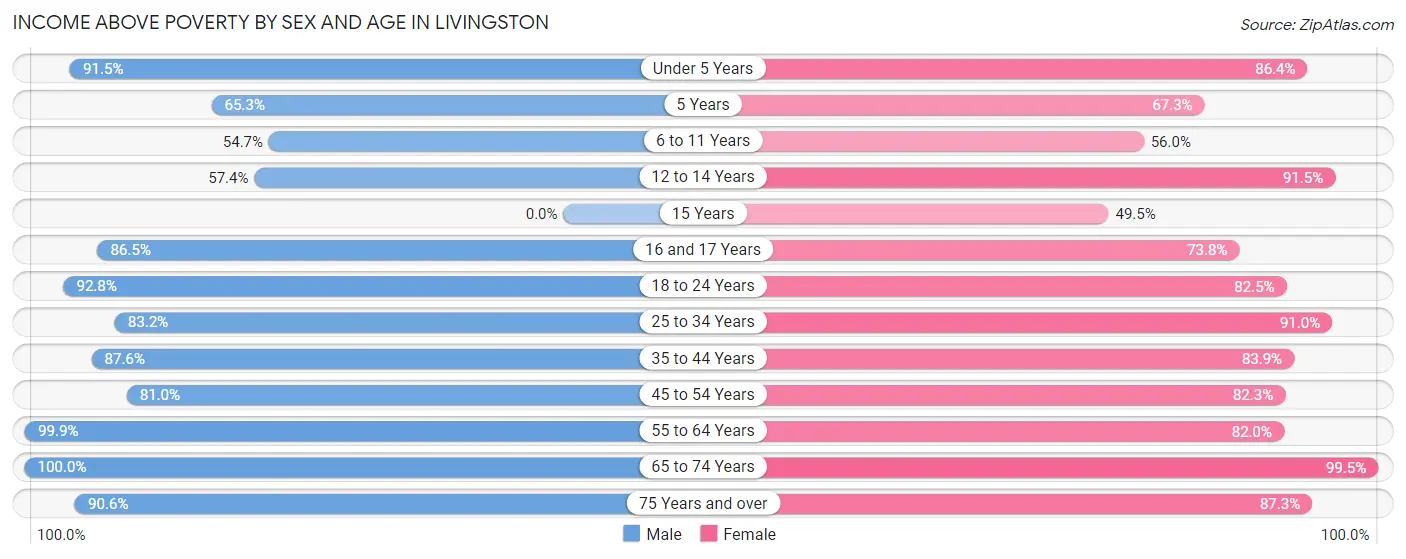
| Age Bracket | Male | Female |
| Under 5 Years | 476 (91.5%) | 559 (86.4%) |
| 5 Years | 79 (65.3%) | 105 (67.3%) |
| 6 to 11 Years | 252 (54.7%) | 334 (56.0%) |
| 12 to 14 Years | 288 (57.4%) | 249 (91.5%) |
| 15 Years | 0 (0.0%) | 51 (49.5%) |
| 16 and 17 Years | 179 (86.5%) | 267 (73.8%) |
| 18 to 24 Years | 538 (92.8%) | 675 (82.5%) |
| 25 to 34 Years | 918 (83.2%) | 1,110 (91.0%) |
| 35 to 44 Years | 781 (87.6%) | 647 (83.9%) |
| 45 to 54 Years | 683 (81.0%) | 779 (82.3%) |
| 55 to 64 Years | 942 (99.9%) | 589 (82.0%) |
| 65 to 74 Years | 297 (100.0%) | 426 (99.5%) |
| 75 Years and over | 329 (90.6%) | 336 (87.3%) |
| Total | 5,762 (84.3%) | 6,127 (82.5%) |
Income Below Poverty Among Married-Couple Families in Livingston
The poverty statistics for married-couple families in Livingston show that 10.9% or 178 of the total 1,635 families live below the poverty line. Families with 3 or 4 children have the highest poverty rate of 26.4%, comprising of 65 families. On the other hand, families with no children have the lowest poverty rate of 0.0%, which includes 0 families.
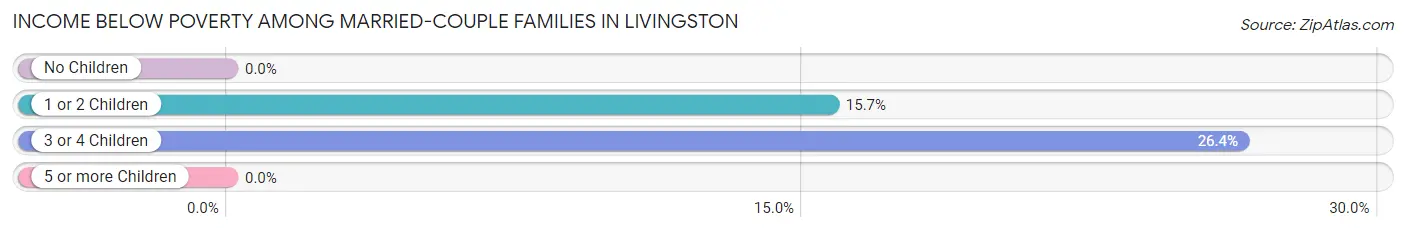
| Children | Above Poverty | Below Poverty |
| No Children | 669 (100.0%) | 0 (0.0%) |
| 1 or 2 Children | 607 (84.3%) | 113 (15.7%) |
| 3 or 4 Children | 181 (73.6%) | 65 (26.4%) |
| 5 or more Children | 0 (0.0%) | 0 (0.0%) |
| Total | 1,457 (89.1%) | 178 (10.9%) |
Income Below Poverty Among Single-Parent Households in Livingston
According to the poverty data in Livingston, 27.0% or 135 single-father households and 18.9% or 143 single-mother households are living below the poverty line. Among single-father households, those with 3 or 4 children have the highest poverty rate, with 92 households (60.1%) experiencing poverty. Likewise, among single-mother households, those with 1 or 2 children have the highest poverty rate, with 131 households (35.4%) falling below the poverty line.
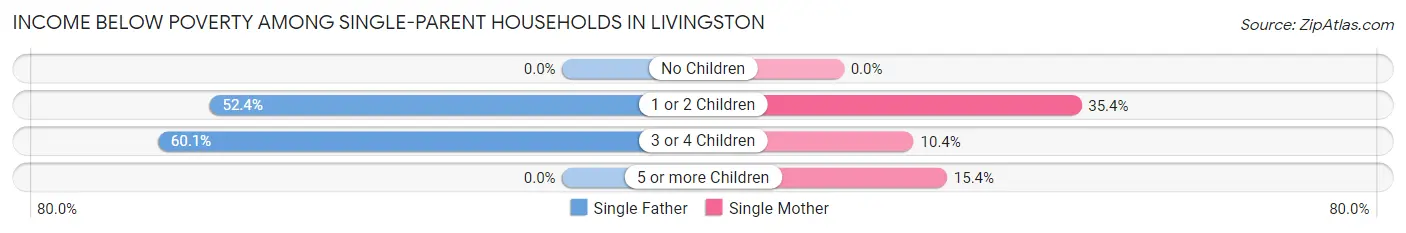
| Children | Single Father | Single Mother |
| No Children | 0 (0.0%) | 0 (0.0%) |
| 1 or 2 Children | 43 (52.4%) | 131 (35.4%) |
| 3 or 4 Children | 92 (60.1%) | 10 (10.4%) |
| 5 or more Children | 0 (0.0%) | 2 (15.4%) |
| Total | 135 (27.0%) | 143 (18.9%) |
Income Below Poverty Among Married-Couple vs Single-Parent Households in Livingston
The poverty data for Livingston shows that 178 of the married-couple family households (10.9%) and 278 of the single-parent households (22.1%) are living below the poverty level. Within the married-couple family households, those with 3 or 4 children have the highest poverty rate, with 65 households (26.4%) falling below the poverty line. Among the single-parent households, those with 3 or 4 children have the highest poverty rate, with 102 household (41.0%) living below poverty.
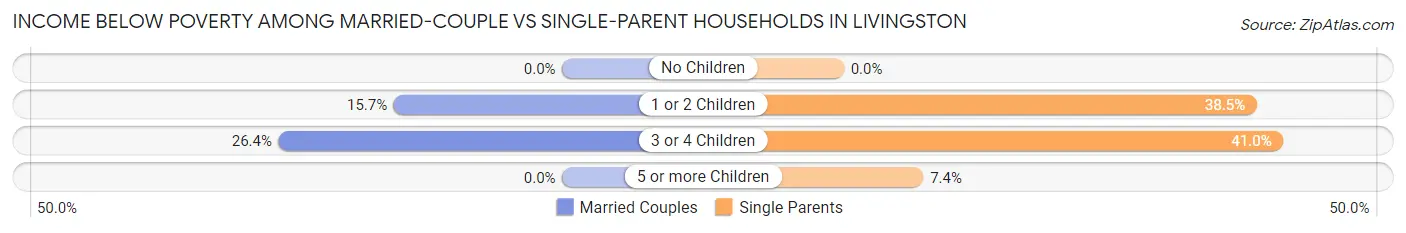
| Children | Married-Couple Families | Single-Parent Households |
| No Children | 0 (0.0%) | 0 (0.0%) |
| 1 or 2 Children | 113 (15.7%) | 174 (38.5%) |
| 3 or 4 Children | 65 (26.4%) | 102 (41.0%) |
| 5 or more Children | 0 (0.0%) | 2 (7.4%) |
| Total | 178 (10.9%) | 278 (22.1%) |
Race in Livingston
The most populous races in Livingston are Hispanic or Latino (10,386 | 72.4%), Some other Race (6,533 | 45.6%), and Asian (3,299 | 23.0%).
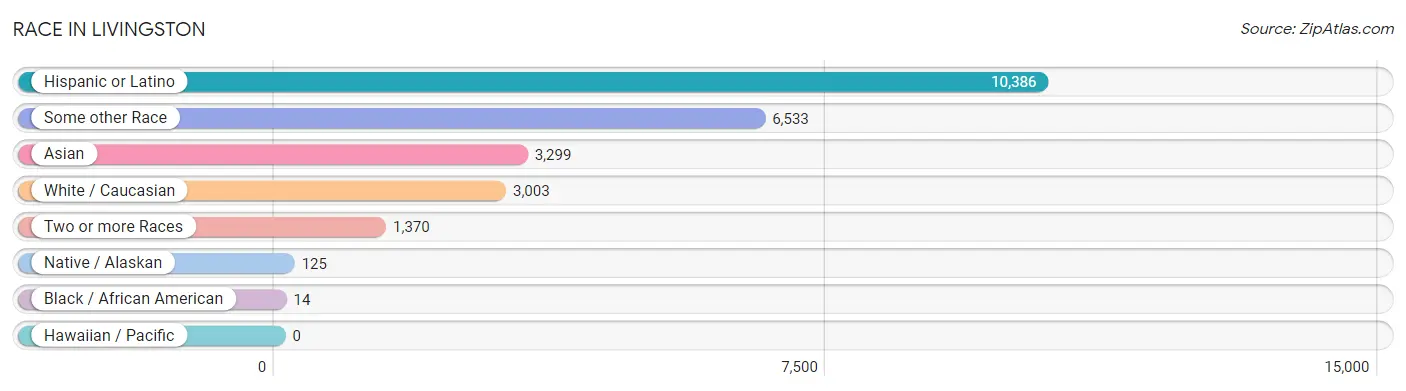
| Race | # Population | % Population |
| Asian | 3,299 | 23.0% |
| Black / African American | 14 | 0.1% |
| Hawaiian / Pacific | 0 | 0.0% |
| Hispanic or Latino | 10,386 | 72.4% |
| Native / Alaskan | 125 | 0.9% |
| White / Caucasian | 3,003 | 20.9% |
| Two or more Races | 1,370 | 9.6% |
| Some other Race | 6,533 | 45.6% |
| Total | 14,344 | 100.0% |
Ancestry in Livingston
The most populous ancestries reported in Livingston are Mexican (10,293 | 71.8%), Thai (3,050 | 21.3%), Irish (317 | 2.2%), Korean (315 | 2.2%), and Portuguese (171 | 1.2%), together accounting for 98.6% of all Livingston residents.
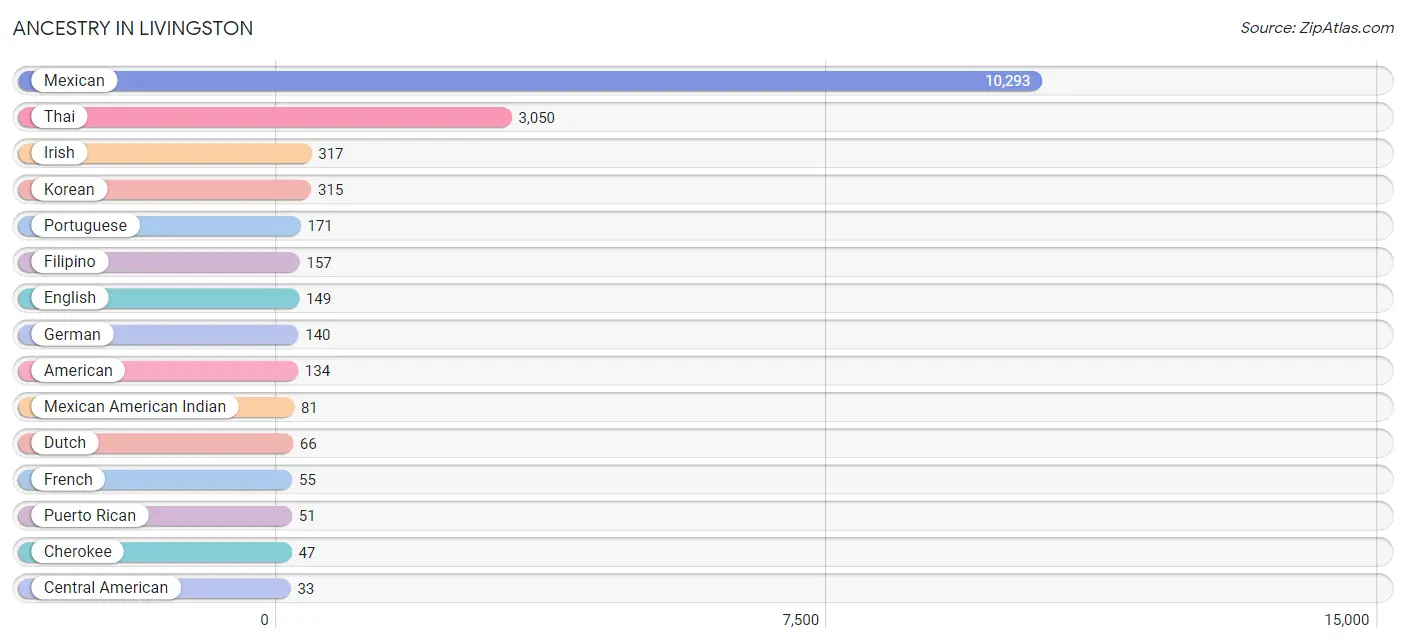
| Ancestry | # Population | % Population |
| American | 134 | 0.9% |
| Assyrian / Chaldean / Syriac | 8 | 0.1% |
| Bhutanese | 29 | 0.2% |
| Burmese | 8 | 0.1% |
| Central American | 33 | 0.2% |
| Cherokee | 47 | 0.3% |
| Colombian | 1 | 0.0% |
| Danish | 18 | 0.1% |
| Dutch | 66 | 0.5% |
| English | 149 | 1.0% |
| Filipino | 157 | 1.1% |
| French | 55 | 0.4% |
| German | 140 | 1.0% |
| Irish | 317 | 2.2% |
| Italian | 29 | 0.2% |
| Korean | 315 | 2.2% |
| Mexican | 10,293 | 71.8% |
| Mexican American Indian | 81 | 0.6% |
| Norwegian | 8 | 0.1% |
| Polish | 14 | 0.1% |
| Portuguese | 171 | 1.2% |
| Puerto Rican | 51 | 0.4% |
| Salvadoran | 33 | 0.2% |
| Scandinavian | 1 | 0.0% |
| Scottish | 16 | 0.1% |
| South American | 1 | 0.0% |
| Spaniard | 8 | 0.1% |
| Thai | 3,050 | 21.3% | View All 28 Rows |
Immigrants in Livingston
The most numerous immigrant groups reported in Livingston came from Latin America (3,230 | 22.5%), Central America (3,229 | 22.5%), Mexico (3,196 | 22.3%), Asia (2,387 | 16.6%), and India (2,119 | 14.8%), together accounting for 98.7% of all Livingston residents.
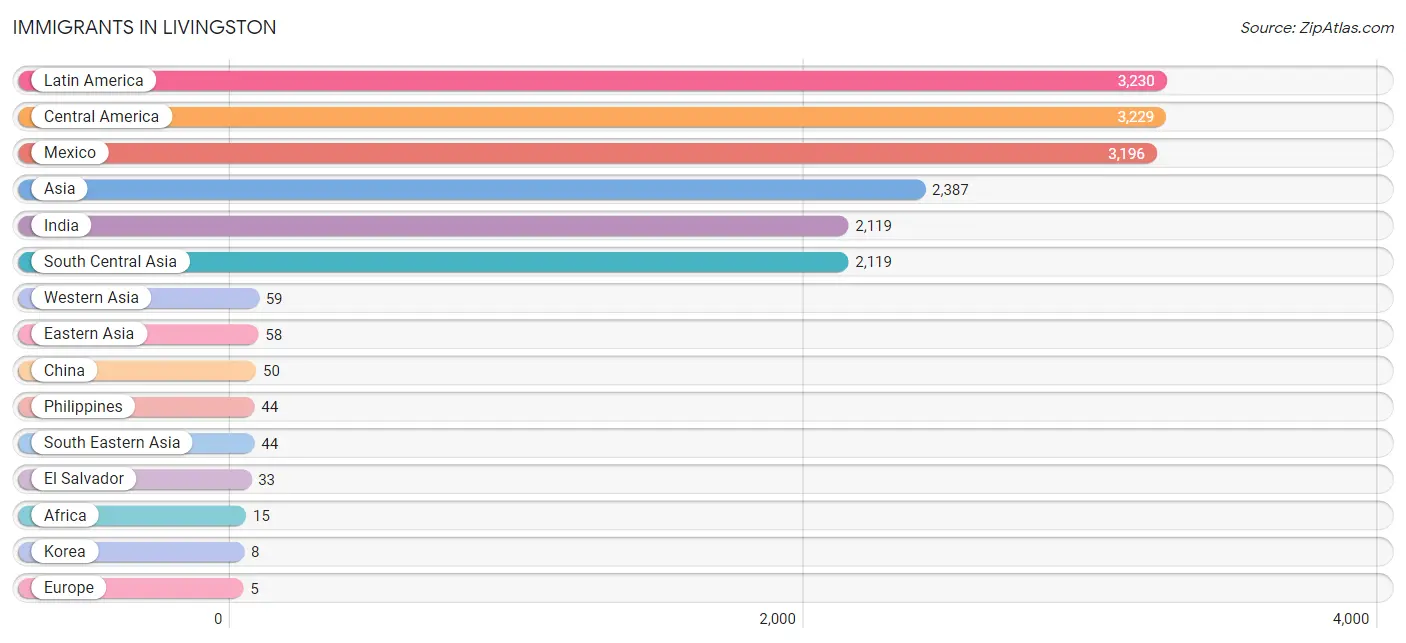
| Immigration Origin | # Population | % Population |
| Africa | 15 | 0.1% |
| Asia | 2,387 | 16.6% |
| Central America | 3,229 | 22.5% |
| China | 50 | 0.4% |
| Colombia | 1 | 0.0% |
| Eastern Asia | 58 | 0.4% |
| El Salvador | 33 | 0.2% |
| Europe | 5 | 0.0% |
| India | 2,119 | 14.8% |
| Korea | 8 | 0.1% |
| Latin America | 3,230 | 22.5% |
| Mexico | 3,196 | 22.3% |
| Philippines | 44 | 0.3% |
| Portugal | 5 | 0.0% |
| South America | 1 | 0.0% |
| South Central Asia | 2,119 | 14.8% |
| South Eastern Asia | 44 | 0.3% |
| Southern Europe | 5 | 0.0% |
| Western Asia | 59 | 0.4% | View All 19 Rows |
Sex and Age in Livingston
Sex and Age in Livingston
The most populous age groups in Livingston are 10 to 14 Years (683 | 10.0%) for men and 15 to 19 Years (702 | 9.4%) for women.
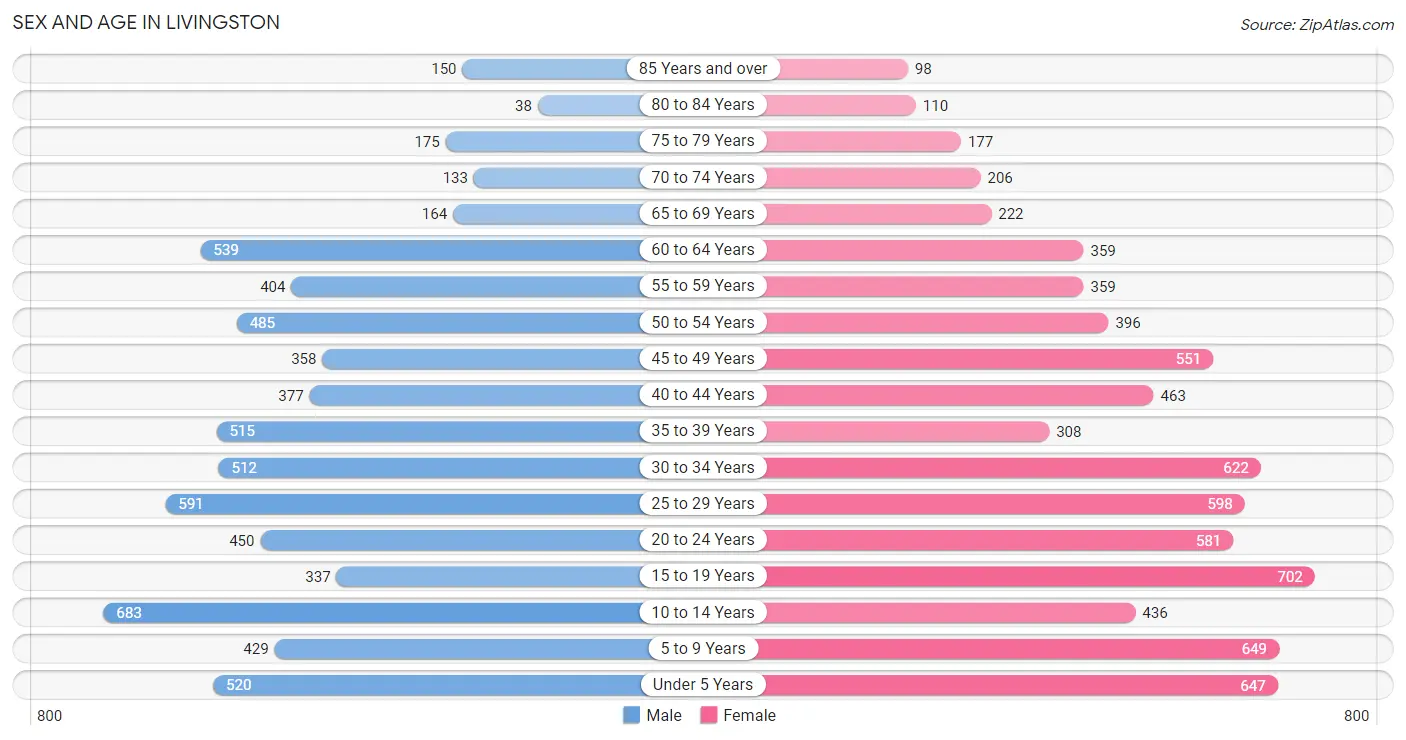
| Age Bracket | Male | Female |
| Under 5 Years | 520 (7.6%) | 647 (8.6%) |
| 5 to 9 Years | 429 (6.2%) | 649 (8.7%) |
| 10 to 14 Years | 683 (10.0%) | 436 (5.8%) |
| 15 to 19 Years | 337 (4.9%) | 702 (9.4%) |
| 20 to 24 Years | 450 (6.6%) | 581 (7.8%) |
| 25 to 29 Years | 591 (8.6%) | 598 (8.0%) |
| 30 to 34 Years | 512 (7.5%) | 622 (8.3%) |
| 35 to 39 Years | 515 (7.5%) | 308 (4.1%) |
| 40 to 44 Years | 377 (5.5%) | 463 (6.2%) |
| 45 to 49 Years | 358 (5.2%) | 551 (7.4%) |
| 50 to 54 Years | 485 (7.1%) | 396 (5.3%) |
| 55 to 59 Years | 404 (5.9%) | 359 (4.8%) |
| 60 to 64 Years | 539 (7.9%) | 359 (4.8%) |
| 65 to 69 Years | 164 (2.4%) | 222 (3.0%) |
| 70 to 74 Years | 133 (1.9%) | 206 (2.8%) |
| 75 to 79 Years | 175 (2.5%) | 177 (2.4%) |
| 80 to 84 Years | 38 (0.5%) | 110 (1.5%) |
| 85 Years and over | 150 (2.2%) | 98 (1.3%) |
| Total | 6,860 (100.0%) | 7,484 (100.0%) |
Families and Households in Livingston
Median Family Size in Livingston
The median family size in Livingston is 4.55 persons per family, with married-couple families (1,635 | 56.5%) accounting for the largest median family size of 5.03 persons per family. On the other hand, single male/father families (501 | 17.3%) represent the smallest median family size with 3.88 persons per family.
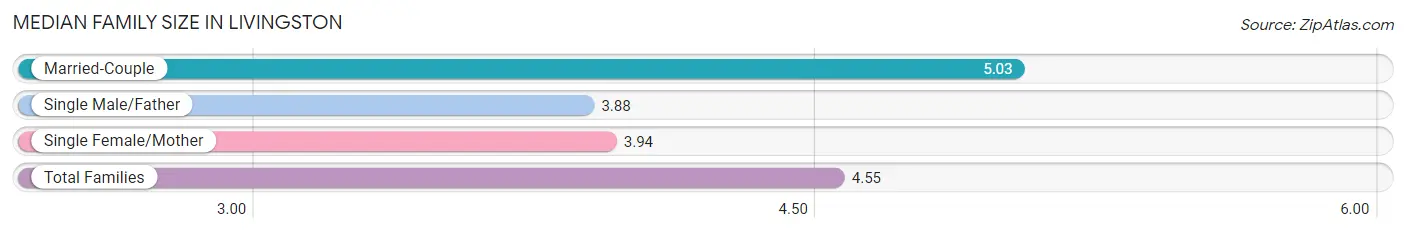
| Family Type | # Families | Family Size |
| Married-Couple | 1,635 (56.5%) | 5.03 |
| Single Male/Father | 501 (17.3%) | 3.88 |
| Single Female/Mother | 758 (26.2%) | 3.94 |
| Total Families | 2,894 (100.0%) | 4.55 |
Median Household Size in Livingston
The median household size in Livingston is 4.28 persons per household, with married-couple households (1,635 | 48.8%) accounting for the largest median household size of 5.11 persons per household. non-family households (454 | 13.6%) represent the smallest median household size with 1.30 persons per household.
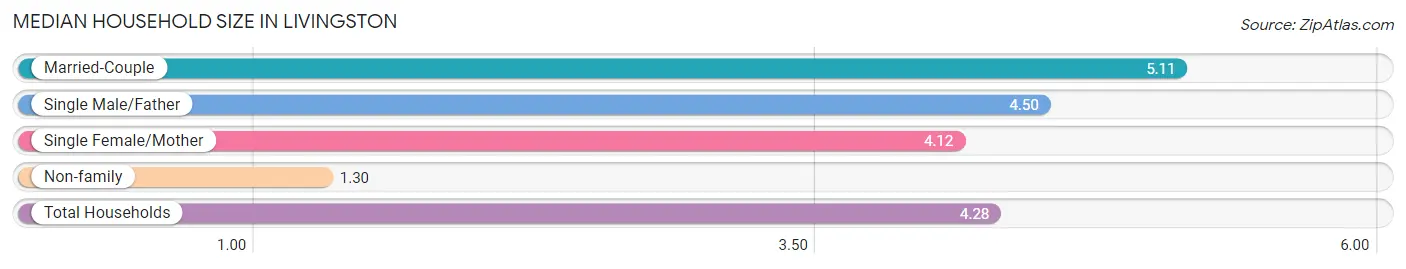
| Household Type | # Households | Household Size |
| Married-Couple | 1,635 (48.8%) | 5.11 |
| Single Male/Father | 501 (15.0%) | 4.50 |
| Single Female/Mother | 758 (22.6%) | 4.12 |
| Non-family | 454 (13.6%) | 1.30 |
| Total Households | 3,348 (100.0%) | 4.28 |
Household Size by Marriage Status in Livingston
Out of a total of 3,348 households in Livingston, 2,894 (86.4%) are family households, while 454 (13.6%) are nonfamily households. The most numerous type of family households are 3-person households, comprising 706, and the most common type of nonfamily households are 1-person households, comprising 377.
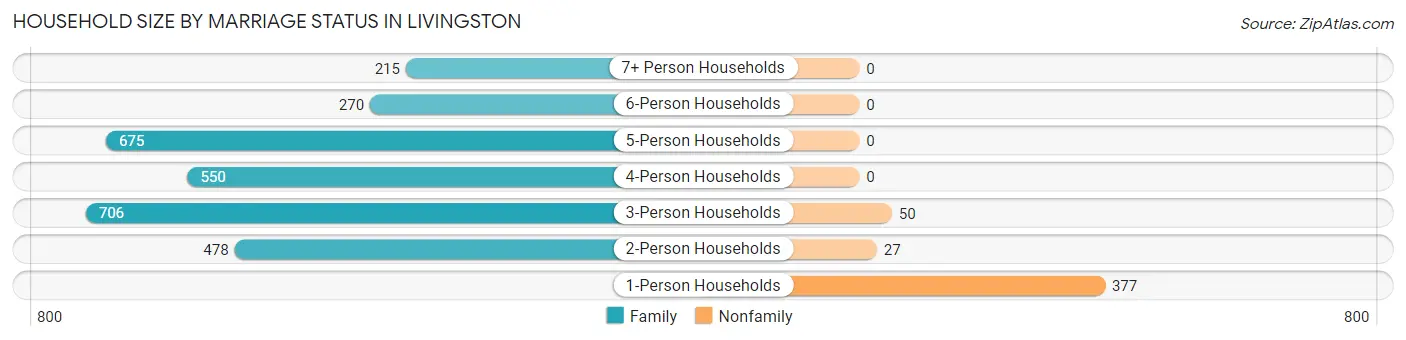
| Household Size | Family Households | Nonfamily Households |
| 1-Person Households | - | 377 (11.3%) |
| 2-Person Households | 478 (14.3%) | 27 (0.8%) |
| 3-Person Households | 706 (21.1%) | 50 (1.5%) |
| 4-Person Households | 550 (16.4%) | 0 (0.0%) |
| 5-Person Households | 675 (20.2%) | 0 (0.0%) |
| 6-Person Households | 270 (8.1%) | 0 (0.0%) |
| 7+ Person Households | 215 (6.4%) | 0 (0.0%) |
| Total | 2,894 (86.4%) | 454 (13.6%) |
Female Fertility in Livingston
Fertility by Age in Livingston
Average fertility rate in Livingston is 64.0 births per 1,000 women. Women in the age bracket of 20 to 34 years have the highest fertility rate with 135.0 births per 1,000 women. Women in the age bracket of 20 to 34 years acount for 100.0% of all women with births.
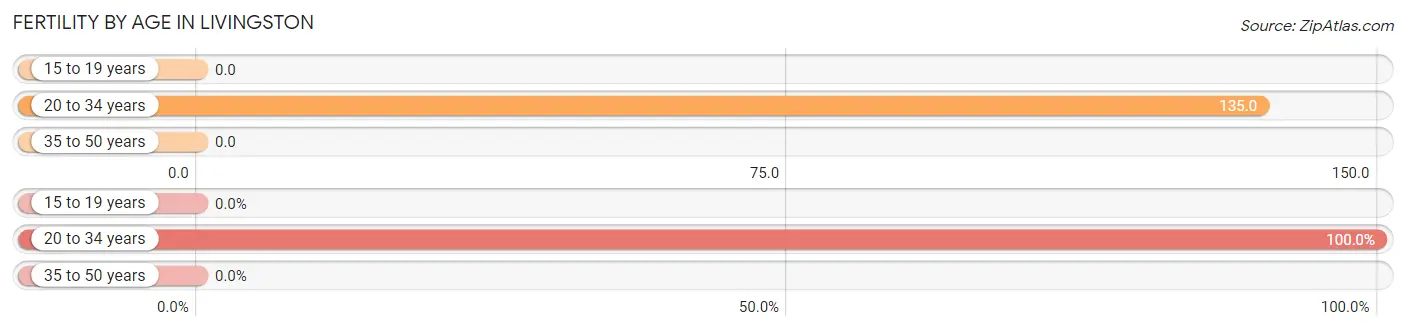
| Age Bracket | Women with Births | Births / 1,000 Women |
| 15 to 19 years | 0 (0.0%) | 0.0 |
| 20 to 34 years | 244 (100.0%) | 135.0 |
| 35 to 50 years | 0 (0.0%) | 0.0 |
| Total | 244 (100.0%) | 64.0 |
Fertility by Age by Marriage Status in Livingston
43.4% of women with births (244) in Livingston are married. The highest percentage of unmarried women with births falls into 20 to 34 years age bracket with 56.6% of them unmarried at the time of birth, while the lowest percentage of unmarried women with births belong to 20 to 34 years age bracket with 56.6% of them unmarried.
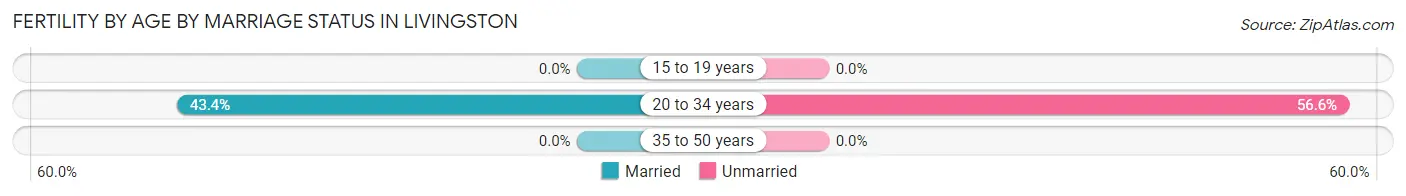
| Age Bracket | Married | Unmarried |
| 15 to 19 years | 0 (0.0%) | 0 (0.0%) |
| 20 to 34 years | 106 (43.4%) | 138 (56.6%) |
| 35 to 50 years | 0 (0.0%) | 0 (0.0%) |
| Total | 106 (43.4%) | 138 (56.6%) |
Fertility by Education in Livingston
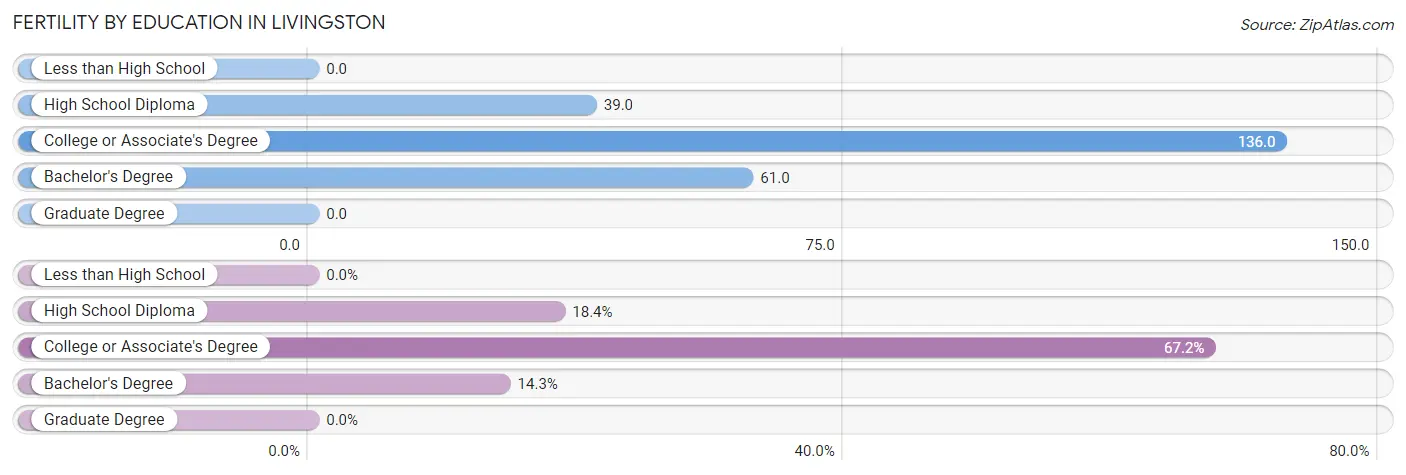
| Educational Attainment | Women with Births | Births / 1,000 Women |
| Less than High School | 0 (0.0%) | 0.0 |
| High School Diploma | 45 (18.4%) | 39.0 |
| College or Associate's Degree | 164 (67.2%) | 136.0 |
| Bachelor's Degree | 35 (14.3%) | 61.0 |
| Graduate Degree | 0 (0.0%) | 0.0 |
| Total | 244 (100.0%) | 64.0 |
Fertility by Education by Marriage Status in Livingston
56.6% of women with births in Livingston are unmarried. Women with the educational attainment of bachelor's degree are most likely to be married with 100.0% of them married at childbirth, while women with the educational attainment of high school diploma are least likely to be married with 82.2% of them unmarried at childbirth.
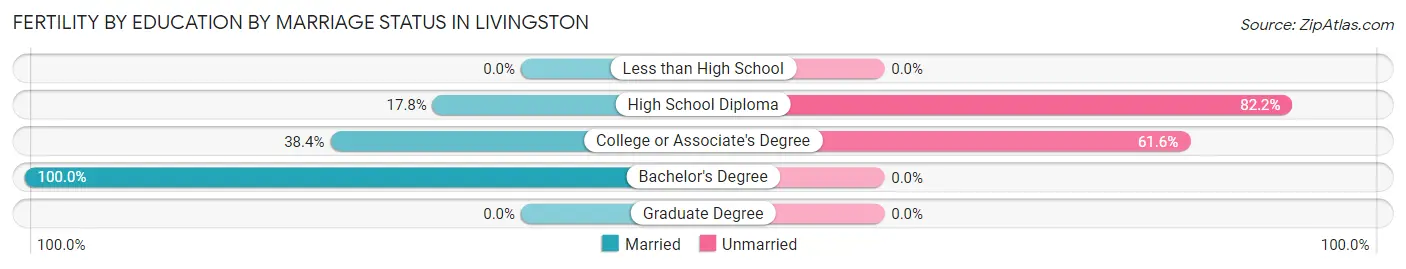
| Educational Attainment | Married | Unmarried |
| Less than High School | 0 (0.0%) | 0 (0.0%) |
| High School Diploma | 8 (17.8%) | 37 (82.2%) |
| College or Associate's Degree | 63 (38.4%) | 101 (61.6%) |
| Bachelor's Degree | 35 (100.0%) | 0 (0.0%) |
| Graduate Degree | 0 (0.0%) | 0 (0.0%) |
| Total | 106 (43.4%) | 138 (56.6%) |
Employment Characteristics in Livingston
Employment by Class of Employer in Livingston
Among the 5,852 employed individuals in Livingston, private company employees (4,323 | 73.9%), local government employees (530 | 9.1%), and self-employed (not incorporated) (431 | 7.4%) make up the most common classes of employment.
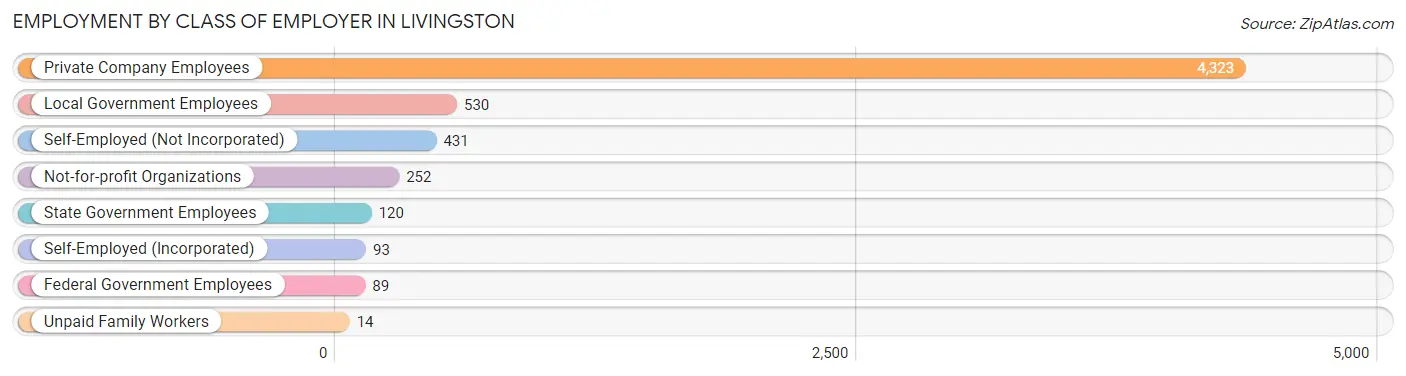
| Employer Class | # Employees | % Employees |
| Private Company Employees | 4,323 | 73.9% |
| Self-Employed (Incorporated) | 93 | 1.6% |
| Self-Employed (Not Incorporated) | 431 | 7.4% |
| Not-for-profit Organizations | 252 | 4.3% |
| Local Government Employees | 530 | 9.1% |
| State Government Employees | 120 | 2.1% |
| Federal Government Employees | 89 | 1.5% |
| Unpaid Family Workers | 14 | 0.2% |
| Total | 5,852 | 100.0% |
Employment Status by Age in Livingston
According to the labor force statistics for Livingston, out of the total population over 16 years of age (10,877), 63.7% or 6,929 individuals are in the labor force, with 10.1% or 700 of them unemployed. The age group with the highest labor force participation rate is 55 to 59 years, with 85.1% or 649 individuals in the labor force. Within the labor force, the 16 to 19 years age range has the highest percentage of unemployed individuals, with 24.7% or 84 of them being unemployed.
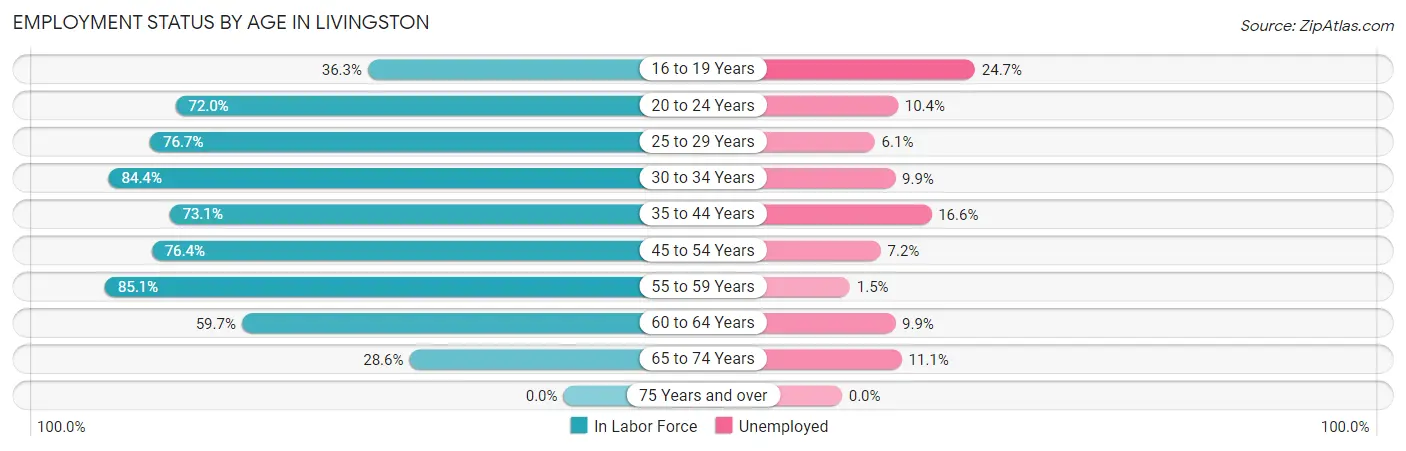
| Age Bracket | In Labor Force | Unemployed |
| 16 to 19 Years | 340 (36.3%) | 84 (24.7%) |
| 20 to 24 Years | 742 (72.0%) | 77 (10.4%) |
| 25 to 29 Years | 912 (76.7%) | 56 (6.1%) |
| 30 to 34 Years | 957 (84.4%) | 95 (9.9%) |
| 35 to 44 Years | 1,216 (73.1%) | 202 (16.6%) |
| 45 to 54 Years | 1,368 (76.4%) | 98 (7.2%) |
| 55 to 59 Years | 649 (85.1%) | 10 (1.5%) |
| 60 to 64 Years | 536 (59.7%) | 53 (9.9%) |
| 65 to 74 Years | 207 (28.6%) | 23 (11.1%) |
| 75 Years and over | 0 (0.0%) | 0 (0.0%) |
| Total | 6,929 (63.7%) | 700 (10.1%) |
Employment Status by Educational Attainment in Livingston
According to labor force statistics for Livingston, 75.8% of individuals (5,637) out of the total population between 25 and 64 years of age (7,437) are in the labor force, with 9.1% or 513 of them being unemployed. The group with the highest labor force participation rate are those with the educational attainment of bachelor's degree or higher, with 91.0% or 830 individuals in the labor force. Within the labor force, individuals with high school diploma education have the highest percentage of unemployment, with 16.3% or 245 of them being unemployed.
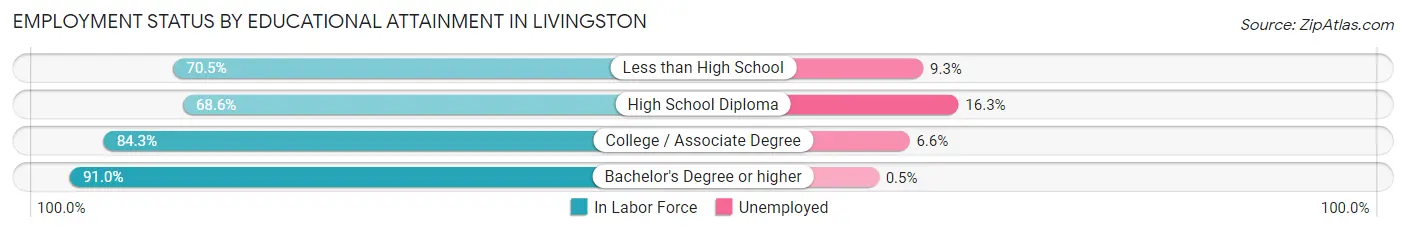
| Educational Attainment | In Labor Force | Unemployed |
| Less than High School | 1,784 (70.5%) | 235 (9.3%) |
| High School Diploma | 1,501 (68.6%) | 357 (16.3%) |
| College / Associate Degree | 1,523 (84.3%) | 119 (6.6%) |
| Bachelor's Degree or higher | 830 (91.0%) | 5 (0.5%) |
| Total | 5,637 (75.8%) | 677 (9.1%) |
Employment Occupations by Sex in Livingston
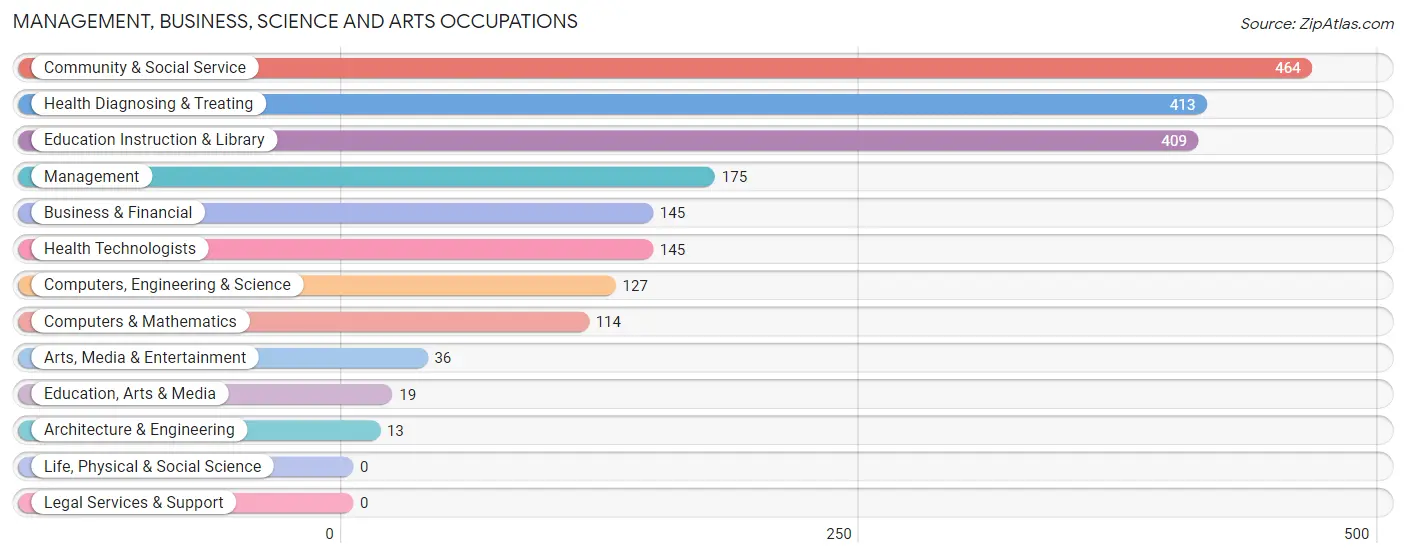
Management, Business, Science and Arts Occupations
The most common Management, Business, Science and Arts occupations in Livingston are Community & Social Service (464 | 7.4%), Health Diagnosing & Treating (413 | 6.6%), Education Instruction & Library (409 | 6.6%), Management (175 | 2.8%), and Business & Financial (145 | 2.3%).
Management, Business, Science and Arts Occupations by Sex
Within the Management, Business, Science and Arts occupations in Livingston, the most male-oriented occupations are Management (90.9%), Business & Financial (82.1%), and Computers & Mathematics (57.9%), while the most female-oriented occupations are Architecture & Engineering (100.0%), Education, Arts & Media (100.0%), and Community & Social Service (81.2%).
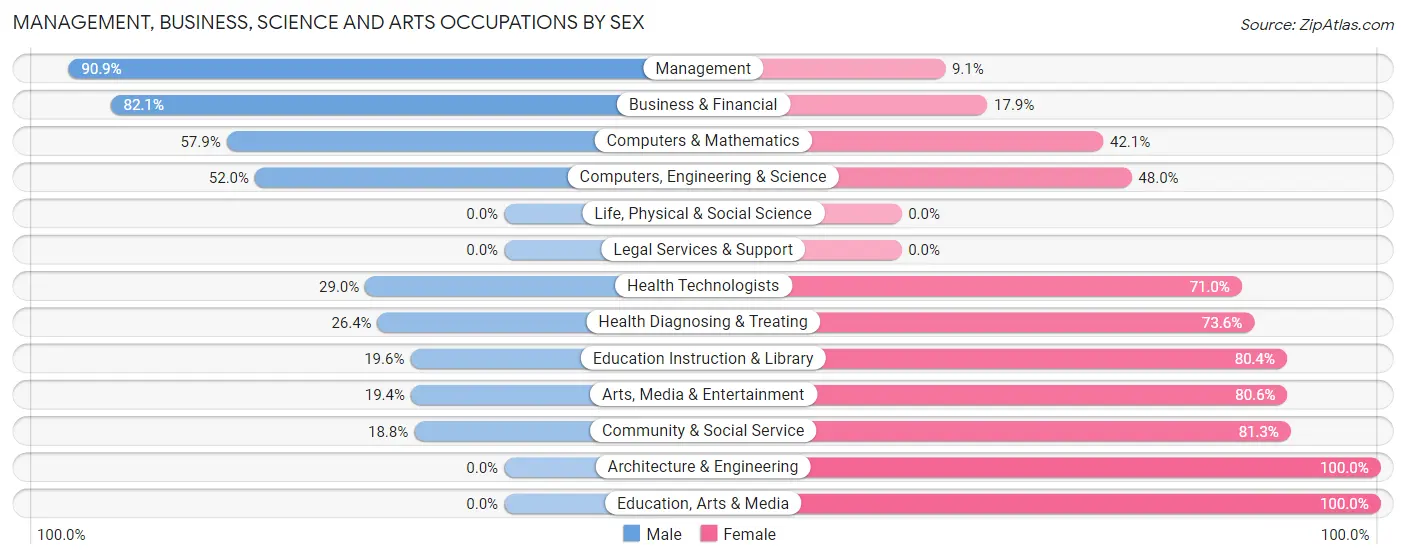
| Occupation | Male | Female |
| Management | 159 (90.9%) | 16 (9.1%) |
| Business & Financial | 119 (82.1%) | 26 (17.9%) |
| Computers, Engineering & Science | 66 (52.0%) | 61 (48.0%) |
| Computers & Mathematics | 66 (57.9%) | 48 (42.1%) |
| Architecture & Engineering | 0 (0.0%) | 13 (100.0%) |
| Life, Physical & Social Science | 0 (0.0%) | 0 (0.0%) |
| Community & Social Service | 87 (18.8%) | 377 (81.2%) |
| Education, Arts & Media | 0 (0.0%) | 19 (100.0%) |
| Legal Services & Support | 0 (0.0%) | 0 (0.0%) |
| Education Instruction & Library | 80 (19.6%) | 329 (80.4%) |
| Arts, Media & Entertainment | 7 (19.4%) | 29 (80.6%) |
| Health Diagnosing & Treating | 109 (26.4%) | 304 (73.6%) |
| Health Technologists | 42 (29.0%) | 103 (71.0%) |
| Total (Category) | 540 (40.8%) | 784 (59.2%) |
| Total (Overall) | 3,527 (56.6%) | 2,700 (43.4%) |
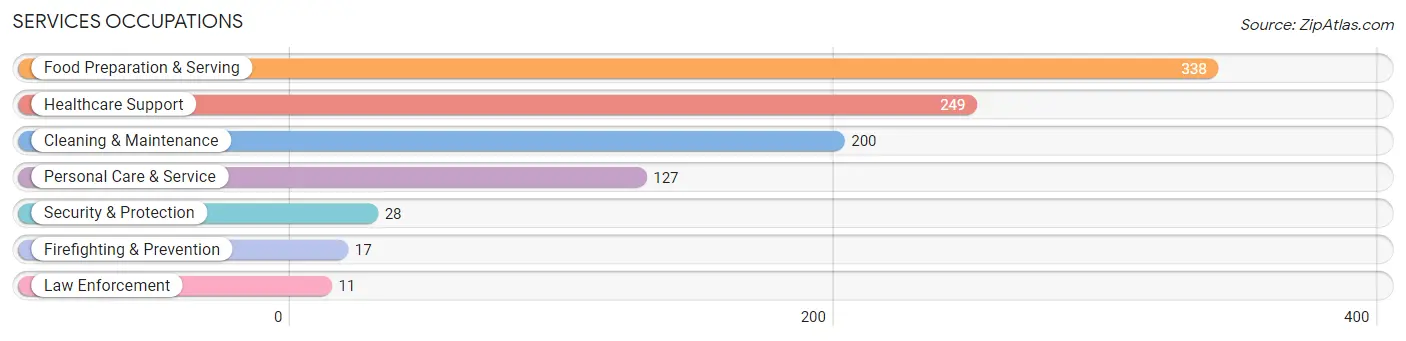
Services Occupations
The most common Services occupations in Livingston are Food Preparation & Serving (338 | 5.4%), Healthcare Support (249 | 4.0%), Cleaning & Maintenance (200 | 3.2%), Personal Care & Service (127 | 2.0%), and Security & Protection (28 | 0.4%).
Services Occupations by Sex
Within the Services occupations in Livingston, the most male-oriented occupations are Law Enforcement (100.0%), Cleaning & Maintenance (97.5%), and Security & Protection (71.4%), while the most female-oriented occupations are Personal Care & Service (100.0%), Healthcare Support (89.2%), and Food Preparation & Serving (63.6%).
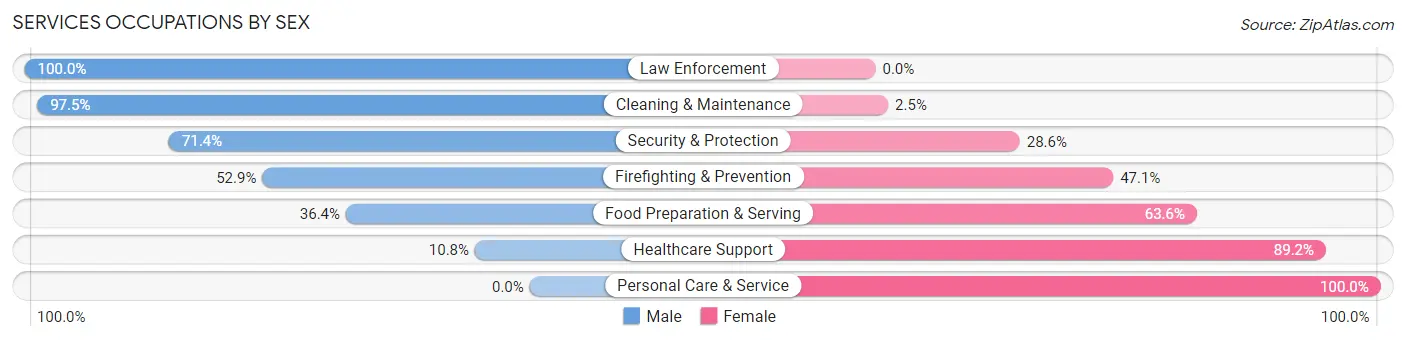
| Occupation | Male | Female |
| Healthcare Support | 27 (10.8%) | 222 (89.2%) |
| Security & Protection | 20 (71.4%) | 8 (28.6%) |
| Firefighting & Prevention | 9 (52.9%) | 8 (47.1%) |
| Law Enforcement | 11 (100.0%) | 0 (0.0%) |
| Food Preparation & Serving | 123 (36.4%) | 215 (63.6%) |
| Cleaning & Maintenance | 195 (97.5%) | 5 (2.5%) |
| Personal Care & Service | 0 (0.0%) | 127 (100.0%) |
| Total (Category) | 365 (38.8%) | 577 (61.3%) |
| Total (Overall) | 3,527 (56.6%) | 2,700 (43.4%) |
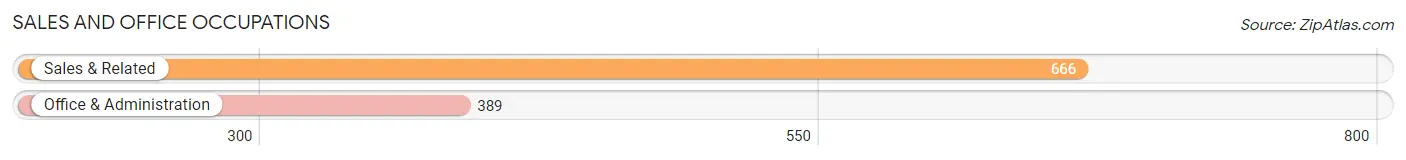
Sales and Office Occupations
The most common Sales and Office occupations in Livingston are Sales & Related (666 | 10.7%), and Office & Administration (389 | 6.2%).
Sales and Office Occupations by Sex
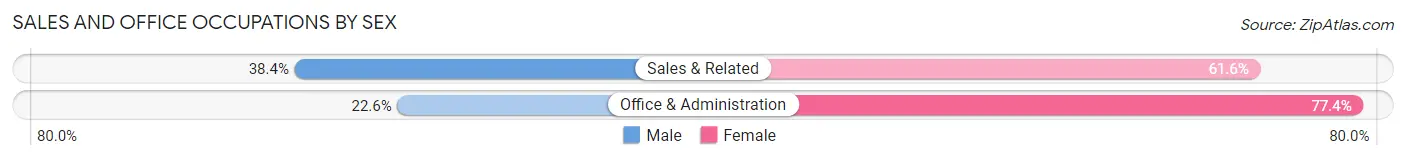
| Occupation | Male | Female |
| Sales & Related | 256 (38.4%) | 410 (61.6%) |
| Office & Administration | 88 (22.6%) | 301 (77.4%) |
| Total (Category) | 344 (32.6%) | 711 (67.4%) |
| Total (Overall) | 3,527 (56.6%) | 2,700 (43.4%) |
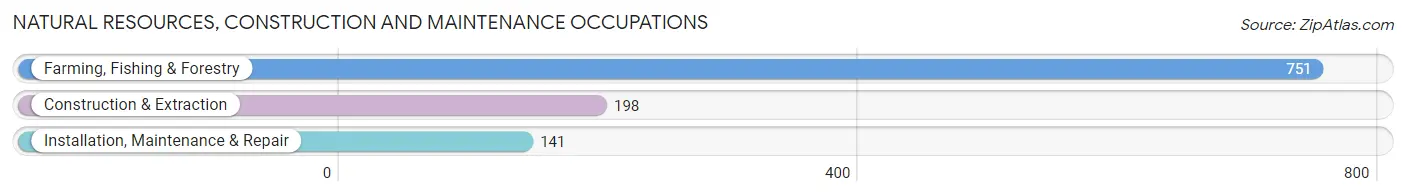
Natural Resources, Construction and Maintenance Occupations
The most common Natural Resources, Construction and Maintenance occupations in Livingston are Farming, Fishing & Forestry (751 | 12.1%), Construction & Extraction (198 | 3.2%), and Installation, Maintenance & Repair (141 | 2.3%).
Natural Resources, Construction and Maintenance Occupations by Sex
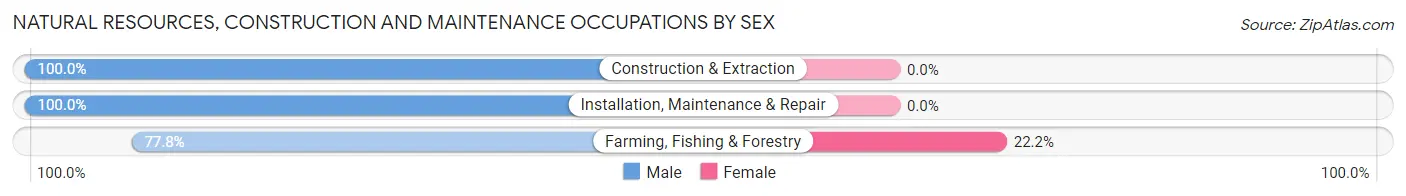
| Occupation | Male | Female |
| Farming, Fishing & Forestry | 584 (77.8%) | 167 (22.2%) |
| Construction & Extraction | 198 (100.0%) | 0 (0.0%) |
| Installation, Maintenance & Repair | 141 (100.0%) | 0 (0.0%) |
| Total (Category) | 923 (84.7%) | 167 (15.3%) |
| Total (Overall) | 3,527 (56.6%) | 2,700 (43.4%) |
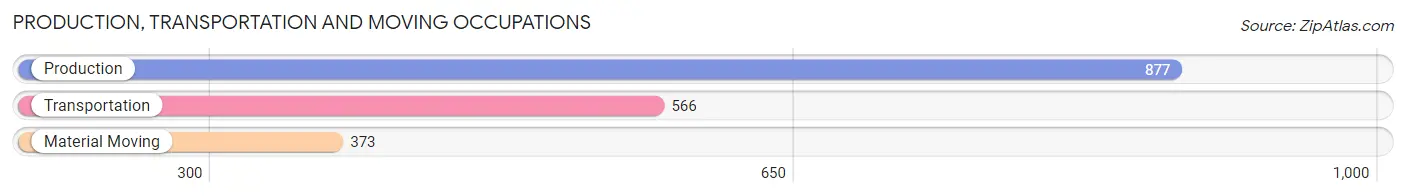
Production, Transportation and Moving Occupations
The most common Production, Transportation and Moving occupations in Livingston are Production (877 | 14.1%), Transportation (566 | 9.1%), and Material Moving (373 | 6.0%).
Production, Transportation and Moving Occupations by Sex
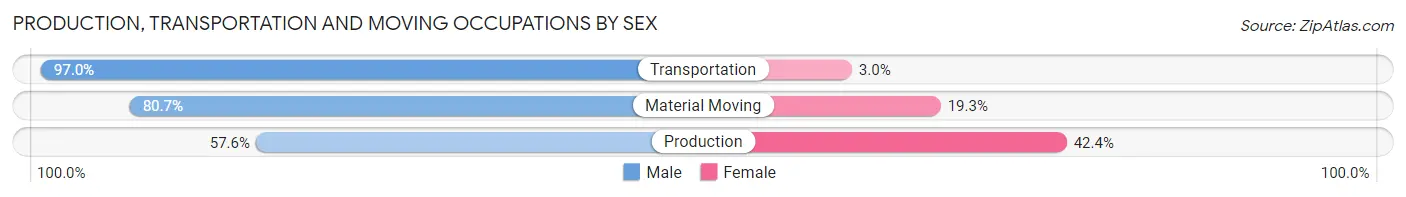
| Occupation | Male | Female |
| Production | 505 (57.6%) | 372 (42.4%) |
| Transportation | 549 (97.0%) | 17 (3.0%) |
| Material Moving | 301 (80.7%) | 72 (19.3%) |
| Total (Category) | 1,355 (74.6%) | 461 (25.4%) |
| Total (Overall) | 3,527 (56.6%) | 2,700 (43.4%) |
Employment Industries by Sex in Livingston
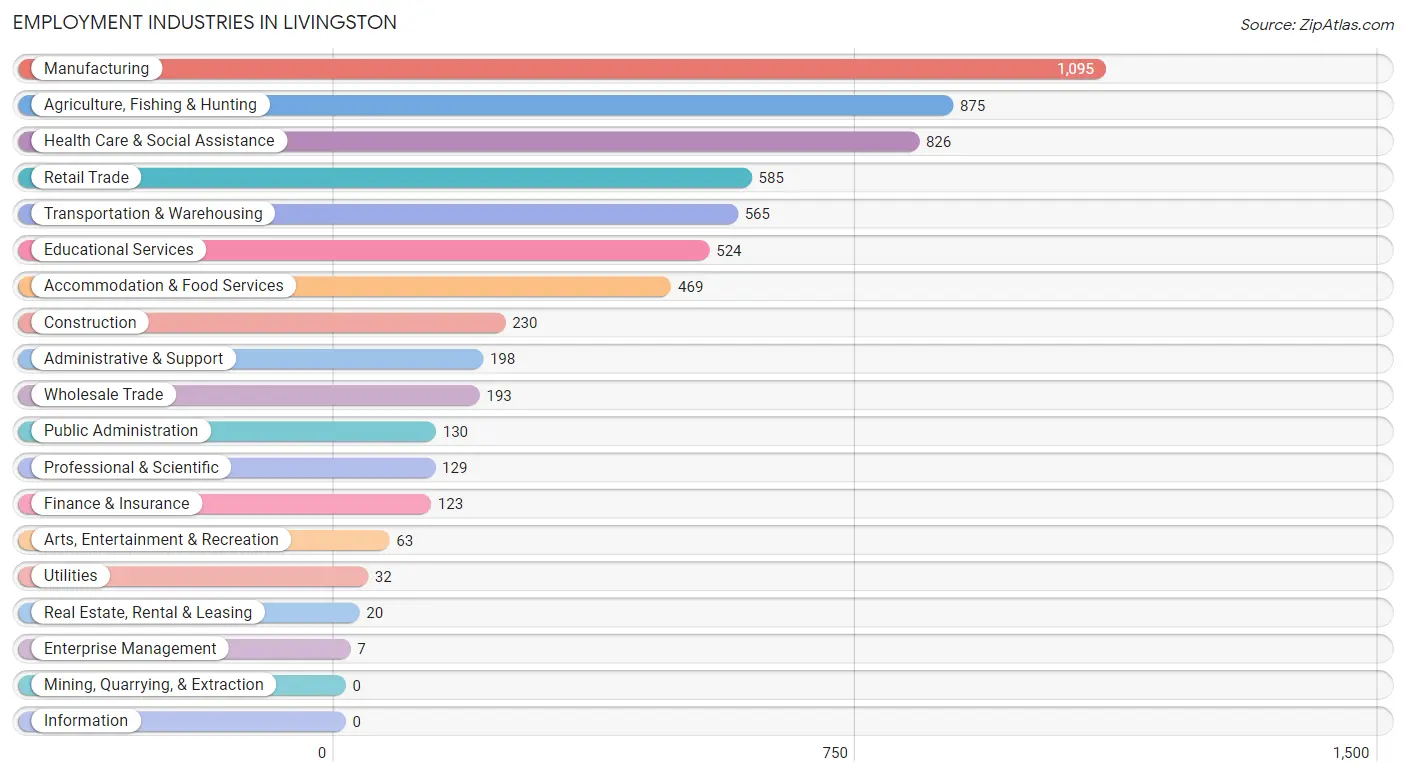
Employment Industries in Livingston
The major employment industries in Livingston include Manufacturing (1,095 | 17.6%), Agriculture, Fishing & Hunting (875 | 14.1%), Health Care & Social Assistance (826 | 13.3%), Retail Trade (585 | 9.4%), and Transportation & Warehousing (565 | 9.1%).
Employment Industries by Sex in Livingston
The Livingston industries that see more men than women are Utilities (100.0%), Finance & Insurance (95.1%), and Construction (93.0%), whereas the industries that tend to have a higher number of women are Real Estate, Rental & Leasing (100.0%), Professional & Scientific (100.0%), and Enterprise Management (100.0%).
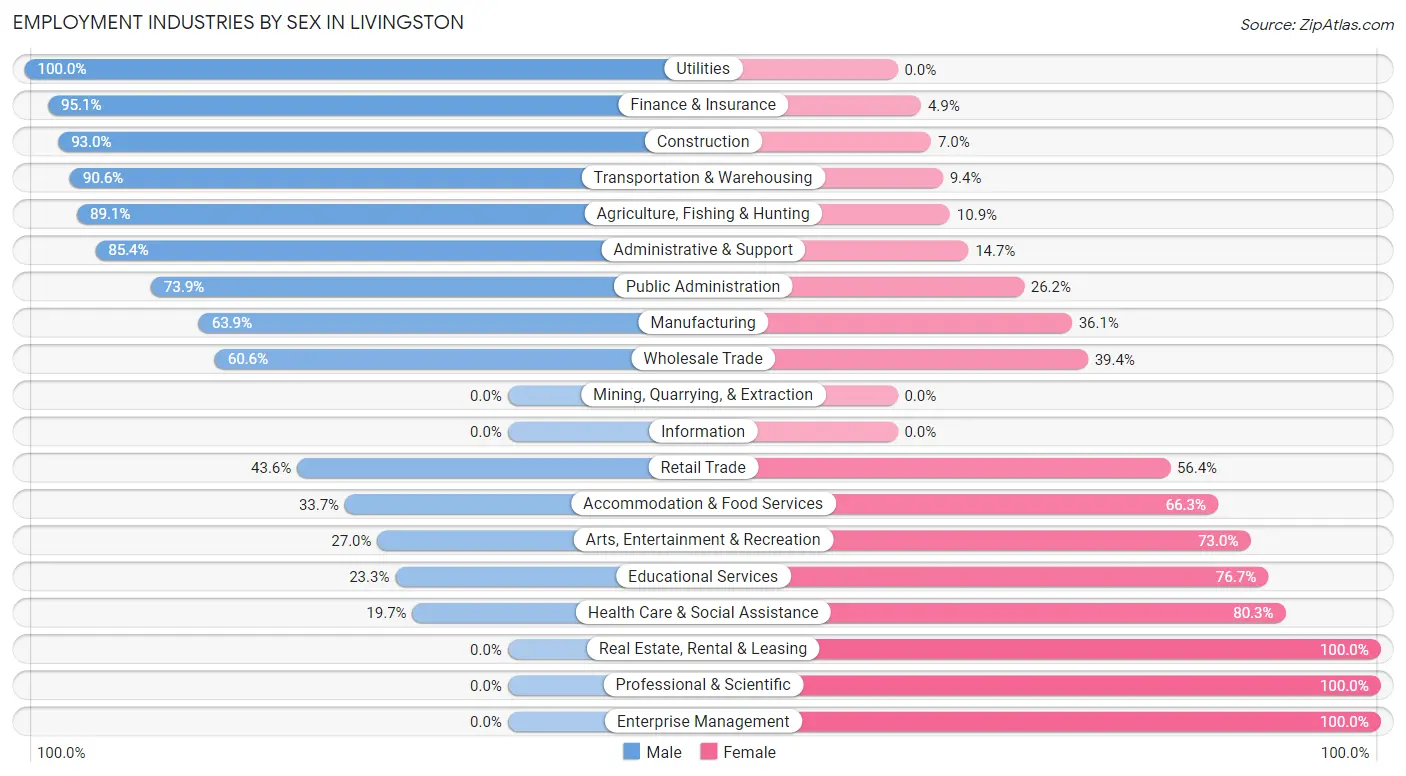
| Industry | Male | Female |
| Agriculture, Fishing & Hunting | 780 (89.1%) | 95 (10.9%) |
| Mining, Quarrying, & Extraction | 0 (0.0%) | 0 (0.0%) |
| Construction | 214 (93.0%) | 16 (7.0%) |
| Manufacturing | 700 (63.9%) | 395 (36.1%) |
| Wholesale Trade | 117 (60.6%) | 76 (39.4%) |
| Retail Trade | 255 (43.6%) | 330 (56.4%) |
| Transportation & Warehousing | 512 (90.6%) | 53 (9.4%) |
| Utilities | 32 (100.0%) | 0 (0.0%) |
| Information | 0 (0.0%) | 0 (0.0%) |
| Finance & Insurance | 117 (95.1%) | 6 (4.9%) |
| Real Estate, Rental & Leasing | 0 (0.0%) | 20 (100.0%) |
| Professional & Scientific | 0 (0.0%) | 129 (100.0%) |
| Enterprise Management | 0 (0.0%) | 7 (100.0%) |
| Administrative & Support | 169 (85.4%) | 29 (14.6%) |
| Educational Services | 122 (23.3%) | 402 (76.7%) |
| Health Care & Social Assistance | 163 (19.7%) | 663 (80.3%) |
| Arts, Entertainment & Recreation | 17 (27.0%) | 46 (73.0%) |
| Accommodation & Food Services | 158 (33.7%) | 311 (66.3%) |
| Public Administration | 96 (73.9%) | 34 (26.2%) |
| Total | 3,527 (56.6%) | 2,700 (43.4%) |
Education in Livingston
School Enrollment in Livingston
The most common levels of schooling among the 3,915 students in Livingston are high school (984 | 25.1%), elementary school (876 | 22.4%), and college / undergraduate (871 | 22.3%).
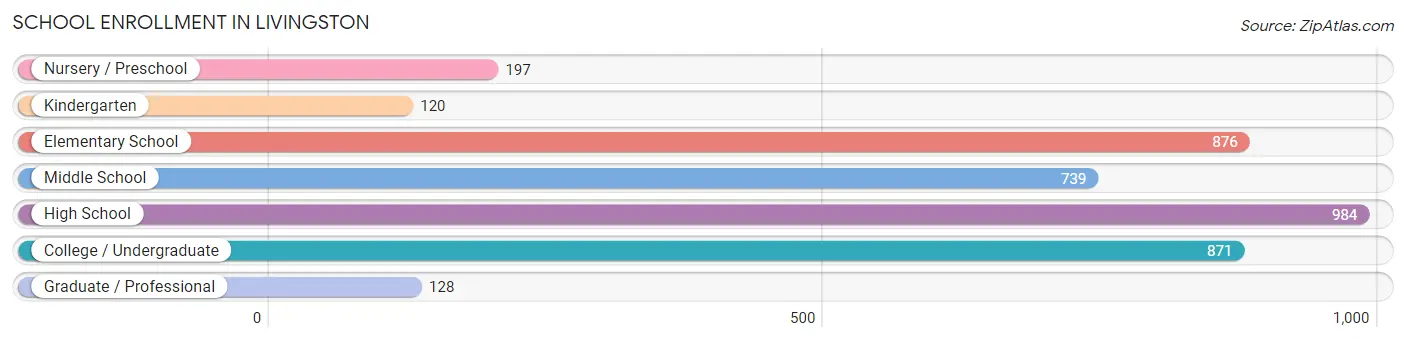
| School Level | # Students | % Students |
| Nursery / Preschool | 197 | 5.0% |
| Kindergarten | 120 | 3.1% |
| Elementary School | 876 | 22.4% |
| Middle School | 739 | 18.9% |
| High School | 984 | 25.1% |
| College / Undergraduate | 871 | 22.3% |
| Graduate / Professional | 128 | 3.3% |
| Total | 3,915 | 100.0% |
School Enrollment by Age by Funding Source in Livingston
Out of a total of 3,915 students who are enrolled in schools in Livingston, 200 (5.1%) attend a private institution, while the remaining 3,715 (94.9%) are enrolled in public schools. The age group of 35 years and over has the highest likelihood of being enrolled in private schools, with 7 (58.3% in the age bracket) enrolled. Conversely, the age group of 5 to 9 year old has the lowest likelihood of being enrolled in a private school, with 961 (100.0% in the age bracket) attending a public institution.
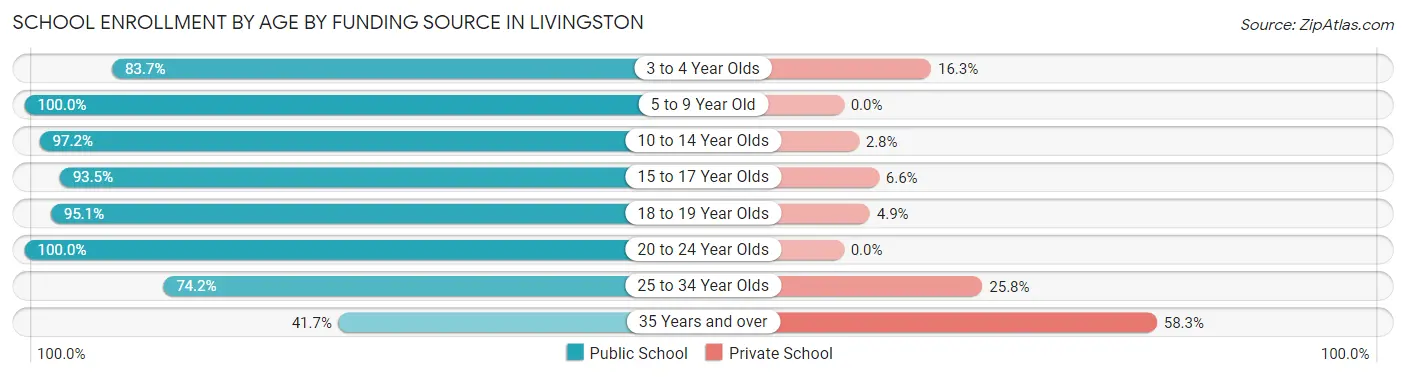
| Age Bracket | Public School | Private School |
| 3 to 4 Year Olds | 108 (83.7%) | 21 (16.3%) |
| 5 to 9 Year Old | 961 (100.0%) | 0 (0.0%) |
| 10 to 14 Year Olds | 1,072 (97.2%) | 31 (2.8%) |
| 15 to 17 Year Olds | 628 (93.4%) | 44 (6.6%) |
| 18 to 19 Year Olds | 234 (95.1%) | 12 (4.9%) |
| 20 to 24 Year Olds | 459 (100.0%) | 0 (0.0%) |
| 25 to 34 Year Olds | 247 (74.2%) | 86 (25.8%) |
| 35 Years and over | 5 (41.7%) | 7 (58.3%) |
| Total | 3,715 (94.9%) | 200 (5.1%) |
Educational Attainment by Field of Study in Livingston
Business (211 | 20.3%), social sciences (135 | 13.0%), education (135 | 13.0%), science & technology (120 | 11.6%), and arts & humanities (64 | 6.2%) are the most common fields of study among 1,037 individuals in Livingston who have obtained a bachelor's degree or higher.
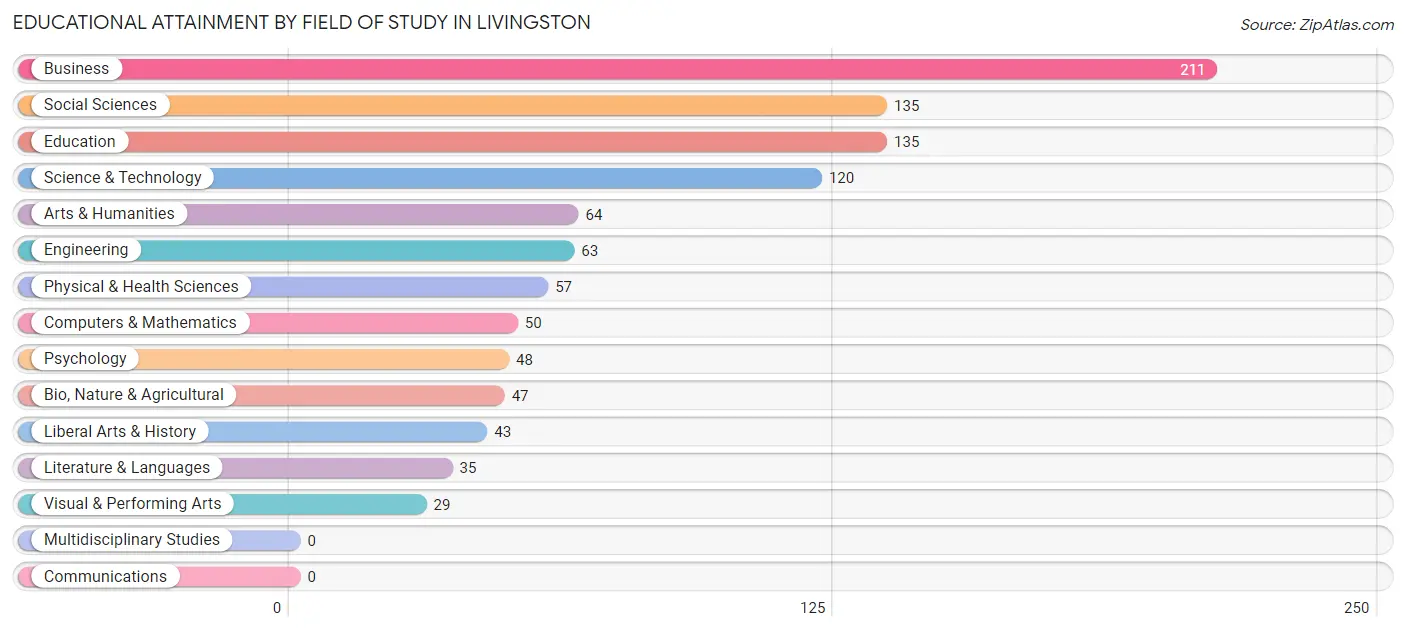
| Field of Study | # Graduates | % Graduates |
| Computers & Mathematics | 50 | 4.8% |
| Bio, Nature & Agricultural | 47 | 4.5% |
| Physical & Health Sciences | 57 | 5.5% |
| Psychology | 48 | 4.6% |
| Social Sciences | 135 | 13.0% |
| Engineering | 63 | 6.1% |
| Multidisciplinary Studies | 0 | 0.0% |
| Science & Technology | 120 | 11.6% |
| Business | 211 | 20.3% |
| Education | 135 | 13.0% |
| Literature & Languages | 35 | 3.4% |
| Liberal Arts & History | 43 | 4.2% |
| Visual & Performing Arts | 29 | 2.8% |
| Communications | 0 | 0.0% |
| Arts & Humanities | 64 | 6.2% |
| Total | 1,037 | 100.0% |
Transportation & Commute in Livingston
Vehicle Availability by Sex in Livingston
The most prevalent vehicle ownership categories in Livingston are males with 3 vehicles (1,024, accounting for 29.9%) and females with 3 vehicles (443, making up 42.1%).
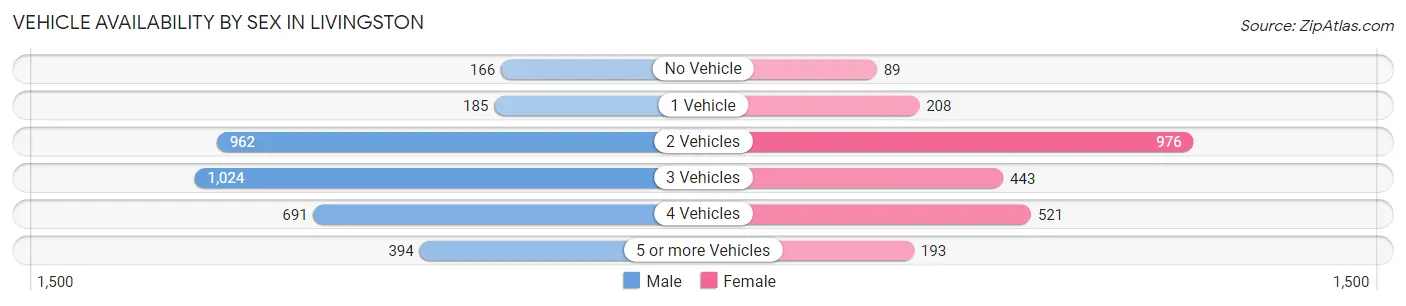
| Vehicles Available | Male | Female |
| No Vehicle | 166 (4.9%) | 89 (3.7%) |
| 1 Vehicle | 185 (5.4%) | 208 (8.6%) |
| 2 Vehicles | 962 (28.1%) | 976 (40.2%) |
| 3 Vehicles | 1,024 (29.9%) | 443 (18.2%) |
| 4 Vehicles | 691 (20.2%) | 521 (21.4%) |
| 5 or more Vehicles | 394 (11.5%) | 193 (7.9%) |
| Total | 3,422 (100.0%) | 2,430 (100.0%) |
Commute Time in Livingston
The most frequently occuring commute durations in Livingston are 15 to 19 minutes (981 commuters, 18.1%), 5 to 9 minutes (896 commuters, 16.5%), and 10 to 14 minutes (812 commuters, 15.0%).
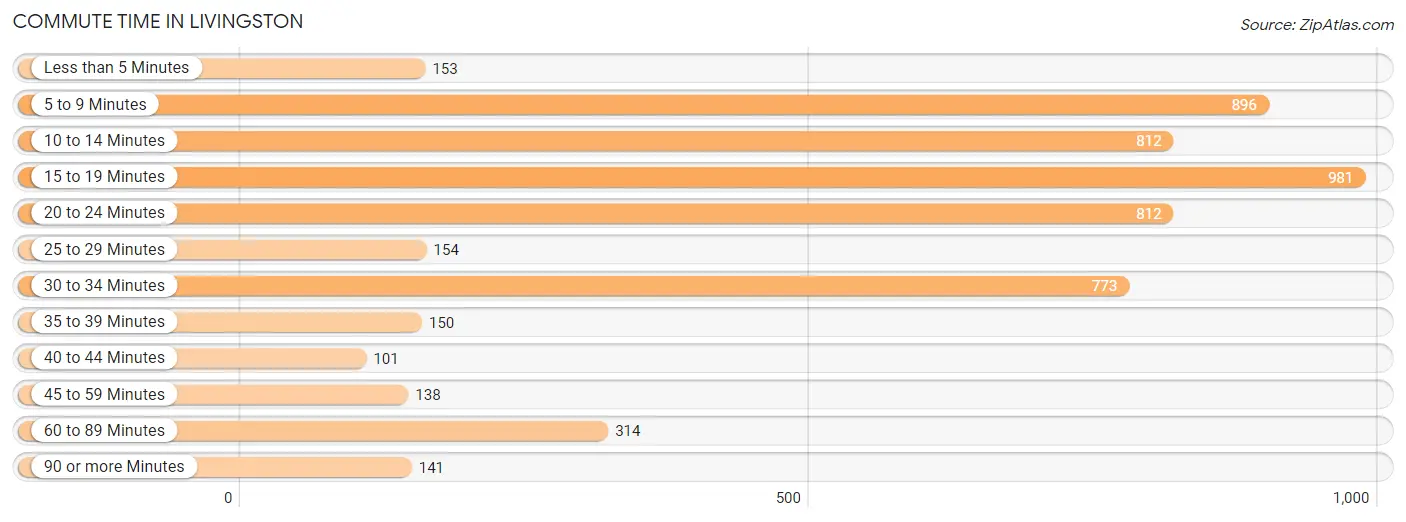
| Commute Time | # Commuters | % Commuters |
| Less than 5 Minutes | 153 | 2.8% |
| 5 to 9 Minutes | 896 | 16.5% |
| 10 to 14 Minutes | 812 | 15.0% |
| 15 to 19 Minutes | 981 | 18.1% |
| 20 to 24 Minutes | 812 | 15.0% |
| 25 to 29 Minutes | 154 | 2.8% |
| 30 to 34 Minutes | 773 | 14.2% |
| 35 to 39 Minutes | 150 | 2.8% |
| 40 to 44 Minutes | 101 | 1.9% |
| 45 to 59 Minutes | 138 | 2.5% |
| 60 to 89 Minutes | 314 | 5.8% |
| 90 or more Minutes | 141 | 2.6% |
Commute Time by Sex in Livingston
The most common commute times in Livingston are 20 to 24 minutes (663 commuters, 20.4%) for males and 5 to 9 minutes (564 commuters, 25.9%) for females.
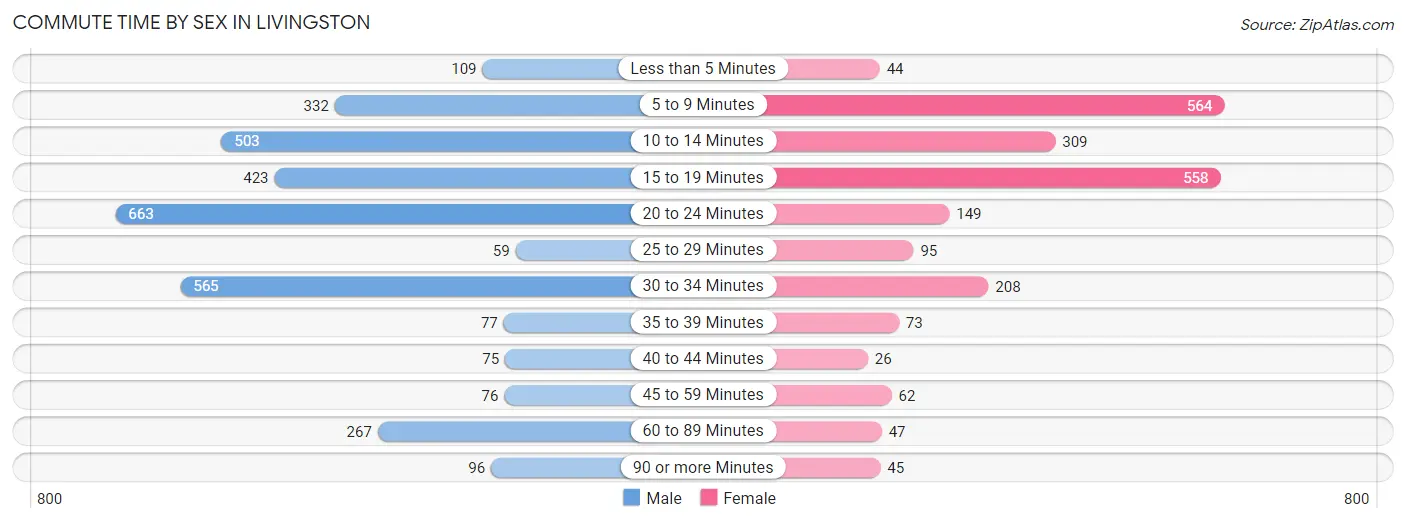
| Commute Time | Male | Female |
| Less than 5 Minutes | 109 (3.4%) | 44 (2.0%) |
| 5 to 9 Minutes | 332 (10.2%) | 564 (25.9%) |
| 10 to 14 Minutes | 503 (15.5%) | 309 (14.2%) |
| 15 to 19 Minutes | 423 (13.0%) | 558 (25.6%) |
| 20 to 24 Minutes | 663 (20.4%) | 149 (6.8%) |
| 25 to 29 Minutes | 59 (1.8%) | 95 (4.4%) |
| 30 to 34 Minutes | 565 (17.4%) | 208 (9.5%) |
| 35 to 39 Minutes | 77 (2.4%) | 73 (3.4%) |
| 40 to 44 Minutes | 75 (2.3%) | 26 (1.2%) |
| 45 to 59 Minutes | 76 (2.3%) | 62 (2.8%) |
| 60 to 89 Minutes | 267 (8.2%) | 47 (2.2%) |
| 90 or more Minutes | 96 (3.0%) | 45 (2.1%) |
Time of Departure to Work by Sex in Livingston
The most frequent times of departure to work in Livingston are 12:00 AM to 4:59 AM (747, 23.0%) for males and 12:00 AM to 4:59 AM (432, 19.8%) for females.
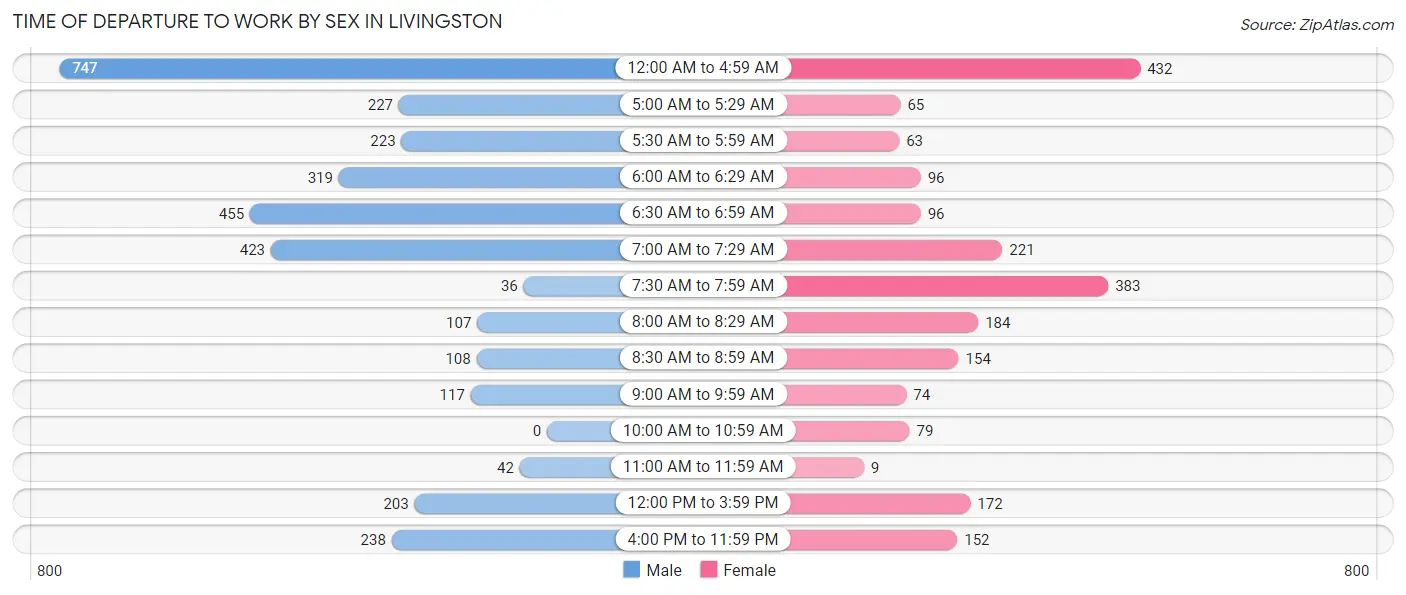
| Time of Departure | Male | Female |
| 12:00 AM to 4:59 AM | 747 (23.0%) | 432 (19.8%) |
| 5:00 AM to 5:29 AM | 227 (7.0%) | 65 (3.0%) |
| 5:30 AM to 5:59 AM | 223 (6.9%) | 63 (2.9%) |
| 6:00 AM to 6:29 AM | 319 (9.8%) | 96 (4.4%) |
| 6:30 AM to 6:59 AM | 455 (14.0%) | 96 (4.4%) |
| 7:00 AM to 7:29 AM | 423 (13.0%) | 221 (10.1%) |
| 7:30 AM to 7:59 AM | 36 (1.1%) | 383 (17.6%) |
| 8:00 AM to 8:29 AM | 107 (3.3%) | 184 (8.4%) |
| 8:30 AM to 8:59 AM | 108 (3.3%) | 154 (7.1%) |
| 9:00 AM to 9:59 AM | 117 (3.6%) | 74 (3.4%) |
| 10:00 AM to 10:59 AM | 0 (0.0%) | 79 (3.6%) |
| 11:00 AM to 11:59 AM | 42 (1.3%) | 9 (0.4%) |
| 12:00 PM to 3:59 PM | 203 (6.3%) | 172 (7.9%) |
| 4:00 PM to 11:59 PM | 238 (7.3%) | 152 (7.0%) |
| Total | 3,245 (100.0%) | 2,180 (100.0%) |
Housing Occupancy in Livingston
Occupancy by Ownership in Livingston
Of the total 3,348 dwellings in Livingston, owner-occupied units account for 1,983 (59.2%), while renter-occupied units make up 1,365 (40.8%).
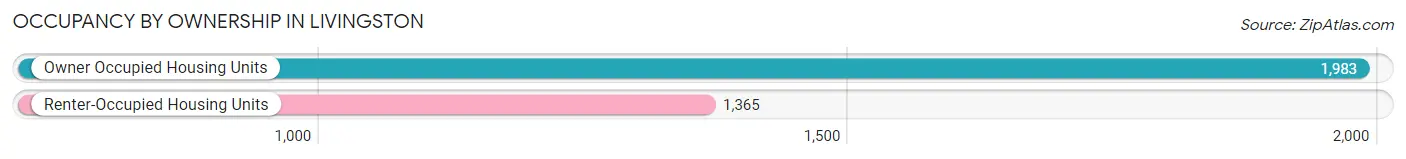
| Occupancy | # Housing Units | % Housing Units |
| Owner Occupied Housing Units | 1,983 | 59.2% |
| Renter-Occupied Housing Units | 1,365 | 40.8% |
| Total Occupied Housing Units | 3,348 | 100.0% |
Occupancy by Household Size in Livingston
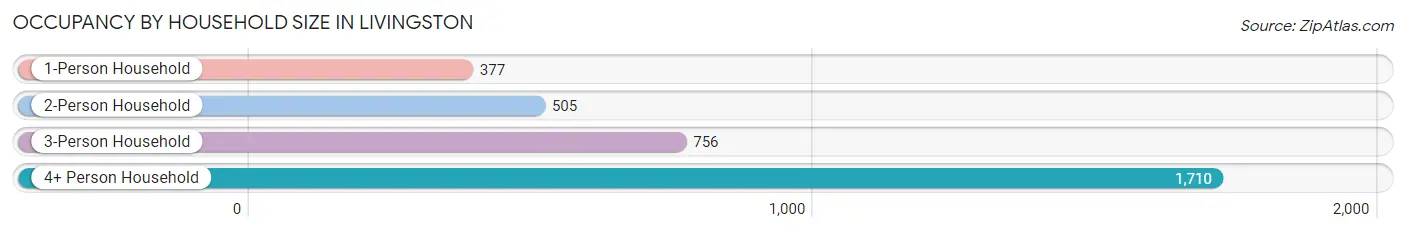
| Household Size | # Housing Units | % Housing Units |
| 1-Person Household | 377 | 11.3% |
| 2-Person Household | 505 | 15.1% |
| 3-Person Household | 756 | 22.6% |
| 4+ Person Household | 1,710 | 51.1% |
| Total Housing Units | 3,348 | 100.0% |
Occupancy by Ownership by Household Size in Livingston
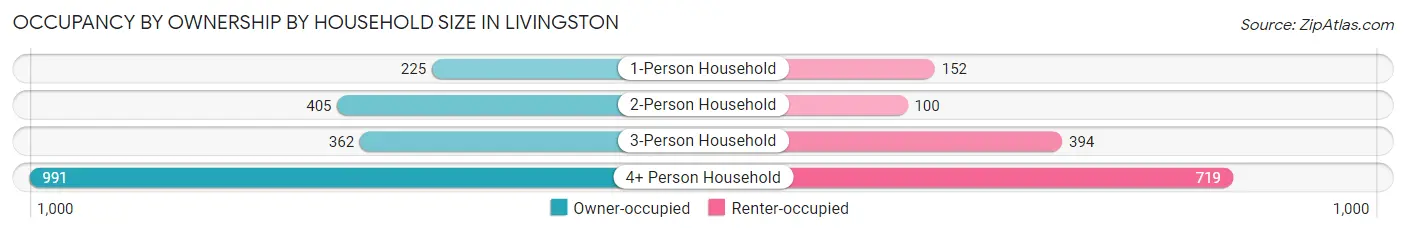
| Household Size | Owner-occupied | Renter-occupied |
| 1-Person Household | 225 (59.7%) | 152 (40.3%) |
| 2-Person Household | 405 (80.2%) | 100 (19.8%) |
| 3-Person Household | 362 (47.9%) | 394 (52.1%) |
| 4+ Person Household | 991 (58.0%) | 719 (42.0%) |
| Total Housing Units | 1,983 (59.2%) | 1,365 (40.8%) |
Occupancy by Educational Attainment in Livingston
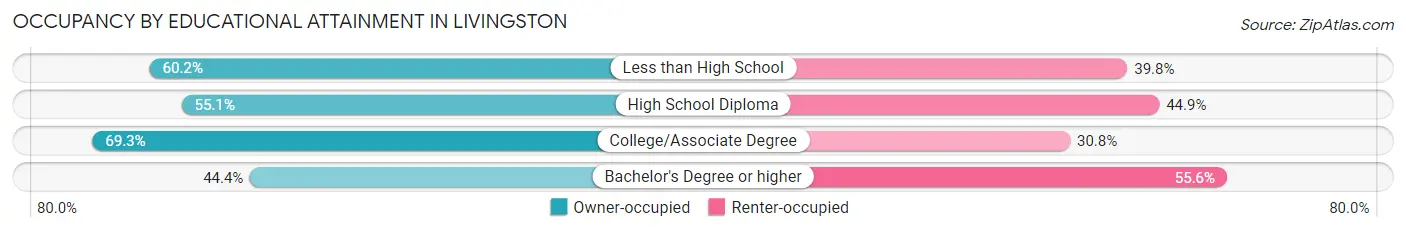
| Household Size | Owner-occupied | Renter-occupied |
| Less than High School | 781 (60.2%) | 517 (39.8%) |
| High School Diploma | 529 (55.1%) | 431 (44.9%) |
| College/Associate Degree | 527 (69.3%) | 234 (30.7%) |
| Bachelor's Degree or higher | 146 (44.4%) | 183 (55.6%) |
Occupancy by Age of Householder in Livingston
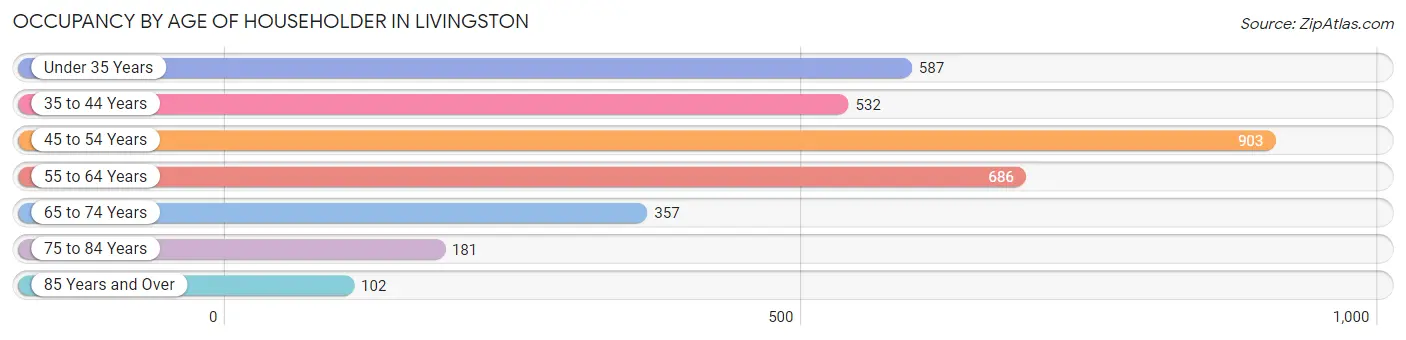
| Age Bracket | # Households | % Households |
| Under 35 Years | 587 | 17.5% |
| 35 to 44 Years | 532 | 15.9% |
| 45 to 54 Years | 903 | 27.0% |
| 55 to 64 Years | 686 | 20.5% |
| 65 to 74 Years | 357 | 10.7% |
| 75 to 84 Years | 181 | 5.4% |
| 85 Years and Over | 102 | 3.0% |
| Total | 3,348 | 100.0% |
Housing Finances in Livingston
Median Income by Occupancy in Livingston
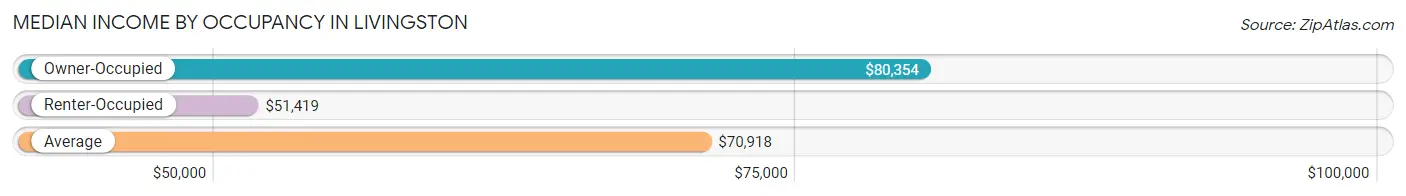
| Occupancy Type | # Households | Median Income |
| Owner-Occupied | 1,983 (59.2%) | $80,354 |
| Renter-Occupied | 1,365 (40.8%) | $51,419 |
| Average | 3,348 (100.0%) | $70,918 |
Occupancy by Householder Income Bracket in Livingston
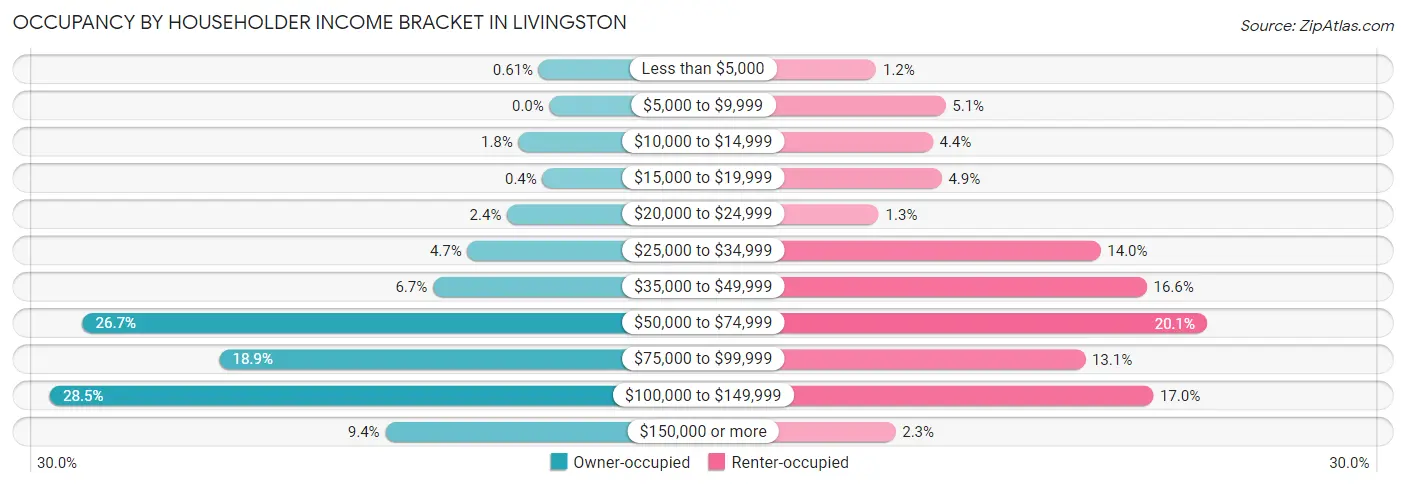
| Income Bracket | Owner-occupied | Renter-occupied |
| Less than $5,000 | 12 (0.6%) | 16 (1.2%) |
| $5,000 to $9,999 | 0 (0.0%) | 70 (5.1%) |
| $10,000 to $14,999 | 35 (1.8%) | 60 (4.4%) |
| $15,000 to $19,999 | 8 (0.4%) | 67 (4.9%) |
| $20,000 to $24,999 | 48 (2.4%) | 18 (1.3%) |
| $25,000 to $34,999 | 93 (4.7%) | 191 (14.0%) |
| $35,000 to $49,999 | 132 (6.7%) | 227 (16.6%) |
| $50,000 to $74,999 | 529 (26.7%) | 274 (20.1%) |
| $75,000 to $99,999 | 374 (18.9%) | 179 (13.1%) |
| $100,000 to $149,999 | 566 (28.5%) | 232 (17.0%) |
| $150,000 or more | 186 (9.4%) | 31 (2.3%) |
| Total | 1,983 (100.0%) | 1,365 (100.0%) |
Monthly Housing Cost Tiers in Livingston
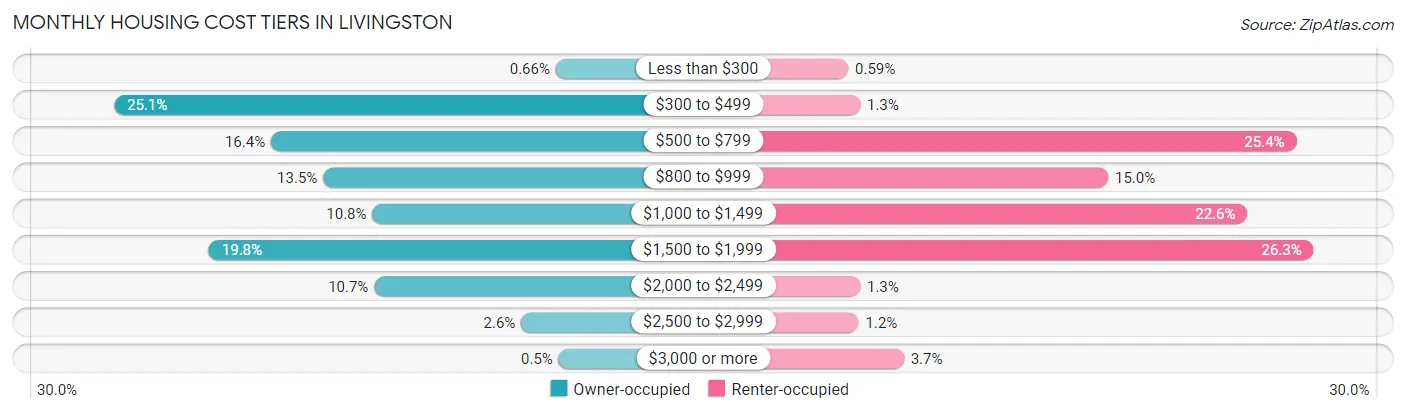
| Monthly Cost | Owner-occupied | Renter-occupied |
| Less than $300 | 13 (0.7%) | 8 (0.6%) |
| $300 to $499 | 497 (25.1%) | 17 (1.3%) |
| $500 to $799 | 325 (16.4%) | 346 (25.4%) |
| $800 to $999 | 268 (13.5%) | 204 (14.9%) |
| $1,000 to $1,499 | 214 (10.8%) | 309 (22.6%) |
| $1,500 to $1,999 | 393 (19.8%) | 359 (26.3%) |
| $2,000 to $2,499 | 212 (10.7%) | 17 (1.3%) |
| $2,500 to $2,999 | 51 (2.6%) | 16 (1.2%) |
| $3,000 or more | 10 (0.5%) | 50 (3.7%) |
| Total | 1,983 (100.0%) | 1,365 (100.0%) |
Physical Housing Characteristics in Livingston
Housing Structures in Livingston
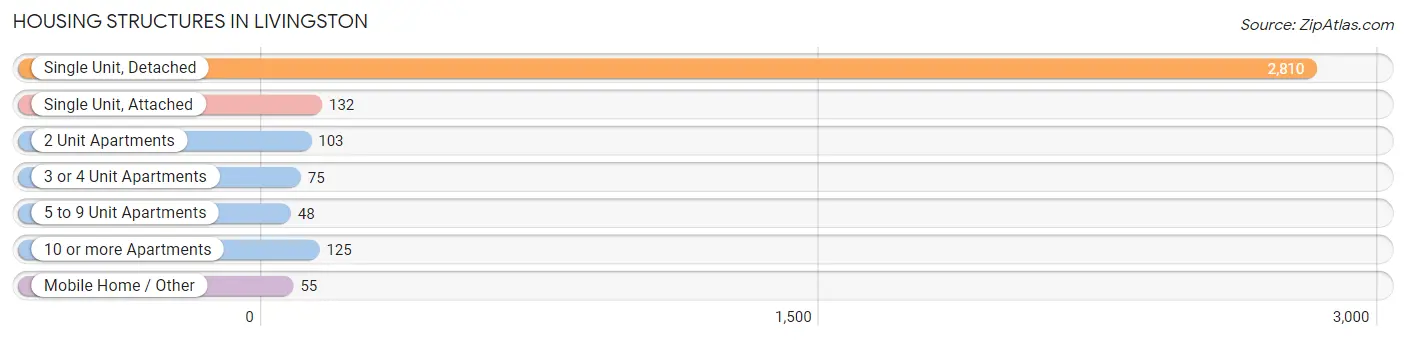
| Structure Type | # Housing Units | % Housing Units |
| Single Unit, Detached | 2,810 | 83.9% |
| Single Unit, Attached | 132 | 3.9% |
| 2 Unit Apartments | 103 | 3.1% |
| 3 or 4 Unit Apartments | 75 | 2.2% |
| 5 to 9 Unit Apartments | 48 | 1.4% |
| 10 or more Apartments | 125 | 3.7% |
| Mobile Home / Other | 55 | 1.6% |
| Total | 3,348 | 100.0% |
Housing Structures by Occupancy in Livingston
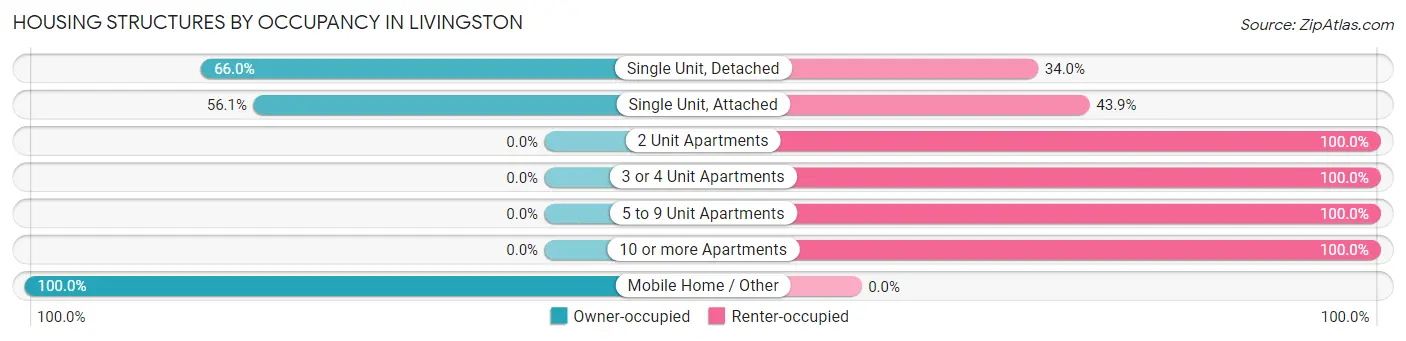
| Structure Type | Owner-occupied | Renter-occupied |
| Single Unit, Detached | 1,854 (66.0%) | 956 (34.0%) |
| Single Unit, Attached | 74 (56.1%) | 58 (43.9%) |
| 2 Unit Apartments | 0 (0.0%) | 103 (100.0%) |
| 3 or 4 Unit Apartments | 0 (0.0%) | 75 (100.0%) |
| 5 to 9 Unit Apartments | 0 (0.0%) | 48 (100.0%) |
| 10 or more Apartments | 0 (0.0%) | 125 (100.0%) |
| Mobile Home / Other | 55 (100.0%) | 0 (0.0%) |
| Total | 1,983 (59.2%) | 1,365 (40.8%) |
Housing Structures by Number of Rooms in Livingston
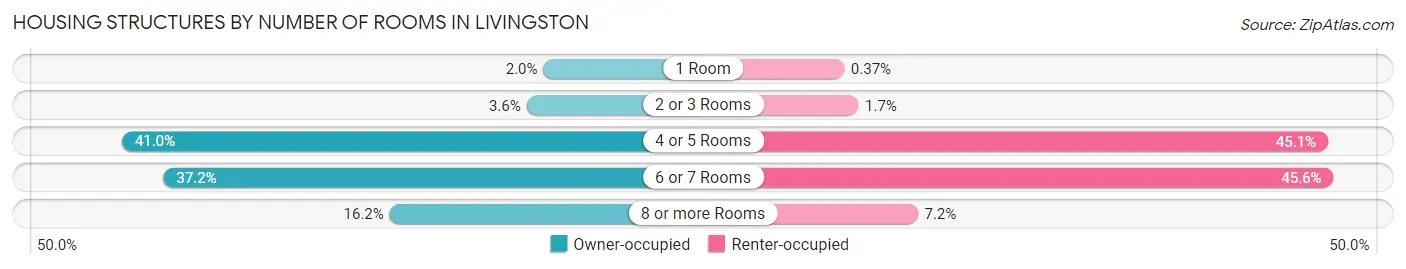
| Number of Rooms | Owner-occupied | Renter-occupied |
| 1 Room | 40 (2.0%) | 5 (0.4%) |
| 2 or 3 Rooms | 71 (3.6%) | 23 (1.7%) |
| 4 or 5 Rooms | 813 (41.0%) | 616 (45.1%) |
| 6 or 7 Rooms | 737 (37.2%) | 623 (45.6%) |
| 8 or more Rooms | 322 (16.2%) | 98 (7.2%) |
| Total | 1,983 (100.0%) | 1,365 (100.0%) |
Housing Structure by Heating Type in Livingston
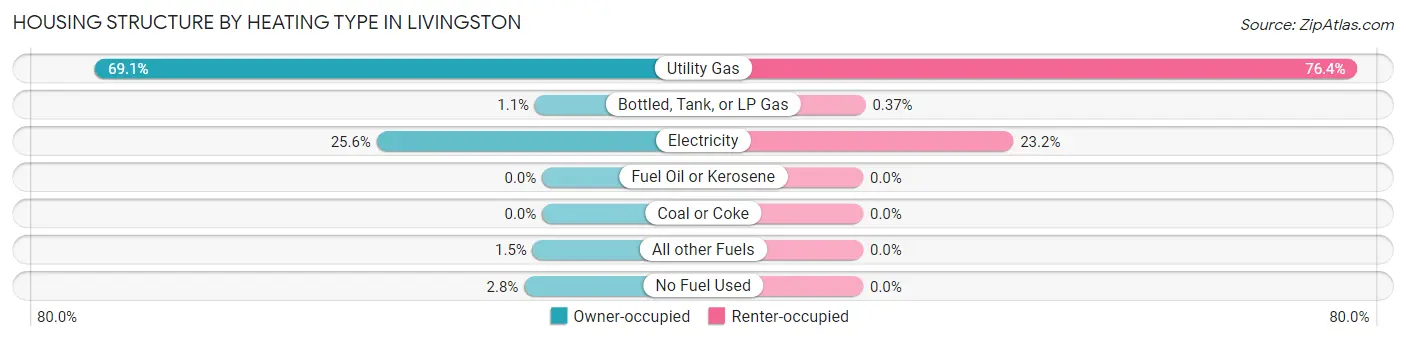
| Heating Type | Owner-occupied | Renter-occupied |
| Utility Gas | 1,370 (69.1%) | 1,043 (76.4%) |
| Bottled, Tank, or LP Gas | 22 (1.1%) | 5 (0.4%) |
| Electricity | 507 (25.6%) | 317 (23.2%) |
| Fuel Oil or Kerosene | 0 (0.0%) | 0 (0.0%) |
| Coal or Coke | 0 (0.0%) | 0 (0.0%) |
| All other Fuels | 29 (1.5%) | 0 (0.0%) |
| No Fuel Used | 55 (2.8%) | 0 (0.0%) |
| Total | 1,983 (100.0%) | 1,365 (100.0%) |
Household Vehicle Usage in Livingston
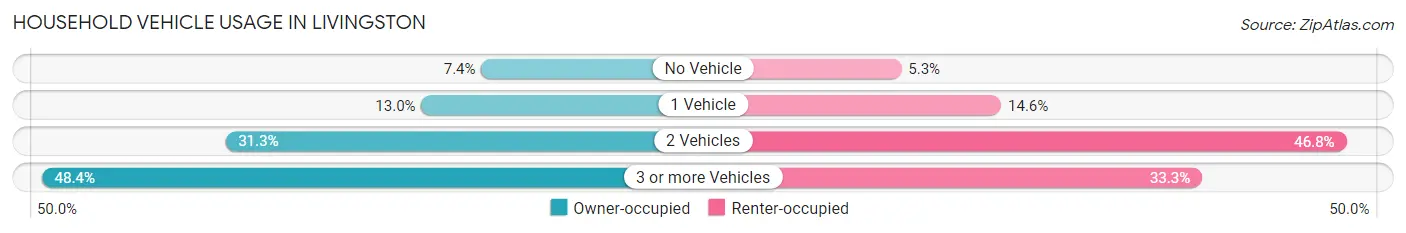
| Vehicles per Household | Owner-occupied | Renter-occupied |
| No Vehicle | 146 (7.4%) | 72 (5.3%) |
| 1 Vehicle | 257 (13.0%) | 199 (14.6%) |
| 2 Vehicles | 620 (31.3%) | 639 (46.8%) |
| 3 or more Vehicles | 960 (48.4%) | 455 (33.3%) |
| Total | 1,983 (100.0%) | 1,365 (100.0%) |
Real Estate & Mortgages in Livingston
Real Estate and Mortgage Overview in Livingston
| Characteristic | Without Mortgage | With Mortgage |
| Housing Units | 928 | 1,055 |
| Median Property Value | $258,700 | $361,700 |
| Median Household Income | $80,650 | $132 |
| Monthly Housing Costs | $485 | $0 |
| Real Estate Taxes | $1,830 | $0 |
Property Value by Mortgage Status in Livingston
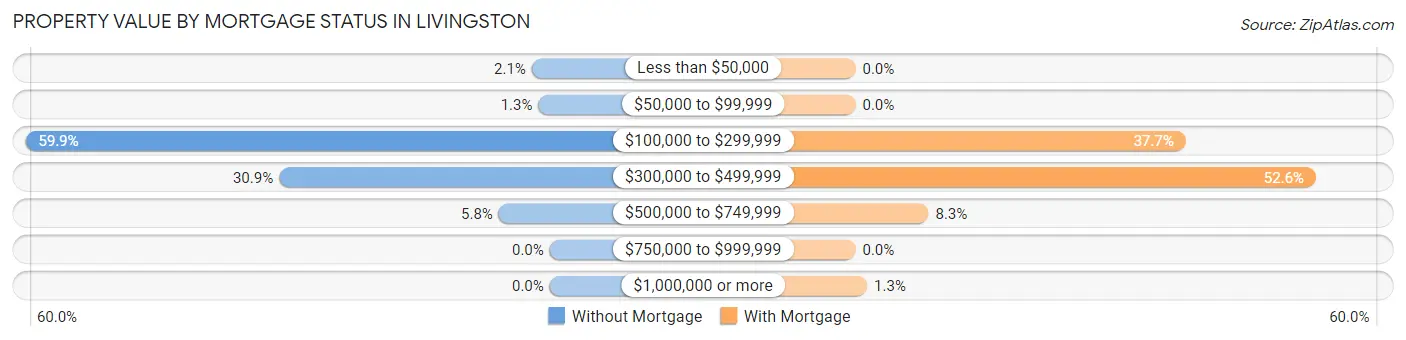
| Property Value | Without Mortgage | With Mortgage |
| Less than $50,000 | 19 (2.1%) | 0 (0.0%) |
| $50,000 to $99,999 | 12 (1.3%) | 0 (0.0%) |
| $100,000 to $299,999 | 556 (59.9%) | 398 (37.7%) |
| $300,000 to $499,999 | 287 (30.9%) | 555 (52.6%) |
| $500,000 to $749,999 | 54 (5.8%) | 88 (8.3%) |
| $750,000 to $999,999 | 0 (0.0%) | 0 (0.0%) |
| $1,000,000 or more | 0 (0.0%) | 14 (1.3%) |
| Total | 928 (100.0%) | 1,055 (100.0%) |
Household Income by Mortgage Status in Livingston
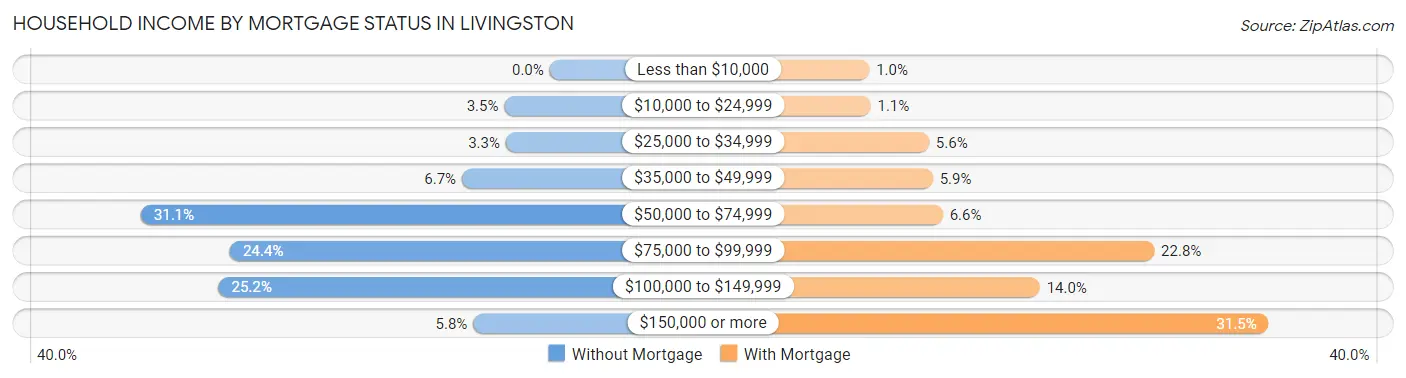
| Household Income | Without Mortgage | With Mortgage |
| Less than $10,000 | 0 (0.0%) | 11 (1.0%) |
| $10,000 to $24,999 | 32 (3.5%) | 12 (1.1%) |
| $25,000 to $34,999 | 31 (3.3%) | 59 (5.6%) |
| $35,000 to $49,999 | 62 (6.7%) | 62 (5.9%) |
| $50,000 to $74,999 | 289 (31.1%) | 70 (6.6%) |
| $75,000 to $99,999 | 226 (24.3%) | 240 (22.8%) |
| $100,000 to $149,999 | 234 (25.2%) | 148 (14.0%) |
| $150,000 or more | 54 (5.8%) | 332 (31.5%) |
| Total | 928 (100.0%) | 1,055 (100.0%) |
Property Value to Household Income Ratio in Livingston
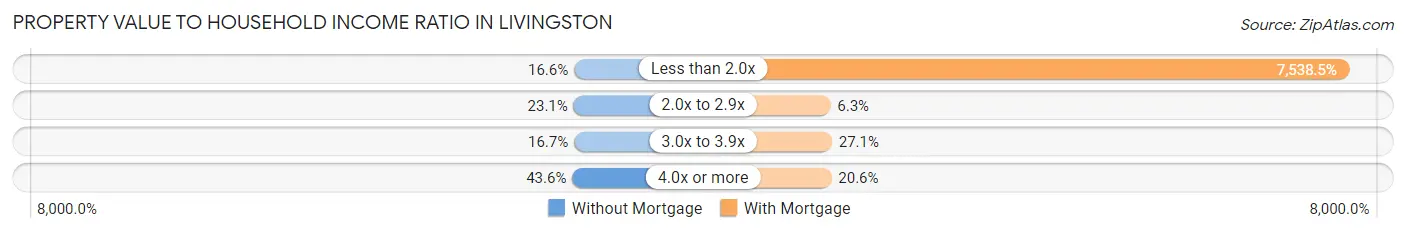
| Value-to-Income Ratio | Without Mortgage | With Mortgage |
| Less than 2.0x | 154 (16.6%) | 79,531 (7,538.5%) |
| 2.0x to 2.9x | 214 (23.1%) | 66 (6.3%) |
| 3.0x to 3.9x | 155 (16.7%) | 286 (27.1%) |
| 4.0x or more | 405 (43.6%) | 217 (20.6%) |
| Total | 928 (100.0%) | 1,055 (100.0%) |
Real Estate Taxes by Mortgage Status in Livingston
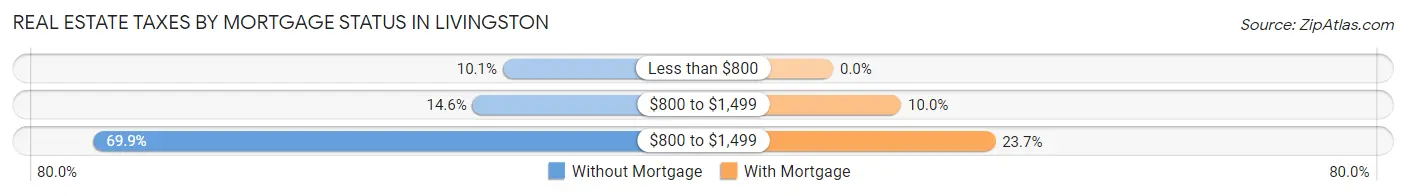
| Property Taxes | Without Mortgage | With Mortgage |
| Less than $800 | 94 (10.1%) | 0 (0.0%) |
| $800 to $1,499 | 135 (14.5%) | 105 (10.0%) |
| $800 to $1,499 | 649 (69.9%) | 250 (23.7%) |
| Total | 928 (100.0%) | 1,055 (100.0%) |
Health & Disability in Livingston
Health Insurance Coverage by Age in Livingston
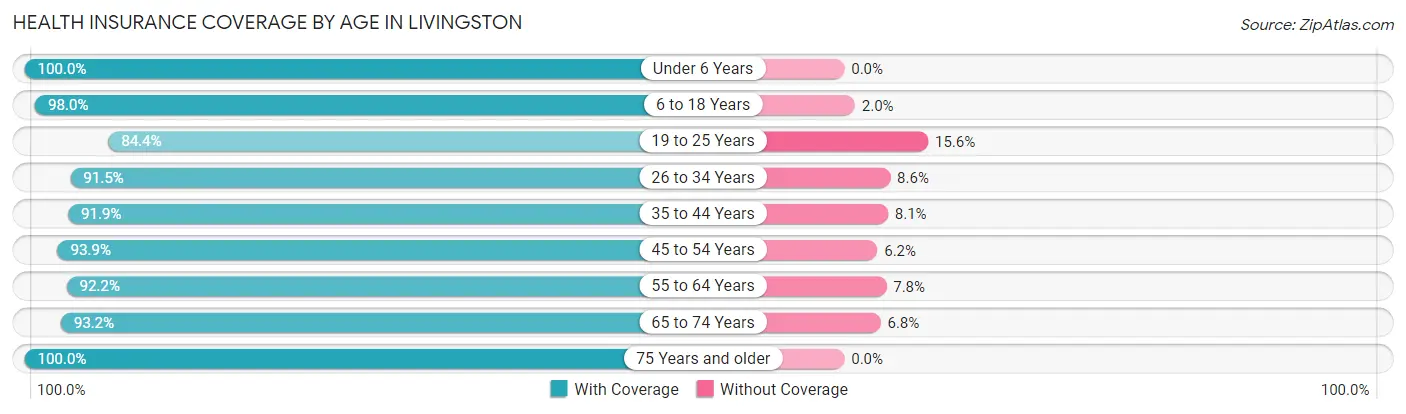
| Age Bracket | With Coverage | Without Coverage |
| Under 6 Years | 1,475 (100.0%) | 0 (0.0%) |
| 6 to 18 Years | 2,756 (98.0%) | 55 (2.0%) |
| 19 to 25 Years | 1,183 (84.4%) | 219 (15.6%) |
| 26 to 34 Years | 1,892 (91.4%) | 177 (8.6%) |
| 35 to 44 Years | 1,528 (91.9%) | 135 (8.1%) |
| 45 to 54 Years | 1,680 (93.9%) | 110 (6.1%) |
| 55 to 64 Years | 1,531 (92.2%) | 130 (7.8%) |
| 65 to 74 Years | 676 (93.2%) | 49 (6.8%) |
| 75 Years and older | 748 (100.0%) | 0 (0.0%) |
| Total | 13,469 (93.9%) | 875 (6.1%) |
Health Insurance Coverage by Citizenship Status in Livingston
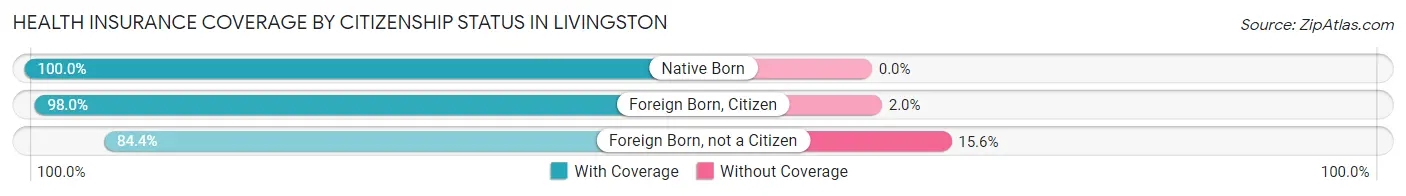
| Citizenship Status | With Coverage | Without Coverage |
| Native Born | 1,475 (100.0%) | 0 (0.0%) |
| Foreign Born, Citizen | 2,756 (98.0%) | 55 (2.0%) |
| Foreign Born, not a Citizen | 1,183 (84.4%) | 219 (15.6%) |
Health Insurance Coverage by Household Income in Livingston
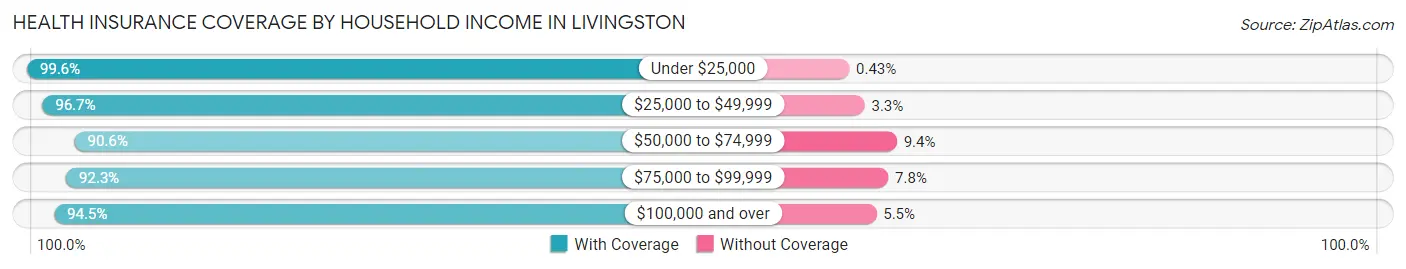
| Household Income | With Coverage | Without Coverage |
| Under $25,000 | 918 (99.6%) | 4 (0.4%) |
| $25,000 to $49,999 | 2,182 (96.7%) | 75 (3.3%) |
| $50,000 to $74,999 | 2,905 (90.6%) | 300 (9.4%) |
| $75,000 to $99,999 | 2,394 (92.2%) | 201 (7.7%) |
| $100,000 and over | 5,053 (94.5%) | 295 (5.5%) |
Public vs Private Health Insurance Coverage by Age in Livingston
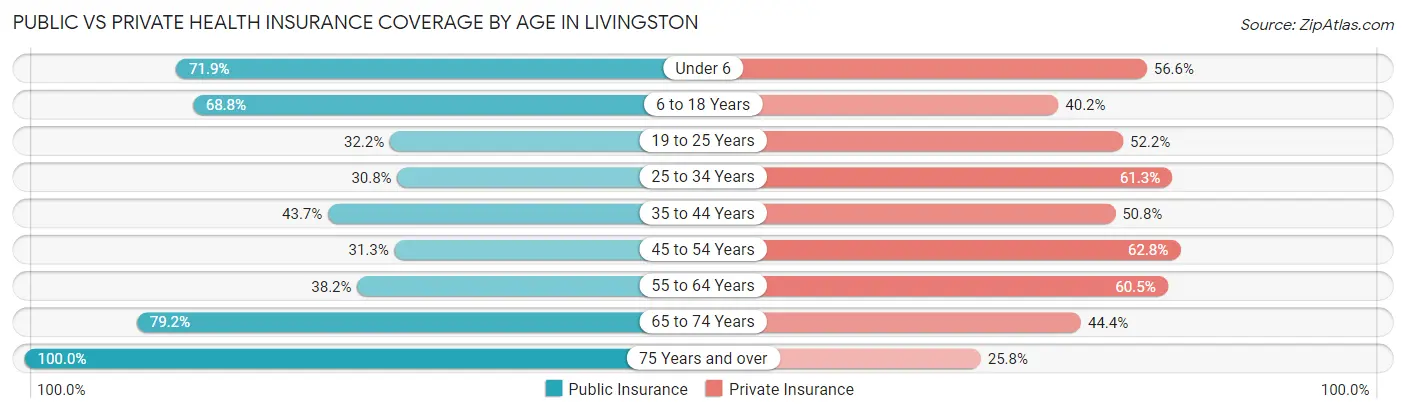
| Age Bracket | Public Insurance | Private Insurance |
| Under 6 | 1,060 (71.9%) | 835 (56.6%) |
| 6 to 18 Years | 1,933 (68.8%) | 1,130 (40.2%) |
| 19 to 25 Years | 451 (32.2%) | 732 (52.2%) |
| 25 to 34 Years | 637 (30.8%) | 1,268 (61.3%) |
| 35 to 44 Years | 726 (43.7%) | 844 (50.7%) |
| 45 to 54 Years | 561 (31.3%) | 1,124 (62.8%) |
| 55 to 64 Years | 635 (38.2%) | 1,004 (60.5%) |
| 65 to 74 Years | 574 (79.2%) | 322 (44.4%) |
| 75 Years and over | 748 (100.0%) | 193 (25.8%) |
| Total | 7,325 (51.1%) | 7,452 (51.9%) |
Disability Status by Sex by Age in Livingston
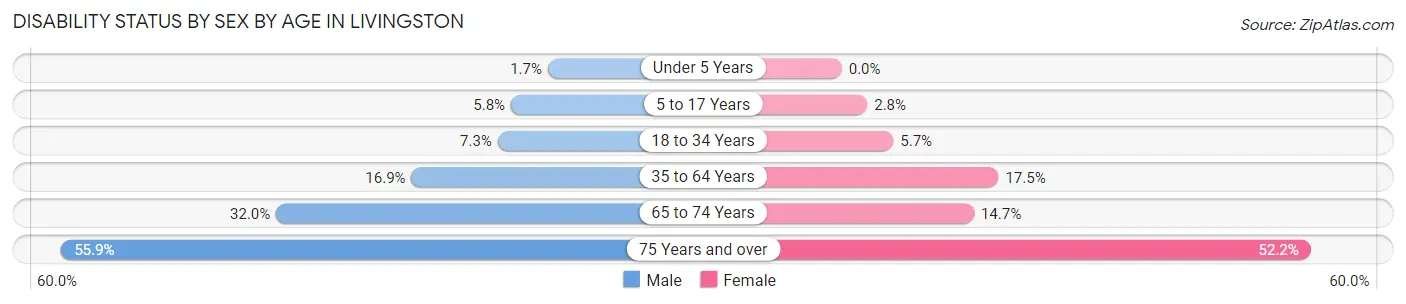
| Age Bracket | Male | Female |
| Under 5 Years | 9 (1.7%) | 0 (0.0%) |
| 5 to 17 Years | 77 (5.8%) | 44 (2.8%) |
| 18 to 34 Years | 123 (7.3%) | 117 (5.7%) |
| 35 to 64 Years | 453 (16.9%) | 425 (17.4%) |
| 65 to 74 Years | 95 (32.0%) | 63 (14.7%) |
| 75 Years and over | 203 (55.9%) | 201 (52.2%) |
Disability Class by Sex by Age in Livingston
Disability Class: Hearing Difficulty
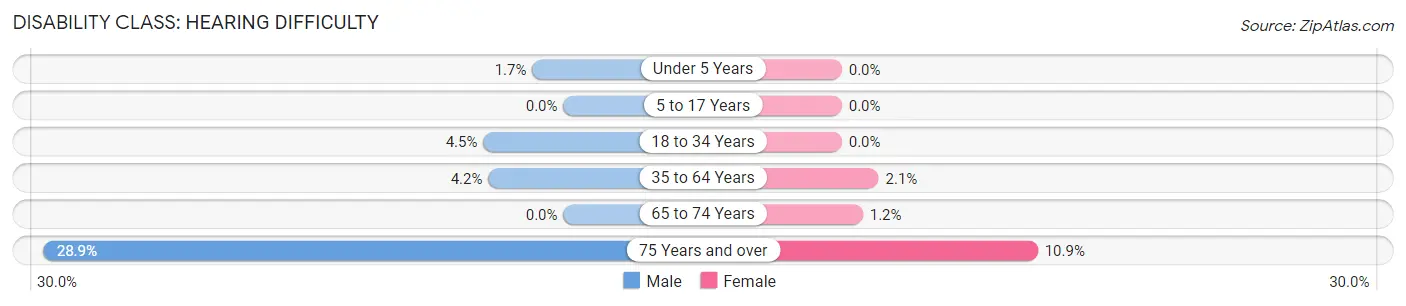
| Age Bracket | Male | Female |
| Under 5 Years | 9 (1.7%) | 0 (0.0%) |
| 5 to 17 Years | 0 (0.0%) | 0 (0.0%) |
| 18 to 34 Years | 75 (4.5%) | 0 (0.0%) |
| 35 to 64 Years | 112 (4.2%) | 50 (2.1%) |
| 65 to 74 Years | 0 (0.0%) | 5 (1.2%) |
| 75 Years and over | 105 (28.9%) | 42 (10.9%) |
Disability Class: Vision Difficulty
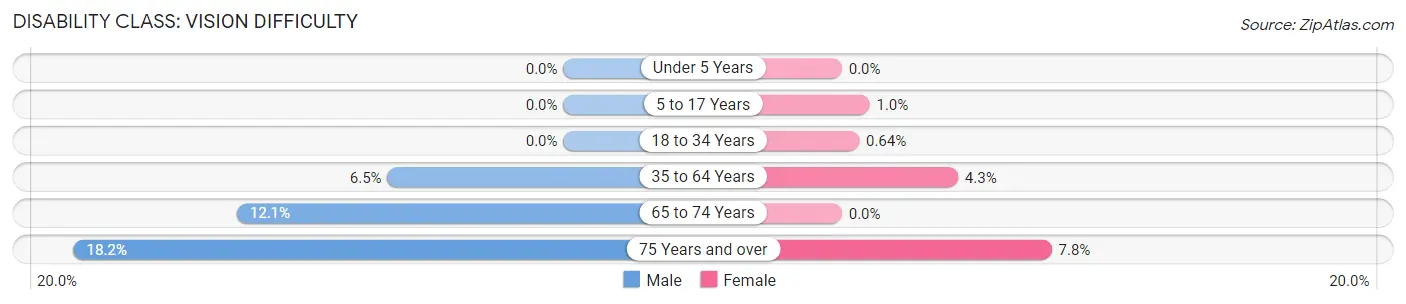
| Age Bracket | Male | Female |
| Under 5 Years | 0 (0.0%) | 0 (0.0%) |
| 5 to 17 Years | 0 (0.0%) | 16 (1.0%) |
| 18 to 34 Years | 0 (0.0%) | 13 (0.6%) |
| 35 to 64 Years | 175 (6.5%) | 105 (4.3%) |
| 65 to 74 Years | 36 (12.1%) | 0 (0.0%) |
| 75 Years and over | 66 (18.2%) | 30 (7.8%) |
Disability Class: Cognitive Difficulty
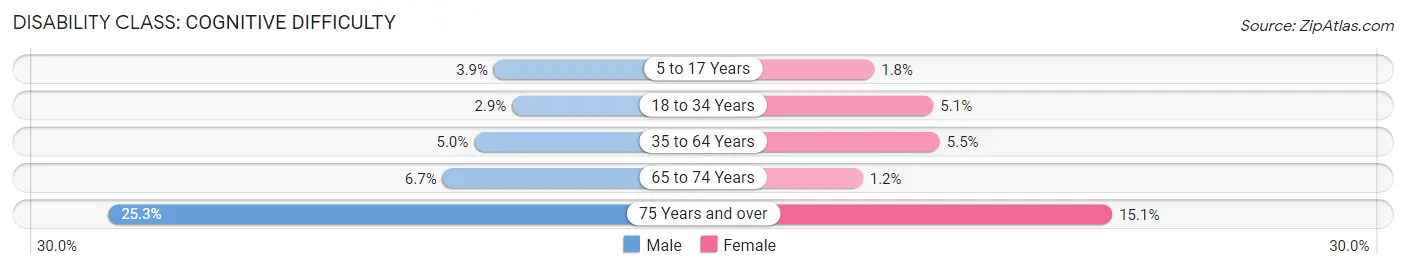
| Age Bracket | Male | Female |
| 5 to 17 Years | 51 (3.9%) | 28 (1.8%) |
| 18 to 34 Years | 48 (2.9%) | 104 (5.1%) |
| 35 to 64 Years | 133 (5.0%) | 133 (5.5%) |
| 65 to 74 Years | 20 (6.7%) | 5 (1.2%) |
| 75 Years and over | 92 (25.3%) | 58 (15.1%) |
Disability Class: Ambulatory Difficulty
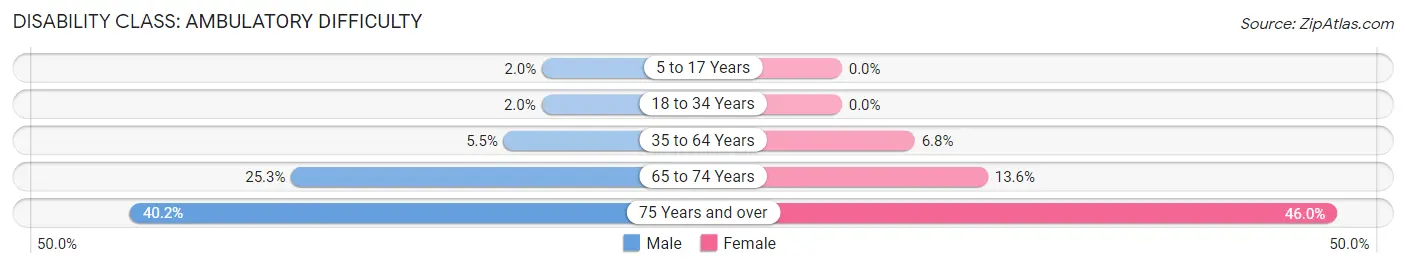
| Age Bracket | Male | Female |
| 5 to 17 Years | 26 (2.0%) | 0 (0.0%) |
| 18 to 34 Years | 34 (2.0%) | 0 (0.0%) |
| 35 to 64 Years | 148 (5.5%) | 165 (6.8%) |
| 65 to 74 Years | 75 (25.3%) | 58 (13.6%) |
| 75 Years and over | 146 (40.2%) | 177 (46.0%) |
Disability Class: Self-Care Difficulty
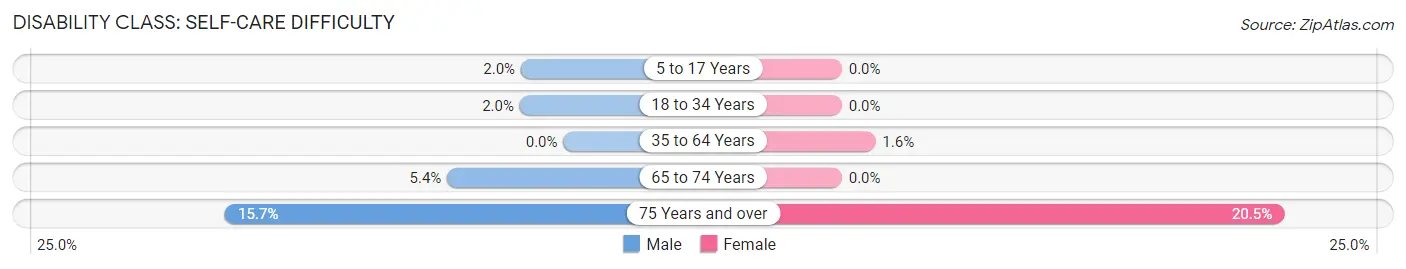
| Age Bracket | Male | Female |
| 5 to 17 Years | 26 (2.0%) | 0 (0.0%) |
| 18 to 34 Years | 34 (2.0%) | 0 (0.0%) |
| 35 to 64 Years | 0 (0.0%) | 38 (1.6%) |
| 65 to 74 Years | 16 (5.4%) | 0 (0.0%) |
| 75 Years and over | 57 (15.7%) | 79 (20.5%) |
Technology Access in Livingston
Computing Device Access in Livingston
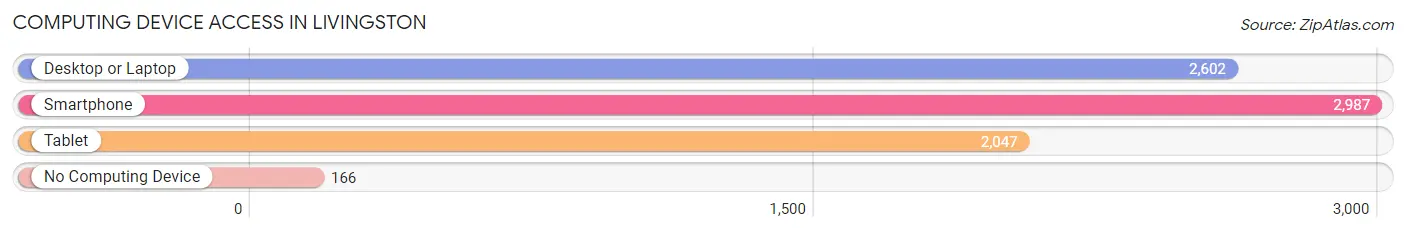
| Device Type | # Households | % Households |
| Desktop or Laptop | 2,602 | 77.7% |
| Smartphone | 2,987 | 89.2% |
| Tablet | 2,047 | 61.1% |
| No Computing Device | 166 | 5.0% |
| Total | 3,348 | 100.0% |
Internet Access in Livingston
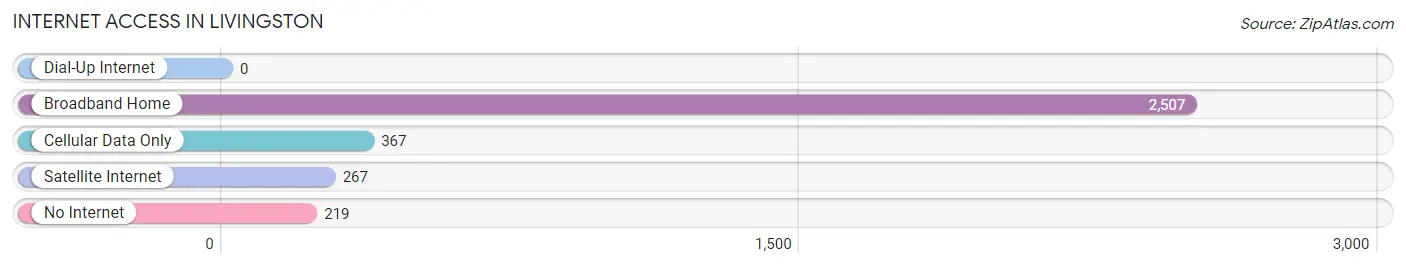
| Internet Type | # Households | % Households |
| Dial-Up Internet | 0 | 0.0% |
| Broadband Home | 2,507 | 74.9% |
| Cellular Data Only | 367 | 11.0% |
| Satellite Internet | 267 | 8.0% |
| No Internet | 219 | 6.5% |
| Total | 3,348 | 100.0% |
Livingston Summary
Livingston is a city located in Merced County, California, United States. The population was 13,058 at the 2010 census, up from 8,579 at the 2000 census. Livingston is located 8 miles (13 km) west-northwest of Atwater, at an elevation of 118 feet (36 m).
History
Livingston was founded in 1870 by settlers from the nearby town of Hornitos. The town was named after Dr. David Livingstone, a Scottish missionary and explorer. The town was incorporated in 1927.
Geography
Livingston is located at 37°25′45″N 120°44′45″W (37.429167, -120.745833). According to the United States Census Bureau, the city has a total area of 2.3 square miles (6.0 km2), all of it land.
Economy
Livingston is a small agricultural community, with a variety of crops grown in the area. The main crops are almonds, walnuts, tomatoes, and grapes. The city is also home to a number of small businesses, including a few restaurants, a grocery store, and a few retail stores.
Demographics
As of the census of 2000, there were 8,579 people, 2,845 households, and 2,092 families residing in the city. The population density was 3,717.2 people per square mile (1,437.2/km2). There were 3,039 housing units at an average density of 1,323.2 per square mile (510.3/km2). The racial makeup of the city was 57.2% White, 1.2% African American, 1.2% Native American, 0.7% Asian, 0.1% Pacific Islander, 36.2% from other races, and 3.5% from two or more races. Hispanic or Latino of any race were 64.2% of the population.
There were 2,845 households, out of which 39.2% had children under the age of 18 living with them, 51.2% were married couples living together, 14.7% had a female householder with no husband present, and 27.2% were non-families. 22.2% of all households were made up of individuals, and 10.2% had someone living alone who was 65 years of age or older. The average household size was 3.00 and the average family size was 3.51.
In the city, the population was spread out, with 32.2% under the age of 18, 10.2% from 18 to 24, 28.2% from 25 to 44, 17.7% from 45 to 64, and 11.7% who were 65 years of age or older. The median age was 30 years. For every 100 females, there were 97.2 males. For every 100 females age 18 and over, there were 93.2 males.
The median income for a household in the city was $27,917, and the median income for a family was $30,917. Males had a median income of $25,917 versus $20,917 for females. The per capita income for the city was $11,917. About 20.2% of families and 23.2% of the population were below the poverty line, including 28.2% of those under age 18 and 16.2% of those age 65 or over.
Common Questions
What is Per Capita Income in Livingston?
Per Capita income in Livingston is $20,356.
What is the Median Family Income in Livingston?
Median Family Income in Livingston is $72,667.
What is the Median Household income in Livingston?
Median Household Income in Livingston is $70,918.
What is Income or Wage Gap in Livingston?
Income or Wage Gap in Livingston is 37.1%.
Women in Livingston earn 62.9 cents for every dollar earned by a man.
What is Family Income Deficit in Livingston?
Family Income Deficit in Livingston is $10,703.
Families that are below poverty line in Livingston earn $10,703 less on average than the poverty threshold level.
What is Inequality or Gini Index in Livingston?
Inequality or Gini Index in Livingston is 0.34.
What is the Total Population of Livingston?
Total Population of Livingston is 14,344.
What is the Total Male Population of Livingston?
Total Male Population of Livingston is 6,860.
What is the Total Female Population of Livingston?
Total Female Population of Livingston is 7,484.
What is the Ratio of Males per 100 Females in Livingston?
There are 91.66 Males per 100 Females in Livingston.
What is the Ratio of Females per 100 Males in Livingston?
There are 109.10 Females per 100 Males in Livingston.
What is the Median Population Age in Livingston?
Median Population Age in Livingston is 32.1 Years.
What is the Average Family Size in Livingston
Average Family Size in Livingston is 4.5 People.
What is the Average Household Size in Livingston
Average Household Size in Livingston is 4.3 People.
How Large is the Labor Force in Livingston?
There are 6,929 People in the Labor Forcein in Livingston.
What is the Percentage of People in the Labor Force in Livingston?
63.7% of People are in the Labor Force in Livingston.
What is the Unemployment Rate in Livingston?
Unemployment Rate in Livingston is 10.1%.