Cities with the Highest Percentage of Filipino Population in the United States
RELATED REPORTS & OPTIONS
Filipino
United States
Compare Cities
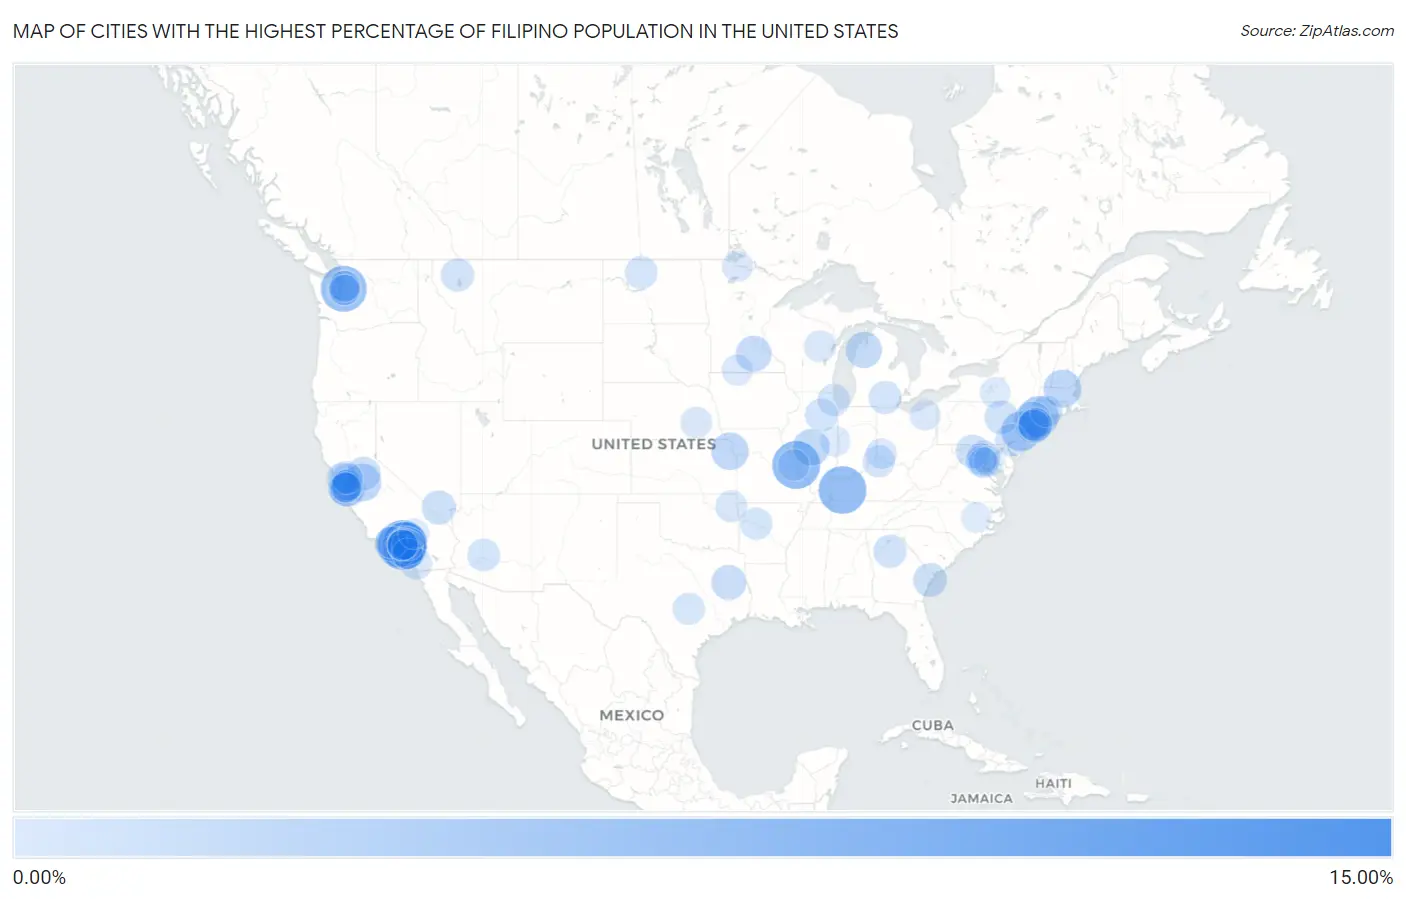
Map of Cities with the Highest Percentage of Filipino Population in the United States
0.00%
15.00%
Cities with the Highest Percentage of Filipino Population in the United States
| City | Filipino | vs State | vs National | |
| 1. | Morgan Hill | 11.73% | 0.037%(+11.7)#1 | 0.085%(+11.6)#1 |
| 2. | San Marino | 7.10% | 0.31%(+6.79)#1 | 0.085%(+7.01)#2 |
| 3. | Frontenac | 6.60% | 0.042%(+6.55)#1 | 0.085%(+6.51)#3 |
| 4. | Greenville | 6.57% | 0.025%(+6.54)#1 | 0.085%(+6.48)#4 |
| 5. | Yarrow Point | 6.02% | 0.19%(+5.83)#1 | 0.085%(+5.93)#5 |
| 6. | Arcadia | 5.35% | 0.31%(+5.05)#2 | 0.085%(+5.27)#6 |
| 7. | Bradbury | 5.35% | 0.31%(+5.04)#3 | 0.085%(+5.26)#7 |
| 8. | Rowland Heights | 4.59% | 0.31%(+4.29)#4 | 0.085%(+4.51)#8 |
| 9. | Walnut | 4.36% | 0.31%(+4.06)#5 | 0.085%(+4.28)#9 |
| 10. | Cannondale | 4.32% | 0.056%(+4.27)#1 | 0.085%(+4.24)#10 |
| 11. | Harlingen | 4.20% | 0.11%(+4.08)#1 | 0.085%(+4.11)#11 |
| 12. | Diamond Bar | 3.68% | 0.31%(+3.37)#6 | 0.085%(+3.60)#12 |
| 13. | Townsend | 3.63% | 0.11%(+3.52)#1 | 0.085%(+3.54)#13 |
| 14. | East San Gabriel | 3.54% | 0.31%(+3.23)#7 | 0.085%(+3.45)#14 |
| 15. | Airport | 3.53% | 0.31%(+3.23)#8 | 0.085%(+3.45)#15 |
| 16. | Easton | 3.47% | 0.032%(+3.44)#1 | 0.085%(+3.39)#16 |
| 17. | Irvington | 3.32% | 0.11%(+3.21)#1 | 0.085%(+3.24)#17 |
| 18. | Greenville Cdp Westchester County | 3.28% | 0.11%(+3.17)#2 | 0.085%(+3.19)#18 |
| 19. | Russell Gardens | 3.27% | 0.11%(+3.16)#3 | 0.085%(+3.19)#19 |
| 20. | Jeisyville | 3.26% | 0.059%(+3.20)#1 | 0.085%(+3.18)#20 |
| 21. | Palos Verdes Estates | 3.22% | 0.31%(+2.92)#9 | 0.085%(+3.14)#21 |
| 22. | Dilworthtown | 3.20% | 0.037%(+3.16)#2 | 0.085%(+3.11)#22 |
| 23. | One Loudoun | 3.17% | 0.069%(+3.10)#1 | 0.085%(+3.08)#23 |
| 24. | Saratoga | 3.14% | 0.31%(+2.84)#10 | 0.085%(+3.06)#24 |
| 25. | Chums Corner | 3.13% | 0.038%(+3.09)#1 | 0.085%(+3.04)#25 |
| 26. | Cerritos | 3.05% | 0.31%(+2.75)#11 | 0.085%(+2.97)#26 |
| 27. | Lonsdale | 3.05% | 0.038%(+3.01)#1 | 0.085%(+2.96)#27 |
| 28. | Westlake Village | 2.93% | 0.31%(+2.62)#12 | 0.085%(+2.85)#28 |
| 29. | New Canaan | 2.93% | 0.056%(+2.87)#2 | 0.085%(+2.84)#29 |
| 30. | Cupertino | 2.81% | 0.31%(+2.51)#13 | 0.085%(+2.73)#30 |
| 31. | Gallatin | 2.79% | 0.075%(+2.72)#1 | 0.085%(+2.71)#31 |
| 32. | Roslyn Heights | 2.72% | 0.11%(+2.61)#4 | 0.085%(+2.63)#32 |
| 33. | Hacienda Heights | 2.60% | 0.31%(+2.30)#14 | 0.085%(+2.52)#33 |
| 34. | Temple City | 2.54% | 0.31%(+2.23)#15 | 0.085%(+2.45)#34 |
| 35. | Mount Charleston | 2.53% | 0.081%(+2.45)#1 | 0.085%(+2.45)#35 |
| 36. | Chino Hills | 2.46% | 0.31%(+2.16)#16 | 0.085%(+2.38)#36 |
| 37. | Dutch Island | 2.44% | 0.042%(+2.40)#1 | 0.085%(+2.36)#37 |
| 38. | Rancho Calaveras | 2.43% | 0.31%(+2.12)#17 | 0.085%(+2.35)#38 |
| 39. | Los Altos Hills | 2.42% | 0.31%(+2.11)#18 | 0.085%(+2.33)#39 |
| 40. | Wanamie | 2.36% | 0.037%(+2.33)#3 | 0.085%(+2.28)#40 |
| 41. | Llewellyn Park | 2.35% | 0.11%(+2.24)#2 | 0.085%(+2.26)#41 |
| 42. | Inwood | 2.33% | 0.0078%(+2.32)#1 | 0.085%(+2.25)#42 |
| 43. | Irvine | 2.33% | 0.31%(+2.02)#19 | 0.085%(+2.25)#43 |
| 44. | Albertson | 2.32% | 0.11%(+2.21)#5 | 0.085%(+2.23)#44 |
| 45. | Neshanic | 2.26% | 0.11%(+2.15)#3 | 0.085%(+2.18)#45 |
| 46. | Lake Hiawatha | 2.26% | 0.11%(+2.14)#4 | 0.085%(+2.17)#46 |
| 47. | Helena Flats | 2.24% | 0.020%(+2.22)#1 | 0.085%(+2.16)#47 |
| 48. | Walnut Grove | 2.22% | 0.042%(+2.18)#2 | 0.085%(+2.14)#48 |
| 49. | Grass Lake | 2.21% | 0.038%(+2.17)#2 | 0.085%(+2.12)#49 |
| 50. | University Of California-Santa Barbara | 2.14% | 0.31%(+1.83)#20 | 0.085%(+2.06)#50 |
| 51. | Reliez Valley | 2.13% | 0.31%(+1.82)#21 | 0.085%(+2.05)#51 |
| 52. | Haverford College | 2.12% | 0.037%(+2.08)#4 | 0.085%(+2.03)#52 |
| 53. | Marseilles | 2.12% | 0.059%(+2.06)#2 | 0.085%(+2.03)#53 |
| 54. | Ruthville | 2.11% | 0.011%(+2.10)#1 | 0.085%(+2.03)#54 |
| 55. | Citrus Park | 2.08% | 0.054%(+2.03)#1 | 0.085%(+2.00)#55 |
| 56. | Northfield | 2.03% | 0.059%(+1.97)#3 | 0.085%(+1.95)#56 |
| 57. | San Miguel Cdp Contra Costa County | 2.00% | 0.31%(+1.69)#22 | 0.085%(+1.91)#57 |
| 58. | Bee Cave | 2.00% | 0.075%(+1.92)#2 | 0.085%(+1.91)#58 |
| 59. | Rancho Palos Verdes | 1.99% | 0.31%(+1.69)#23 | 0.085%(+1.91)#59 |
| 60. | London | 1.98% | 0.0096%(+1.97)#1 | 0.085%(+1.89)#60 |
| 61. | Mountain View | 1.93% | 0.31%(+1.63)#24 | 0.085%(+1.85)#61 |
| 62. | Verona | 1.92% | 0.025%(+1.90)#2 | 0.085%(+1.83)#62 |
| 63. | Cheshire Village | 1.91% | 0.056%(+1.85)#3 | 0.085%(+1.82)#63 |
| 64. | Highlands | 1.90% | 0.31%(+1.60)#25 | 0.085%(+1.82)#64 |
| 65. | Albany | 1.90% | 0.31%(+1.60)#26 | 0.085%(+1.82)#65 |
| 66. | South Monrovia Island | 1.89% | 0.31%(+1.58)#27 | 0.085%(+1.80)#66 |
| 67. | North Potomac | 1.88% | 0.10%(+1.78)#1 | 0.085%(+1.80)#67 |
| 68. | Kenwood | 1.88% | 0.027%(+1.85)#1 | 0.085%(+1.79)#68 |
| 69. | Fairbanks Ranch | 1.86% | 0.31%(+1.55)#28 | 0.085%(+1.77)#69 |
| 70. | Gresham | 1.85% | 0.028%(+1.83)#1 | 0.085%(+1.77)#70 |
| 71. | Clarkson Valley | 1.80% | 0.042%(+1.76)#2 | 0.085%(+1.72)#71 |
| 72. | Kenmore | 1.78% | 0.19%(+1.59)#2 | 0.085%(+1.70)#72 |
| 73. | Fremont | 1.78% | 0.31%(+1.47)#29 | 0.085%(+1.69)#73 |
| 74. | Sierra Madre | 1.77% | 0.31%(+1.46)#30 | 0.085%(+1.68)#74 |
| 75. | Santa Rosa Valley | 1.75% | 0.31%(+1.45)#31 | 0.085%(+1.67)#75 |
| 76. | Waco | 1.75% | 0.030%(+1.72)#1 | 0.085%(+1.67)#76 |
| 77. | Welcome | 1.70% | 0.038%(+1.66)#2 | 0.085%(+1.61)#77 |
| 78. | Mckinley | 1.68% | 0.037%(+1.64)#5 | 0.085%(+1.59)#78 |
| 79. | San Dimas | 1.67% | 0.31%(+1.36)#32 | 0.085%(+1.58)#79 |
| 80. | San Gabriel | 1.67% | 0.31%(+1.36)#33 | 0.085%(+1.58)#80 |
| 81. | Floris | 1.64% | 0.069%(+1.58)#2 | 0.085%(+1.56)#81 |
| 82. | Thomaston | 1.64% | 0.11%(+1.53)#6 | 0.085%(+1.55)#82 |
| 83. | Mercer Island | 1.60% | 0.19%(+1.41)#3 | 0.085%(+1.51)#83 |
| 84. | Baudette | 1.59% | 0.038%(+1.56)#3 | 0.085%(+1.51)#84 |
| 85. | Woodinville | 1.59% | 0.19%(+1.41)#4 | 0.085%(+1.51)#85 |
| 86. | Alamo | 1.59% | 0.31%(+1.28)#34 | 0.085%(+1.50)#86 |
| 87. | Fair Lakes | 1.58% | 0.069%(+1.51)#3 | 0.085%(+1.50)#87 |
| 88. | Evendale | 1.58% | 0.030%(+1.55)#1 | 0.085%(+1.49)#88 |
| 89. | Beaux Arts Village | 1.55% | 0.19%(+1.36)#5 | 0.085%(+1.47)#89 |
| 90. | Aurora | 1.54% | 0.030%(+1.51)#2 | 0.085%(+1.45)#90 |
| 91. | Laguna Woods | 1.54% | 0.31%(+1.23)#35 | 0.085%(+1.45)#91 |
| 92. | Cayuga Heights | 1.53% | 0.11%(+1.42)#7 | 0.085%(+1.45)#92 |
| 93. | Indianola | 1.52% | 0.059%(+1.46)#4 | 0.085%(+1.44)#93 |
| 94. | Silver Lakes | 1.52% | 0.31%(+1.21)#36 | 0.085%(+1.43)#94 |
| 95. | Andrews Afb | 1.48% | 0.10%(+1.38)#2 | 0.085%(+1.40)#95 |
| 96. | South Run | 1.48% | 0.069%(+1.41)#4 | 0.085%(+1.40)#96 |
| 97. | Palo Alto | 1.47% | 0.31%(+1.16)#37 | 0.085%(+1.38)#97 |
| 98. | Alhambra | 1.46% | 0.31%(+1.16)#38 | 0.085%(+1.38)#98 |
| 99. | Los Altos | 1.46% | 0.31%(+1.15)#39 | 0.085%(+1.37)#99 |
| 100. | Saratoga | 1.45% | 0.032%(+1.42)#1 | 0.085%(+1.36)#100 |
Common Questions
What are the Top 10 Cities with the Highest Percentage of Filipino Population in the United States?
Top 10 Cities with the Highest Percentage of Filipino Population in the United States are:
#1
7.10%
#2
6.60%
#3
6.57%
#4
6.02%
#5
5.35%
#6
5.35%
#7
4.59%
#8
4.36%
#9
4.32%
#10
4.20%
What city has the Highest Percentage of Filipino Population in the United States?
San Marino has the Highest Percentage of Filipino Population in the United States with 7.10%.
What is the Percentage of Filipino Population in the United States?
Percentage of Filipino Population in the United States is 0.085%.