Cities with the Highest Percentage of Brazilian Population in New York
RELATED REPORTS & OPTIONS
Brazilian
New York
Compare Cities
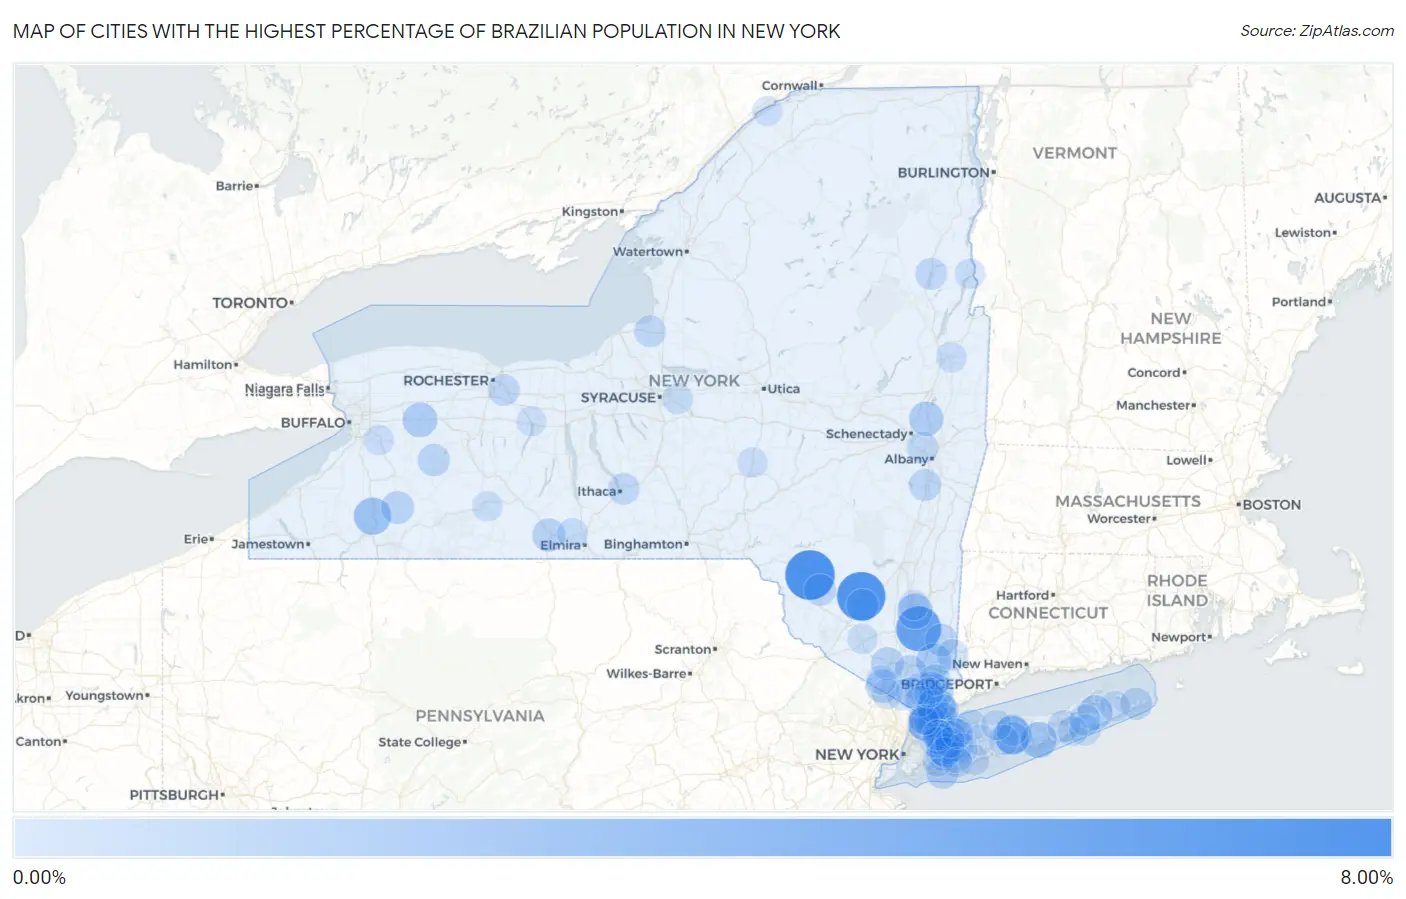
Map of Cities with the Highest Percentage of Brazilian Population in New York
0.00%
8.00%
Cities with the Highest Percentage of Brazilian Population in New York
| City | Brazilian | vs State | vs National | |
| 1. | Livingston Manor | 6.26% | 0.13%(+6.12)#1 | 0.15%(+6.10)#30 |
| 2. | Napanoch | 5.93% | 0.13%(+5.80)#2 | 0.15%(+5.78)#33 |
| 3. | Merritt Park | 4.84% | 0.13%(+4.71)#3 | 0.15%(+4.69)#39 |
| 4. | Harrison | 2.95% | 0.13%(+2.81)#4 | 0.15%(+2.79)#89 |
| 5. | Farmingville | 2.53% | 0.13%(+2.40)#5 | 0.15%(+2.38)#114 |
| 6. | Ellicottville | 2.41% | 0.13%(+2.27)#6 | 0.15%(+2.25)#123 |
| 7. | Moriches | 2.02% | 0.13%(+1.88)#7 | 0.15%(+1.86)#160 |
| 8. | Shenorock | 1.86% | 0.13%(+1.72)#8 | 0.15%(+1.70)#171 |
| 9. | Spackenkill | 1.85% | 0.13%(+1.71)#9 | 0.15%(+1.69)#173 |
| 10. | Pelham | 1.83% | 0.13%(+1.70)#10 | 0.15%(+1.68)#174 |
| 11. | Mamaroneck | 1.70% | 0.13%(+1.56)#11 | 0.15%(+1.54)#192 |
| 12. | Noyack | 1.58% | 0.13%(+1.45)#12 | 0.15%(+1.43)#208 |
| 13. | Alexander | 1.58% | 0.13%(+1.44)#13 | 0.15%(+1.42)#211 |
| 14. | Armonk | 1.58% | 0.13%(+1.44)#14 | 0.15%(+1.42)#212 |
| 15. | Country Knolls | 1.53% | 0.13%(+1.40)#15 | 0.15%(+1.38)#219 |
| 16. | Mineola | 1.46% | 0.13%(+1.32)#16 | 0.15%(+1.30)#235 |
| 17. | Eastchester | 1.44% | 0.13%(+1.30)#17 | 0.15%(+1.29)#239 |
| 18. | Setauket | 1.34% | 0.13%(+1.20)#18 | 0.15%(+1.18)#268 |
| 19. | Varna | 1.29% | 0.13%(+1.15)#19 | 0.15%(+1.13)#283 |
| 20. | Sloatsburg | 1.22% | 0.13%(+1.08)#20 | 0.15%(+1.06)#305 |
| 21. | Gang Mills | 1.18% | 0.13%(+1.05)#21 | 0.15%(+1.03)#318 |
| 22. | Harriman | 1.12% | 0.13%(+0.982)#22 | 0.15%(+0.963)#349 |
| 23. | Holtsville | 1.11% | 0.13%(+0.978)#23 | 0.15%(+0.959)#350 |
| 24. | Garden City South | 1.09% | 0.13%(+0.959)#24 | 0.15%(+0.940)#358 |
| 25. | Garden City Park | 1.09% | 0.13%(+0.958)#25 | 0.15%(+0.939)#359 |
| 26. | Franklinville | 1.08% | 0.13%(+0.946)#26 | 0.15%(+0.927)#362 |
| 27. | Long Beach | 1.04% | 0.13%(+0.907)#27 | 0.15%(+0.888)#380 |
| 28. | Mount Vernon | 1.04% | 0.13%(+0.902)#28 | 0.15%(+0.883)#383 |
| 29. | Rye | 0.95% | 0.13%(+0.820)#29 | 0.15%(+0.801)#422 |
| 30. | Glenwood Landing | 0.95% | 0.13%(+0.813)#30 | 0.15%(+0.794)#426 |
| 31. | Briarcliff Manor | 0.95% | 0.13%(+0.812)#31 | 0.15%(+0.793)#427 |
| 32. | Lake Carmel | 0.94% | 0.13%(+0.805)#32 | 0.15%(+0.786)#428 |
| 33. | Gainesville | 0.93% | 0.13%(+0.791)#33 | 0.15%(+0.772)#434 |
| 34. | Ellenville | 0.93% | 0.13%(+0.791)#34 | 0.15%(+0.772)#435 |
| 35. | Flanders | 0.89% | 0.13%(+0.754)#35 | 0.15%(+0.735)#459 |
| 36. | Buchanan | 0.88% | 0.13%(+0.745)#36 | 0.15%(+0.726)#461 |
| 37. | Ravena | 0.86% | 0.13%(+0.724)#37 | 0.15%(+0.705)#470 |
| 38. | Liberty | 0.82% | 0.13%(+0.680)#38 | 0.15%(+0.661)#490 |
| 39. | Montauk | 0.81% | 0.13%(+0.675)#39 | 0.15%(+0.656)#495 |
| 40. | New Rochelle | 0.80% | 0.13%(+0.666)#40 | 0.15%(+0.647)#500 |
| 41. | Mexico | 0.78% | 0.13%(+0.644)#41 | 0.15%(+0.625)#511 |
| 42. | White Plains | 0.77% | 0.13%(+0.639)#42 | 0.15%(+0.620)#517 |
| 43. | Hicksville | 0.77% | 0.13%(+0.634)#43 | 0.15%(+0.615)#520 |
| 44. | Schroon Lake | 0.76% | 0.13%(+0.621)#44 | 0.15%(+0.602)#527 |
| 45. | Upper Brookville | 0.74% | 0.13%(+0.610)#45 | 0.15%(+0.591)#534 |
| 46. | Pittsford | 0.73% | 0.13%(+0.595)#46 | 0.15%(+0.576)#550 |
| 47. | Forest Home | 0.72% | 0.13%(+0.588)#47 | 0.15%(+0.569)#555 |
| 48. | Chappaqua | 0.71% | 0.13%(+0.576)#48 | 0.15%(+0.557)#563 |
| 49. | Colonie | 0.70% | 0.13%(+0.560)#49 | 0.15%(+0.541)#577 |
| 50. | Peach Lake | 0.67% | 0.13%(+0.532)#50 | 0.15%(+0.513)#601 |
| 51. | Selden | 0.66% | 0.13%(+0.527)#51 | 0.15%(+0.508)#610 |
| 52. | Port Chester | 0.65% | 0.13%(+0.511)#52 | 0.15%(+0.492)#629 |
| 53. | Oyster Bay | 0.63% | 0.13%(+0.498)#53 | 0.15%(+0.479)#641 |
| 54. | Flower Hill | 0.63% | 0.13%(+0.492)#54 | 0.15%(+0.473)#647 |
| 55. | Southampton | 0.62% | 0.13%(+0.490)#55 | 0.15%(+0.471)#649 |
| 56. | Mount Kisco | 0.62% | 0.13%(+0.484)#56 | 0.15%(+0.465)#658 |
| 57. | North Sea | 0.61% | 0.13%(+0.476)#57 | 0.15%(+0.457)#668 |
| 58. | Plandome Manor | 0.60% | 0.13%(+0.467)#58 | 0.15%(+0.448)#678 |
| 59. | Nanuet | 0.58% | 0.13%(+0.443)#59 | 0.15%(+0.424)#709 |
| 60. | Westbury | 0.56% | 0.13%(+0.429)#60 | 0.15%(+0.410)#722 |
| 61. | Old Brookville | 0.55% | 0.13%(+0.410)#61 | 0.15%(+0.391)#738 |
| 62. | Big Flats | 0.51% | 0.13%(+0.379)#62 | 0.15%(+0.360)#785 |
| 63. | Manorhaven | 0.51% | 0.13%(+0.370)#63 | 0.15%(+0.351)#794 |
| 64. | Fayetteville | 0.47% | 0.13%(+0.336)#64 | 0.15%(+0.317)#849 |
| 65. | Valley Stream | 0.46% | 0.13%(+0.322)#65 | 0.15%(+0.303)#873 |
| 66. | Huntington Bay | 0.45% | 0.13%(+0.316)#66 | 0.15%(+0.297)#879 |
| 67. | Dix Hills | 0.43% | 0.13%(+0.295)#67 | 0.15%(+0.276)#912 |
| 68. | Copiague | 0.41% | 0.13%(+0.279)#68 | 0.15%(+0.260)#940 |
| 69. | Carle Place | 0.41% | 0.13%(+0.274)#69 | 0.15%(+0.255)#949 |
| 70. | Tarrytown | 0.41% | 0.13%(+0.273)#70 | 0.15%(+0.254)#953 |
| 71. | Rochester Institute Of Technology | 0.41% | 0.13%(+0.272)#71 | 0.15%(+0.253)#954 |
| 72. | Clifton Gardens | 0.41% | 0.13%(+0.272)#72 | 0.15%(+0.253)#955 |
| 73. | Bethpage | 0.40% | 0.13%(+0.264)#73 | 0.15%(+0.245)#974 |
| 74. | Valley Cottage | 0.40% | 0.13%(+0.262)#74 | 0.15%(+0.243)#979 |
| 75. | Springs | 0.39% | 0.13%(+0.258)#75 | 0.15%(+0.239)#997 |
| 76. | Suffern | 0.39% | 0.13%(+0.252)#76 | 0.15%(+0.233)#1,007 |
| 77. | Ticonderoga | 0.38% | 0.13%(+0.248)#77 | 0.15%(+0.229)#1,014 |
| 78. | North Bellmore | 0.38% | 0.13%(+0.245)#78 | 0.15%(+0.226)#1,025 |
| 79. | New Berlin | 0.37% | 0.13%(+0.238)#79 | 0.15%(+0.219)#1,040 |
| 80. | East Aurora | 0.35% | 0.13%(+0.215)#80 | 0.15%(+0.196)#1,092 |
| 81. | Hudson Falls | 0.35% | 0.13%(+0.215)#81 | 0.15%(+0.196)#1,093 |
| 82. | Siena College | 0.35% | 0.13%(+0.214)#82 | 0.15%(+0.195)#1,097 |
| 83. | Port Washington North | 0.35% | 0.13%(+0.212)#83 | 0.15%(+0.193)#1,105 |
| 84. | Kensington | 0.35% | 0.13%(+0.211)#84 | 0.15%(+0.192)#1,108 |
| 85. | Ronkonkoma | 0.35% | 0.13%(+0.210)#85 | 0.15%(+0.191)#1,111 |
| 86. | Fairview Cdp Dutchess County | 0.34% | 0.13%(+0.208)#86 | 0.15%(+0.189)#1,118 |
| 87. | Scotchtown | 0.33% | 0.13%(+0.194)#87 | 0.15%(+0.175)#1,167 |
| 88. | Nissequogue | 0.33% | 0.13%(+0.193)#88 | 0.15%(+0.174)#1,168 |
| 89. | Garden City | 0.32% | 0.13%(+0.189)#89 | 0.15%(+0.170)#1,186 |
| 90. | Bronxville | 0.32% | 0.13%(+0.185)#90 | 0.15%(+0.166)#1,198 |
| 91. | Old Westbury | 0.32% | 0.13%(+0.183)#91 | 0.15%(+0.164)#1,205 |
| 92. | Hornell | 0.32% | 0.13%(+0.182)#92 | 0.15%(+0.163)#1,207 |
| 93. | Poughkeepsie | 0.29% | 0.13%(+0.155)#93 | 0.15%(+0.136)#1,294 |
| 94. | Bellmore | 0.29% | 0.13%(+0.154)#94 | 0.15%(+0.135)#1,298 |
| 95. | Tuxedo Park | 0.29% | 0.13%(+0.151)#95 | 0.15%(+0.132)#1,313 |
| 96. | Canandaigua | 0.28% | 0.13%(+0.149)#96 | 0.15%(+0.130)#1,318 |
| 97. | Waddington | 0.28% | 0.13%(+0.148)#97 | 0.15%(+0.129)#1,320 |
| 98. | East Norwich | 0.28% | 0.13%(+0.148)#98 | 0.15%(+0.129)#1,322 |
| 99. | Thornwood | 0.27% | 0.13%(+0.138)#99 | 0.15%(+0.119)#1,344 |
| 100. | Hampton Bays | 0.26% | 0.13%(+0.125)#100 | 0.15%(+0.106)#1,387 |
Common Questions
What are the Top 10 Cities with the Highest Percentage of Brazilian Population in New York?
Top 10 Cities with the Highest Percentage of Brazilian Population in New York are:
#1
6.26%
#2
5.93%
#3
4.84%
#4
2.95%
#5
2.53%
#6
2.41%
#7
2.02%
#8
1.86%
#9
1.85%
#10
1.83%
What city has the Highest Percentage of Brazilian Population in New York?
Livingston Manor has the Highest Percentage of Brazilian Population in New York with 6.26%.
What is the Percentage of Brazilian Population in the State of New York?
Percentage of Brazilian Population in New York is 0.13%.
What is the Percentage of Brazilian Population in the United States?
Percentage of Brazilian Population in the United States is 0.15%.