Cities with the Highest Percentage of Brazilian Population in the United States
RELATED REPORTS & OPTIONS
Brazilian
United States
Compare Cities
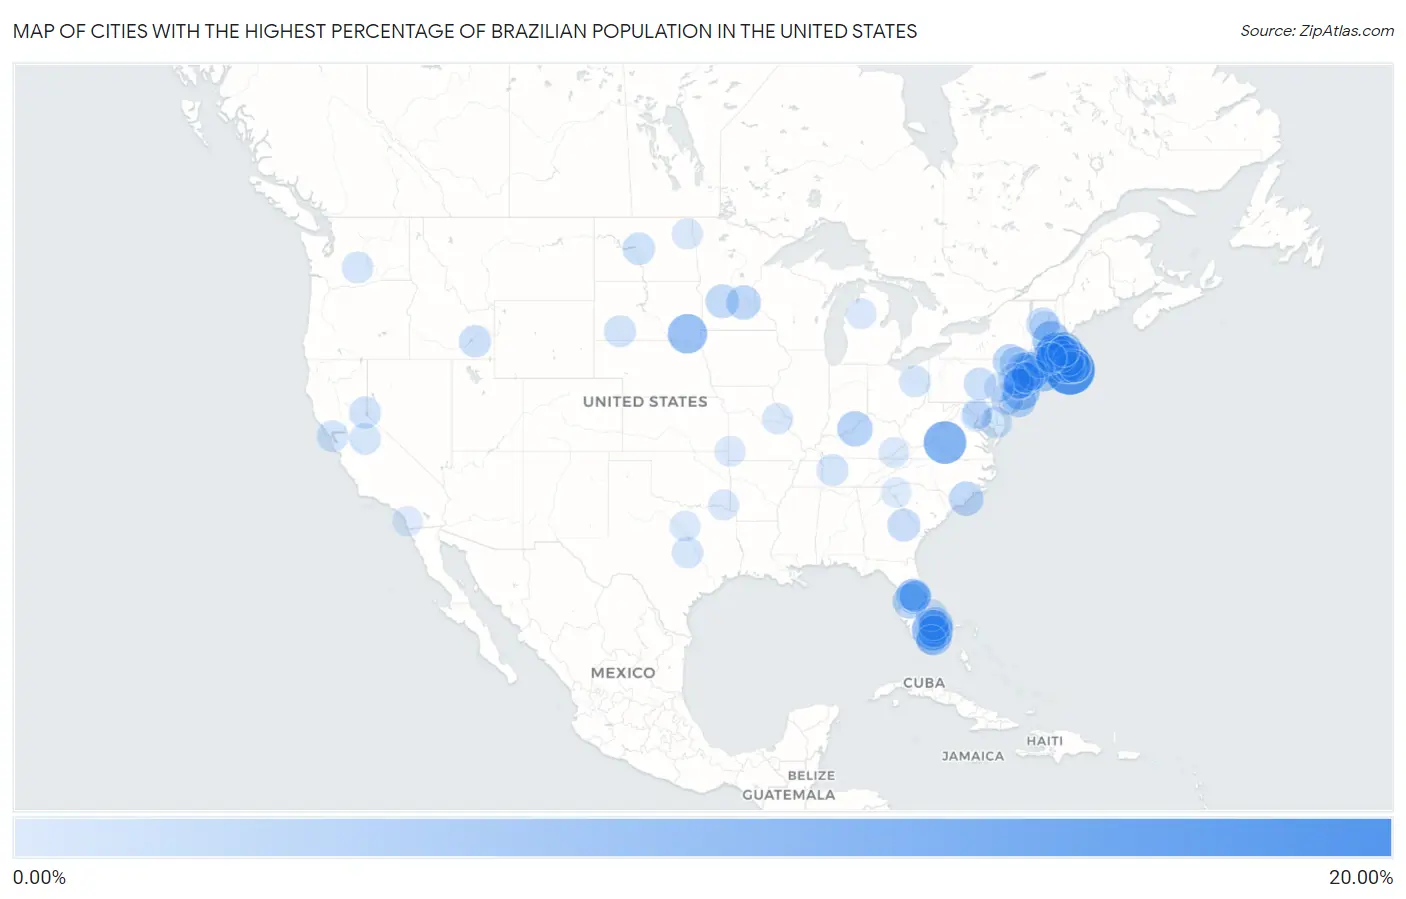
Map of Cities with the Highest Percentage of Brazilian Population in the United States
0.00%
20.00%
Cities with the Highest Percentage of Brazilian Population in the United States
| City | Brazilian | vs State | vs National | |
| 1. | Vineyard Haven | 19.48% | 1.21%(+18.3)#1 | 0.15%(+19.3)#1 |
| 2. | Milford | 14.48% | 1.21%(+13.3)#2 | 0.15%(+14.3)#2 |
| 3. | Big Island | 13.26% | 0.10%(+13.2)#1 | 0.15%(+13.1)#3 |
| 4. | Watergate | 11.93% | 0.49%(+11.4)#1 | 0.15%(+11.8)#4 |
| 5. | Framingham | 11.74% | 1.21%(+10.5)#3 | 0.15%(+11.6)#5 |
| 6. | North Plymouth | 11.63% | 1.21%(+10.4)#4 | 0.15%(+11.5)#6 |
| 7. | Marlborough | 10.79% | 1.21%(+9.58)#5 | 0.15%(+10.6)#7 |
| 8. | Freeman | 10.51% | 0.034%(+10.5)#1 | 0.15%(+10.4)#8 |
| 9. | Bethel | 9.81% | 0.72%(+9.09)#1 | 0.15%(+9.65)#9 |
| 10. | Clayville | 9.80% | 0.22%(+9.59)#1 | 0.15%(+9.65)#10 |
| 11. | Everett | 9.37% | 1.21%(+8.16)#6 | 0.15%(+9.21)#11 |
| 12. | Lakes West | 9.35% | 0.72%(+8.64)#2 | 0.15%(+9.20)#12 |
| 13. | Westbrook Center | 9.11% | 0.72%(+8.39)#3 | 0.15%(+8.95)#13 |
| 14. | Bennington | 9.09% | 0.22%(+8.87)#1 | 0.15%(+8.94)#14 |
| 15. | Long Branch | 8.96% | 0.51%(+8.45)#1 | 0.15%(+8.81)#15 |
| 16. | Deerfield Beach | 8.88% | 0.49%(+8.38)#2 | 0.15%(+8.72)#16 |
| 17. | Indian Creek | 7.41% | 0.49%(+6.91)#3 | 0.15%(+7.25)#17 |
| 18. | Lake Clarke Shores | 7.40% | 0.49%(+6.91)#4 | 0.15%(+7.25)#18 |
| 19. | Byram | 7.40% | 0.72%(+6.68)#4 | 0.15%(+7.24)#19 |
| 20. | Murray | 7.07% | 0.72%(+6.36)#5 | 0.15%(+6.92)#20 |
| 21. | Maryhill Estates | 7.05% | 0.026%(+7.03)#1 | 0.15%(+6.90)#21 |
| 22. | Oak Bluffs | 6.90% | 1.21%(+5.70)#7 | 0.15%(+6.75)#22 |
| 23. | Horizon West | 6.85% | 0.49%(+6.35)#5 | 0.15%(+6.69)#23 |
| 24. | Trumbull Center | 6.83% | 0.72%(+6.11)#6 | 0.15%(+6.68)#24 |
| 25. | Polk City | 6.58% | 0.49%(+6.09)#6 | 0.15%(+6.43)#25 |
| 26. | Route 7 Gateway | 6.54% | 0.72%(+5.82)#7 | 0.15%(+6.39)#26 |
| 27. | Barnstable Town | 6.48% | 1.21%(+5.27)#8 | 0.15%(+6.33)#27 |
| 28. | Forked River | 6.40% | 0.51%(+5.89)#2 | 0.15%(+6.24)#28 |
| 29. | Northchase | 6.26% | 0.080%(+6.18)#1 | 0.15%(+6.11)#29 |
| 30. | Livingston Manor | 6.26% | 0.13%(+6.12)#1 | 0.15%(+6.10)#30 |
| 31. | Mattapoisett Center | 6.24% | 1.21%(+5.03)#9 | 0.15%(+6.08)#31 |
| 32. | Greenwood | 6.20% | 0.041%(+6.16)#1 | 0.15%(+6.05)#32 |
| 33. | Napanoch | 5.93% | 0.13%(+5.80)#2 | 0.15%(+5.78)#33 |
| 34. | Blomkest | 5.75% | 0.041%(+5.71)#2 | 0.15%(+5.59)#34 |
| 35. | Danbury | 5.62% | 0.72%(+4.90)#8 | 0.15%(+5.47)#35 |
| 36. | Coconut Creek | 5.59% | 0.49%(+5.10)#7 | 0.15%(+5.44)#36 |
| 37. | Ellerslie | 5.01% | 0.16%(+4.85)#1 | 0.15%(+4.86)#37 |
| 38. | Summertown | 5.00% | 0.16%(+4.84)#2 | 0.15%(+4.85)#38 |
| 39. | Merritt Park | 4.84% | 0.13%(+4.71)#3 | 0.15%(+4.69)#39 |
| 40. | South Royalton | 4.84% | 0.058%(+4.78)#1 | 0.15%(+4.69)#40 |
| 41. | Newark | 4.79% | 0.51%(+4.29)#3 | 0.15%(+4.64)#41 |
| 42. | Kingston Estates | 4.67% | 0.51%(+4.17)#4 | 0.15%(+4.52)#42 |
| 43. | Tangelo Park | 4.64% | 0.49%(+4.15)#8 | 0.15%(+4.49)#43 |
| 44. | Port Trevorton | 4.61% | 0.093%(+4.52)#1 | 0.15%(+4.46)#44 |
| 45. | Turtle Lake | 4.57% | 0.022%(+4.55)#1 | 0.15%(+4.42)#45 |
| 46. | South Yarmouth | 4.52% | 1.21%(+3.31)#10 | 0.15%(+4.36)#46 |
| 47. | Kearny | 4.49% | 0.51%(+3.98)#5 | 0.15%(+4.33)#47 |
| 48. | West Yarmouth | 4.46% | 1.21%(+3.25)#11 | 0.15%(+4.31)#48 |
| 49. | Union | 4.44% | 0.51%(+3.93)#6 | 0.15%(+4.28)#49 |
| 50. | Tyhee | 4.36% | 0.051%(+4.31)#1 | 0.15%(+4.20)#50 |
| 51. | River Park | 4.25% | 0.49%(+3.76)#9 | 0.15%(+4.10)#51 |
| 52. | Dollar Point | 4.22% | 0.12%(+4.10)#1 | 0.15%(+4.06)#52 |
| 53. | Hudson | 4.13% | 1.21%(+2.92)#12 | 0.15%(+3.98)#53 |
| 54. | Kyle | 4.12% | 0.034%(+4.09)#2 | 0.15%(+3.97)#54 |
| 55. | Cos Cob | 4.10% | 0.72%(+3.38)#9 | 0.15%(+3.95)#55 |
| 56. | Bon Aqua Junction | 4.05% | 0.046%(+4.01)#1 | 0.15%(+3.90)#56 |
| 57. | Blue Hills | 4.05% | 0.72%(+3.33)#10 | 0.15%(+3.89)#57 |
| 58. | Malden | 4.03% | 1.21%(+2.83)#13 | 0.15%(+3.88)#58 |
| 59. | Eldorado | 4.00% | 0.19%(+3.81)#1 | 0.15%(+3.85)#59 |
| 60. | Tiburon | 3.99% | 0.12%(+3.87)#2 | 0.15%(+3.84)#60 |
| 61. | Oakland | 3.96% | 0.49%(+3.46)#10 | 0.15%(+3.80)#61 |
| 62. | Hills And Dales | 3.94% | 0.041%(+3.90)#1 | 0.15%(+3.78)#62 |
| 63. | Falmouth | 3.84% | 1.21%(+2.63)#14 | 0.15%(+3.68)#63 |
| 64. | Quinebaug | 3.81% | 0.72%(+3.09)#11 | 0.15%(+3.65)#64 |
| 65. | Summitview | 3.79% | 0.11%(+3.68)#1 | 0.15%(+3.63)#65 |
| 66. | Morgan S Point Resort | 3.78% | 0.080%(+3.70)#1 | 0.15%(+3.62)#66 |
| 67. | Greeley Hill | 3.75% | 0.12%(+3.63)#3 | 0.15%(+3.60)#67 |
| 68. | Pompano Beach | 3.74% | 0.49%(+3.24)#11 | 0.15%(+3.58)#68 |
| 69. | Norwood | 3.68% | 1.21%(+2.47)#15 | 0.15%(+3.52)#69 |
| 70. | Plymouth | 3.67% | 1.21%(+2.47)#16 | 0.15%(+3.52)#70 |
| 71. | Doctor Phillips | 3.66% | 0.49%(+3.16)#12 | 0.15%(+3.50)#71 |
| 72. | Bridgeport | 3.60% | 0.72%(+2.88)#12 | 0.15%(+3.44)#72 |
| 73. | Lake Telemark | 3.54% | 0.51%(+3.03)#7 | 0.15%(+3.38)#73 |
| 74. | Revere | 3.47% | 1.21%(+2.26)#17 | 0.15%(+3.31)#74 |
| 75. | Truesdale | 3.46% | 0.034%(+3.42)#1 | 0.15%(+3.30)#75 |
| 76. | Forest River | 3.42% | 0.022%(+3.40)#2 | 0.15%(+3.26)#76 |
| 77. | Ampere North | 3.41% | 0.51%(+2.90)#8 | 0.15%(+3.25)#77 |
| 78. | Candlewood Orchards | 3.36% | 0.72%(+2.64)#13 | 0.15%(+3.20)#78 |
| 79. | Wilder | 3.36% | 0.058%(+3.30)#2 | 0.15%(+3.20)#79 |
| 80. | Garvin | 3.25% | 0.037%(+3.21)#1 | 0.15%(+3.09)#80 |
| 81. | Annetta North | 3.18% | 0.080%(+3.10)#2 | 0.15%(+3.03)#81 |
| 82. | Shoal Creek Drive | 3.18% | 0.034%(+3.14)#2 | 0.15%(+3.02)#82 |
| 83. | Harrison | 3.17% | 0.51%(+2.66)#9 | 0.15%(+3.02)#83 |
| 84. | Lake City | 3.13% | 0.054%(+3.08)#1 | 0.15%(+2.98)#84 |
| 85. | Cabin John | 3.05% | 0.19%(+2.86)#2 | 0.15%(+2.90)#85 |
| 86. | Aspen Hill | 3.01% | 0.19%(+2.82)#3 | 0.15%(+2.85)#86 |
| 87. | Oxford | 2.99% | 1.21%(+1.79)#18 | 0.15%(+2.84)#87 |
| 88. | Cumberland | 2.97% | 0.026%(+2.94)#2 | 0.15%(+2.82)#88 |
| 89. | Harrison | 2.95% | 0.13%(+2.81)#4 | 0.15%(+2.79)#89 |
| 90. | East Newark Borough | 2.94% | 0.51%(+2.44)#10 | 0.15%(+2.79)#90 |
| 91. | Rancho Santa Fe | 2.90% | 0.12%(+2.78)#4 | 0.15%(+2.75)#91 |
| 92. | Pendleton | 2.89% | 0.098%(+2.79)#1 | 0.15%(+2.73)#92 |
| 93. | Adamstown Borough | 2.89% | 0.093%(+2.79)#2 | 0.15%(+2.73)#93 |
| 94. | Plantation Mobile Home Park | 2.86% | 0.49%(+2.36)#13 | 0.15%(+2.70)#94 |
| 95. | Ancient Oaks | 2.85% | 0.093%(+2.76)#3 | 0.15%(+2.70)#95 |
| 96. | Cliffside Park Borough | 2.85% | 0.51%(+2.34)#11 | 0.15%(+2.69)#96 |
| 97. | Taylor Corners | 2.83% | 0.72%(+2.11)#14 | 0.15%(+2.67)#97 |
| 98. | Mount Hope | 2.81% | 0.51%(+2.31)#12 | 0.15%(+2.66)#98 |
| 99. | Springfield | 2.81% | 0.51%(+2.30)#13 | 0.15%(+2.65)#99 |
| 100. | South Miami | 2.80% | 0.49%(+2.31)#14 | 0.15%(+2.65)#100 |
Common Questions
What are the Top 10 Cities with the Highest Percentage of Brazilian Population in the United States?
Top 10 Cities with the Highest Percentage of Brazilian Population in the United States are:
#1
19.48%
#2
14.48%
#3
13.26%
#4
11.93%
#5
11.74%
#6
11.63%
#7
10.79%
#8
10.51%
#9
9.81%
#10
9.80%
What city has the Highest Percentage of Brazilian Population in the United States?
Vineyard Haven has the Highest Percentage of Brazilian Population in the United States with 19.48%.
What is the Percentage of Brazilian Population in the United States?
Percentage of Brazilian Population in the United States is 0.15%.