Cities with the Highest Percentage of Brazilian Population in Maryland
RELATED REPORTS & OPTIONS
Brazilian
Maryland
Compare Cities
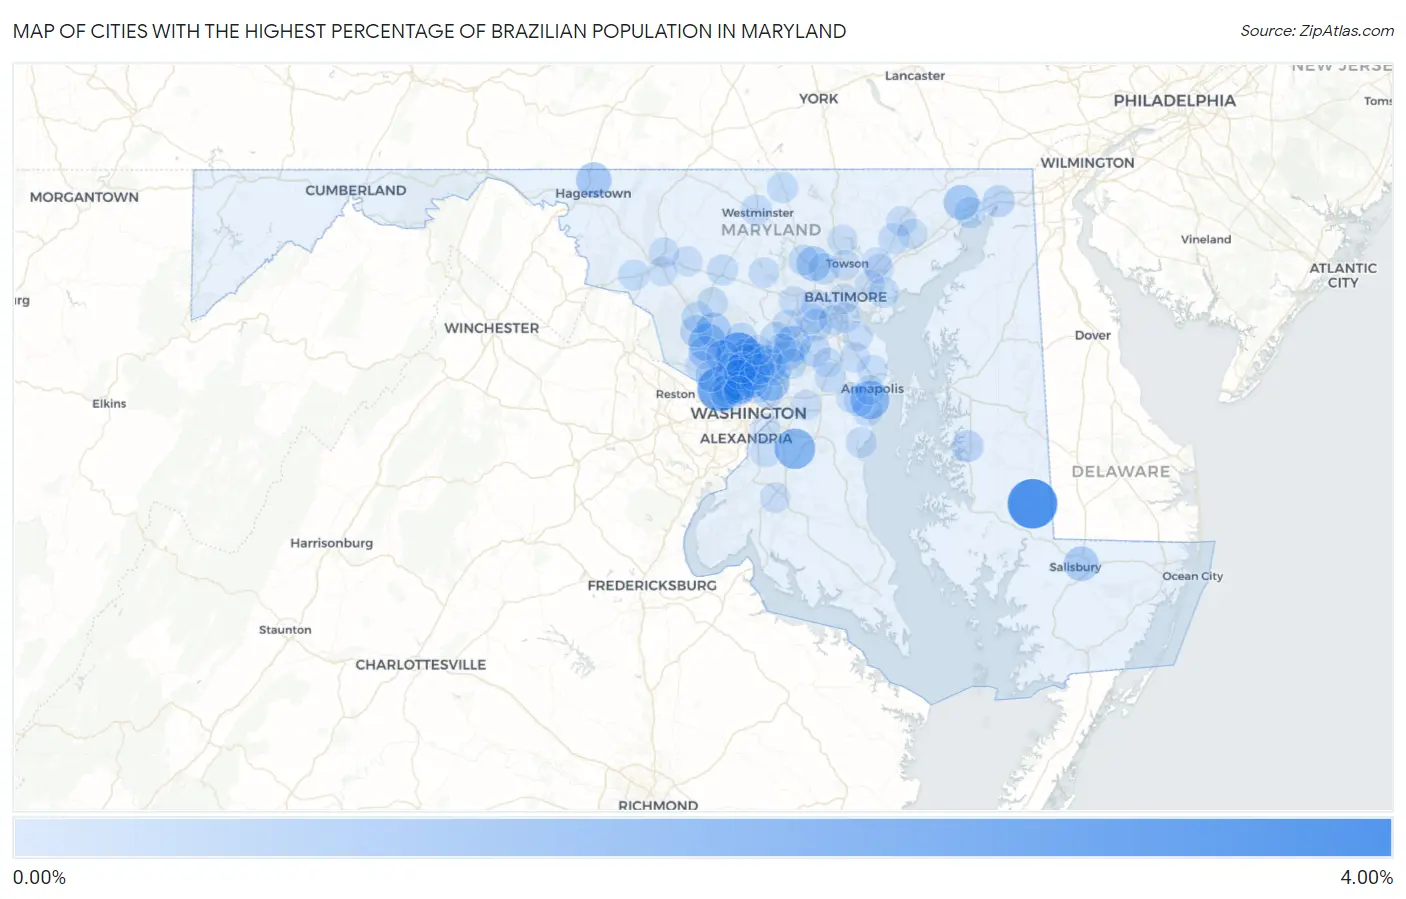
Map of Cities with the Highest Percentage of Brazilian Population in Maryland
0.00%
4.00%
Cities with the Highest Percentage of Brazilian Population in Maryland
| City | Brazilian | vs State | vs National | |
| 1. | Eldorado | 4.00% | 0.19%(+3.81)#1 | 0.15%(+3.85)#59 |
| 2. | Cabin John | 3.05% | 0.19%(+2.86)#2 | 0.15%(+2.90)#85 |
| 3. | Aspen Hill | 3.01% | 0.19%(+2.82)#3 | 0.15%(+2.85)#86 |
| 4. | Rosaryville | 2.11% | 0.19%(+1.92)#4 | 0.15%(+1.96)#154 |
| 5. | Annapolis Neck | 1.69% | 0.19%(+1.50)#5 | 0.15%(+1.54)#193 |
| 6. | Gaithersburg | 1.52% | 0.19%(+1.33)#6 | 0.15%(+1.36)#225 |
| 7. | North Chevy Chase | 1.32% | 0.19%(+1.13)#7 | 0.15%(+1.17)#273 |
| 8. | College Park | 1.28% | 0.19%(+1.09)#8 | 0.15%(+1.12)#288 |
| 9. | Wildewood | 1.24% | 0.19%(+1.05)#9 | 0.15%(+1.08)#301 |
| 10. | Layhill | 1.18% | 0.19%(+0.995)#10 | 0.15%(+1.03)#319 |
| 11. | North Laurel | 1.16% | 0.19%(+0.975)#11 | 0.15%(+1.01)#328 |
| 12. | Chevy Chase Section Five | 1.13% | 0.19%(+0.943)#12 | 0.15%(+0.977)#344 |
| 13. | Colesville | 1.11% | 0.19%(+0.921)#13 | 0.15%(+0.955)#352 |
| 14. | Fountainhead Orchard Hills | 1.06% | 0.19%(+0.877)#14 | 0.15%(+0.911)#371 |
| 15. | Port Deposit | 1.02% | 0.19%(+0.834)#15 | 0.15%(+0.868)#397 |
| 16. | Garrison | 0.93% | 0.19%(+0.744)#16 | 0.15%(+0.778)#431 |
| 17. | Salisbury | 0.93% | 0.19%(+0.737)#17 | 0.15%(+0.772)#436 |
| 18. | Montgomery Village | 0.91% | 0.19%(+0.721)#18 | 0.15%(+0.756)#444 |
| 19. | Forest Glen | 0.90% | 0.19%(+0.716)#19 | 0.15%(+0.750)#449 |
| 20. | North Bethesda | 0.83% | 0.19%(+0.638)#20 | 0.15%(+0.672)#486 |
| 21. | Glenmont | 0.82% | 0.19%(+0.636)#21 | 0.15%(+0.670)#487 |
| 22. | Calverton | 0.73% | 0.19%(+0.543)#22 | 0.15%(+0.577)#548 |
| 23. | Chevy Chase | 0.72% | 0.19%(+0.527)#23 | 0.15%(+0.561)#560 |
| 24. | North Kensington | 0.67% | 0.19%(+0.485)#24 | 0.15%(+0.519)#598 |
| 25. | Bethesda | 0.63% | 0.19%(+0.445)#25 | 0.15%(+0.479)#638 |
| 26. | North Potomac | 0.62% | 0.19%(+0.432)#26 | 0.15%(+0.466)#655 |
| 27. | Rockville | 0.57% | 0.19%(+0.381)#27 | 0.15%(+0.415)#717 |
| 28. | South Kensington | 0.56% | 0.19%(+0.373)#28 | 0.15%(+0.408)#726 |
| 29. | Burnt Mills | 0.54% | 0.19%(+0.354)#29 | 0.15%(+0.389)#742 |
| 30. | Laurel | 0.46% | 0.19%(+0.272)#30 | 0.15%(+0.306)#866 |
| 31. | North East | 0.44% | 0.19%(+0.255)#31 | 0.15%(+0.289)#887 |
| 32. | Germantown | 0.43% | 0.19%(+0.245)#32 | 0.15%(+0.280)#904 |
| 33. | Easton | 0.43% | 0.19%(+0.244)#33 | 0.15%(+0.278)#907 |
| 34. | Olney | 0.41% | 0.19%(+0.220)#34 | 0.15%(+0.254)#951 |
| 35. | Elkridge | 0.40% | 0.19%(+0.208)#35 | 0.15%(+0.242)#985 |
| 36. | Takoma Park | 0.39% | 0.19%(+0.205)#36 | 0.15%(+0.239)#995 |
| 37. | Chevy Chase Section Three | 0.39% | 0.19%(+0.202)#37 | 0.15%(+0.236)#1,001 |
| 38. | Fort Meade | 0.36% | 0.19%(+0.172)#38 | 0.15%(+0.206)#1,065 |
| 39. | Glen Echo | 0.35% | 0.19%(+0.167)#39 | 0.15%(+0.201)#1,074 |
| 40. | Brookmont | 0.32% | 0.19%(+0.134)#40 | 0.15%(+0.168)#1,193 |
| 41. | Perryville | 0.32% | 0.19%(+0.130)#41 | 0.15%(+0.164)#1,200 |
| 42. | Fulton | 0.31% | 0.19%(+0.125)#42 | 0.15%(+0.159)#1,219 |
| 43. | Pikesville | 0.31% | 0.19%(+0.123)#43 | 0.15%(+0.157)#1,226 |
| 44. | Potomac | 0.31% | 0.19%(+0.117)#44 | 0.15%(+0.152)#1,242 |
| 45. | Clarksburg | 0.30% | 0.19%(+0.108)#45 | 0.15%(+0.143)#1,269 |
| 46. | Beltsville | 0.29% | 0.19%(+0.101)#46 | 0.15%(+0.135)#1,297 |
| 47. | Hyattsville | 0.28% | 0.19%(+0.090)#47 | 0.15%(+0.124)#1,334 |
| 48. | Kensington | 0.27% | 0.19%(+0.080)#48 | 0.15%(+0.114)#1,360 |
| 49. | Silver Spring | 0.27% | 0.19%(+0.077)#49 | 0.15%(+0.111)#1,370 |
| 50. | Pleasant Hills | 0.25% | 0.19%(+0.067)#50 | 0.15%(+0.101)#1,410 |
| 51. | Mount Airy | 0.25% | 0.19%(+0.060)#51 | 0.15%(+0.094)#1,427 |
| 52. | Four Corners | 0.23% | 0.19%(+0.044)#52 | 0.15%(+0.078)#1,486 |
| 53. | Ilchester | 0.23% | 0.19%(+0.039)#53 | 0.15%(+0.073)#1,509 |
| 54. | Manchester | 0.22% | 0.19%(+0.034)#54 | 0.15%(+0.068)#1,533 |
| 55. | Westminster | 0.22% | 0.19%(+0.031)#55 | 0.15%(+0.065)#1,549 |
| 56. | Jefferson | 0.22% | 0.19%(+0.031)#56 | 0.15%(+0.065)#1,550 |
| 57. | Essex | 0.22% | 0.19%(+0.030)#57 | 0.15%(+0.064)#1,553 |
| 58. | Owings Mills | 0.21% | 0.19%(+0.026)#58 | 0.15%(+0.060)#1,568 |
| 59. | Flower Hill | 0.21% | 0.19%(+0.024)#59 | 0.15%(+0.058)#1,573 |
| 60. | Wheaton | 0.21% | 0.19%(+0.019)#60 | 0.15%(+0.053)#1,591 |
| 61. | Deale | 0.19% | 0.19%(+0.003)#61 | 0.15%(+0.037)#1,661 |
| 62. | Columbia | 0.18% | 0.19%(-0.007)#62 | 0.15%(+0.027)#1,709 |
| 63. | Brooklyn Park | 0.17% | 0.19%(-0.018)#63 | 0.15%(+0.016)#1,757 |
| 64. | Green Valley | 0.17% | 0.19%(-0.019)#64 | 0.15%(+0.016)#1,761 |
| 65. | Sykesville | 0.16% | 0.19%(-0.025)#65 | 0.15%(+0.009)#1,804 |
| 66. | West Laurel | 0.16% | 0.19%(-0.026)#66 | 0.15%(+0.008)#1,807 |
| 67. | Chevy Chase Village | 0.16% | 0.19%(-0.029)#67 | 0.15%(+0.005)#1,817 |
| 68. | Mayo | 0.16% | 0.19%(-0.031)#68 | 0.15%(+0.004)#1,828 |
| 69. | South Laurel | 0.15% | 0.19%(-0.033)#69 | 0.15%(+0.001)#1,845 |
| 70. | Damascus | 0.15% | 0.19%(-0.034)#70 | 0.15%(+0.000)#1,852 |
| 71. | Riva | 0.15% | 0.19%(-0.042)#71 | 0.15%(-0.008)#1,895 |
| 72. | Frederick | 0.14% | 0.19%(-0.045)#72 | 0.15%(-0.011)#1,919 |
| 73. | Crofton | 0.13% | 0.19%(-0.059)#73 | 0.15%(-0.024)#2,004 |
| 74. | Arnold | 0.13% | 0.19%(-0.059)#74 | 0.15%(-0.025)#2,008 |
| 75. | Baltimore | 0.13% | 0.19%(-0.060)#75 | 0.15%(-0.026)#2,015 |
| 76. | Catonsville | 0.13% | 0.19%(-0.062)#76 | 0.15%(-0.028)#2,027 |
| 77. | Fairland | 0.12% | 0.19%(-0.069)#77 | 0.15%(-0.035)#2,076 |
| 78. | Linganore | 0.12% | 0.19%(-0.070)#78 | 0.15%(-0.036)#2,086 |
| 79. | Woodmore | 0.11% | 0.19%(-0.074)#79 | 0.15%(-0.040)#2,109 |
| 80. | Waldorf | 0.11% | 0.19%(-0.076)#80 | 0.15%(-0.042)#2,123 |
| 81. | Linthicum | 0.11% | 0.19%(-0.076)#81 | 0.15%(-0.042)#2,126 |
| 82. | Hillcrest Heights | 0.11% | 0.19%(-0.079)#82 | 0.15%(-0.045)#2,145 |
| 83. | Cockeysville | 0.10% | 0.19%(-0.085)#83 | 0.15%(-0.051)#2,193 |
| 84. | Towson | 0.10% | 0.19%(-0.087)#84 | 0.15%(-0.053)#2,208 |
| 85. | Edgewater | 0.090% | 0.19%(-0.098)#85 | 0.15%(-0.064)#2,281 |
| 86. | Ellicott City | 0.087% | 0.19%(-0.101)#86 | 0.15%(-0.067)#2,305 |
| 87. | White Oak | 0.084% | 0.19%(-0.104)#87 | 0.15%(-0.070)#2,331 |
| 88. | Perry Hall | 0.072% | 0.19%(-0.116)#88 | 0.15%(-0.082)#2,448 |
| 89. | Bel Air North | 0.070% | 0.19%(-0.118)#89 | 0.15%(-0.084)#2,463 |
| 90. | Cloverly | 0.067% | 0.19%(-0.121)#90 | 0.15%(-0.087)#2,496 |
| 91. | Severna Park | 0.067% | 0.19%(-0.121)#91 | 0.15%(-0.087)#2,500 |
| 92. | Bel Air South | 0.067% | 0.19%(-0.121)#92 | 0.15%(-0.087)#2,504 |
| 93. | Friendly | 0.066% | 0.19%(-0.122)#93 | 0.15%(-0.088)#2,510 |
| 94. | Travilah | 0.065% | 0.19%(-0.123)#94 | 0.15%(-0.089)#2,521 |
| 95. | White Marsh | 0.058% | 0.19%(-0.130)#95 | 0.15%(-0.096)#2,580 |
| 96. | Ballenger Creek | 0.049% | 0.19%(-0.139)#96 | 0.15%(-0.105)#2,653 |
| 97. | Pasadena | 0.047% | 0.19%(-0.141)#97 | 0.15%(-0.107)#2,681 |
| 98. | Odenton | 0.047% | 0.19%(-0.141)#98 | 0.15%(-0.107)#2,682 |
| 99. | Rosedale | 0.035% | 0.19%(-0.153)#99 | 0.15%(-0.119)#2,802 |
| 100. | Annapolis | 0.029% | 0.19%(-0.159)#100 | 0.15%(-0.124)#2,864 |
Common Questions
What are the Top 10 Cities with the Highest Percentage of Brazilian Population in Maryland?
Top 10 Cities with the Highest Percentage of Brazilian Population in Maryland are:
#1
4.00%
#2
3.05%
#3
3.01%
#4
2.11%
#5
1.69%
#6
1.52%
#7
1.32%
#8
1.28%
#9
1.18%
#10
1.16%
What city has the Highest Percentage of Brazilian Population in Maryland?
Eldorado has the Highest Percentage of Brazilian Population in Maryland with 4.00%.
What is the Percentage of Brazilian Population in the State of Maryland?
Percentage of Brazilian Population in Maryland is 0.19%.
What is the Percentage of Brazilian Population in the United States?
Percentage of Brazilian Population in the United States is 0.15%.