Cities with the Lowest Poverty Level Among Single Mothers in South Dakota
RELATED REPORTS & OPTIONS
Lowest Poverty | Single Mother
South Dakota
Compare Cities
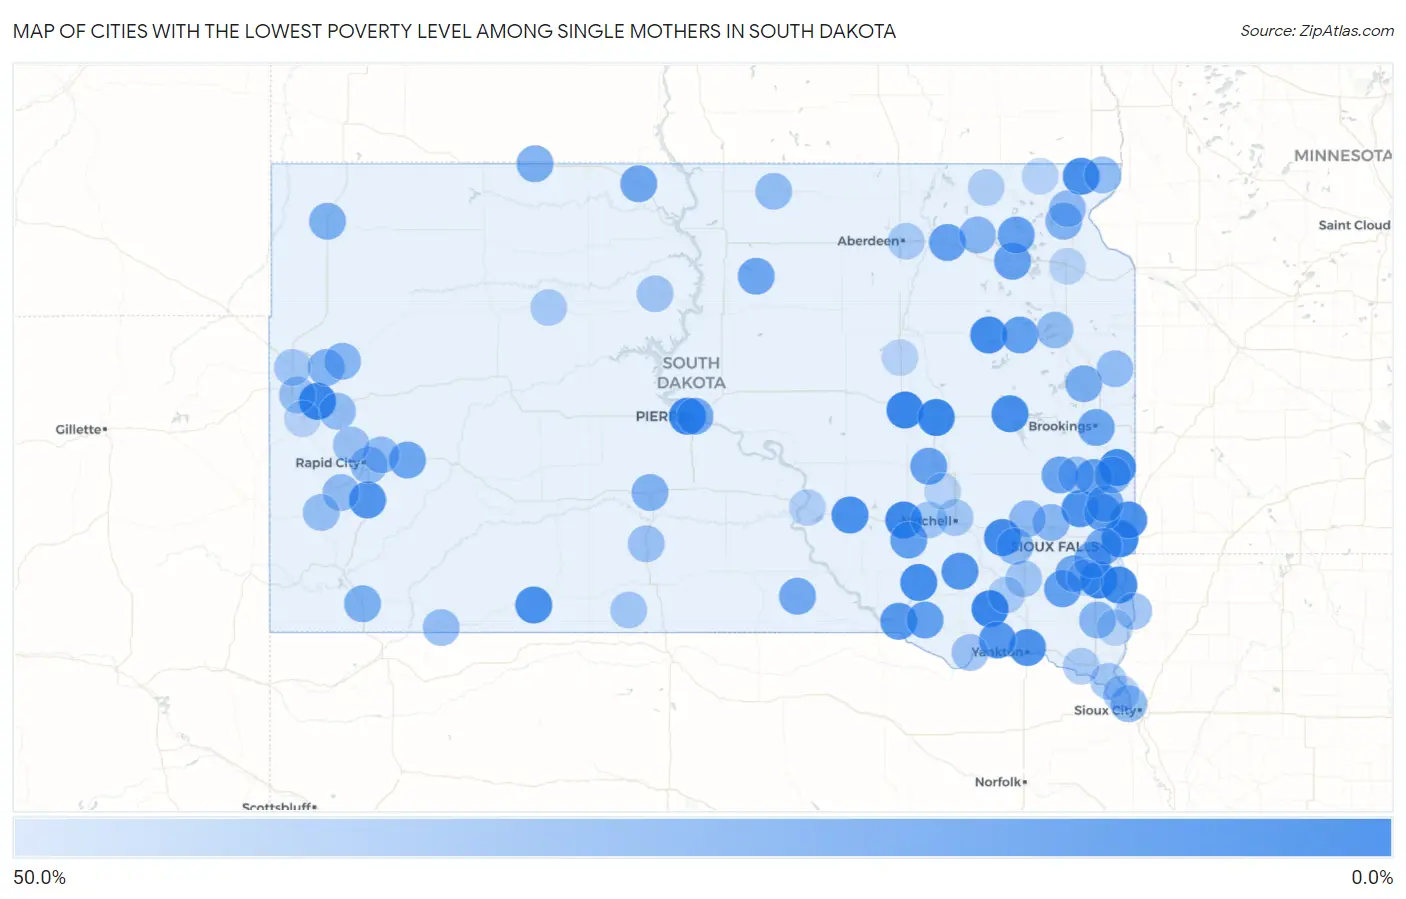
Map of Cities with the Lowest Poverty Level Among Single Mothers in South Dakota
50.0%
0.0%
Cities with the Lowest Poverty Level Among Single Mothers in South Dakota
| City | Single Mother Poverty | vs State | vs National | |
| 1. | Scotland | 5.6% | 35.0%(-29.5)#1 | 33.1%(-27.6)#374 |
| 2. | Wolsey | 5.9% | 35.0%(-29.1)#2 | 33.1%(-27.3)#422 |
| 3. | Fort Pierre | 6.1% | 35.0%(-29.0)#3 | 33.1%(-27.1)#438 |
| 4. | Huron | 6.2% | 35.0%(-28.8)#4 | 33.1%(-26.9)#465 |
| 5. | Worthing | 6.2% | 35.0%(-28.8)#5 | 33.1%(-26.9)#471 |
| 6. | Whitewood | 6.2% | 35.0%(-28.8)#6 | 33.1%(-26.9)#474 |
| 7. | Plankinton | 6.7% | 35.0%(-28.4)#7 | 33.1%(-26.5)#544 |
| 8. | Brandon | 8.0% | 35.0%(-27.0)#8 | 33.1%(-25.1)#776 |
| 9. | Ideal | 8.3% | 35.0%(-26.7)#9 | 33.1%(-24.8)#862 |
| 10. | Clark | 9.1% | 35.0%(-25.9)#10 | 33.1%(-24.0)#1,002 |
| 11. | Emery | 9.1% | 35.0%(-25.9)#11 | 33.1%(-24.0)#1,009 |
| 12. | Canton | 9.2% | 35.0%(-25.8)#12 | 33.1%(-23.9)#1,028 |
| 13. | Flandreau | 9.6% | 35.0%(-25.4)#13 | 33.1%(-23.5)#1,095 |
| 14. | Armour | 10.0% | 35.0%(-25.0)#14 | 33.1%(-23.1)#1,181 |
| 15. | De Smet | 10.5% | 35.0%(-24.5)#15 | 33.1%(-22.6)#1,279 |
| 16. | New Effington | 11.1% | 35.0%(-23.9)#16 | 33.1%(-22.0)#1,449 |
| 17. | Garretson | 11.5% | 35.0%(-23.5)#17 | 33.1%(-21.6)#1,517 |
| 18. | Kimball | 11.8% | 35.0%(-23.3)#18 | 33.1%(-21.4)#1,566 |
| 19. | Martin | 12.5% | 35.0%(-22.5)#19 | 33.1%(-20.6)#1,731 |
| 20. | Yankton | 12.7% | 35.0%(-22.4)#20 | 33.1%(-20.5)#1,786 |
| 21. | Colton | 13.0% | 35.0%(-22.1)#21 | 33.1%(-20.2)#1,850 |
| 22. | Parkston | 14.3% | 35.0%(-20.7)#22 | 33.1%(-18.8)#2,145 |
| 23. | Hermosa | 14.3% | 35.0%(-20.7)#23 | 33.1%(-18.8)#2,183 |
| 24. | Tabor | 15.8% | 35.0%(-19.2)#24 | 33.1%(-17.3)#2,538 |
| 25. | Pickstown | 16.7% | 35.0%(-18.4)#25 | 33.1%(-16.5)#2,800 |
| 26. | Baltic | 18.2% | 35.0%(-16.8)#26 | 33.1%(-15.0)#3,129 |
| 27. | Colman | 18.6% | 35.0%(-16.4)#27 | 33.1%(-14.5)#3,254 |
| 28. | Wagner | 20.0% | 35.0%(-15.0)#28 | 33.1%(-13.1)#3,607 |
| 29. | Hurley | 20.0% | 35.0%(-15.0)#29 | 33.1%(-13.1)#3,659 |
| 30. | Stickney | 20.0% | 35.0%(-15.0)#30 | 33.1%(-13.1)#3,676 |
| 31. | Henry | 20.0% | 35.0%(-15.0)#31 | 33.1%(-13.1)#3,677 |
| 32. | Groton | 20.8% | 35.0%(-14.2)#32 | 33.1%(-12.3)#3,886 |
| 33. | Webster | 22.2% | 35.0%(-12.8)#33 | 33.1%(-10.9)#4,262 |
| 34. | Woonsocket | 22.2% | 35.0%(-12.8)#34 | 33.1%(-10.9)#4,274 |
| 35. | Roslyn | 22.2% | 35.0%(-12.8)#35 | 33.1%(-10.9)#4,312 |
| 36. | Madison | 23.7% | 35.0%(-11.3)#36 | 33.1%(-9.45)#4,655 |
| 37. | Brookings | 23.8% | 35.0%(-11.2)#37 | 33.1%(-9.35)#4,689 |
| 38. | New Underwood | 23.8% | 35.0%(-11.2)#38 | 33.1%(-9.33)#4,707 |
| 39. | Mclaughlin | 25.0% | 35.0%(-10.0)#39 | 33.1%(-8.14)#5,036 |
| 40. | Chancellor | 25.0% | 35.0%(-10.0)#40 | 33.1%(-8.14)#5,068 |
| 41. | Hoven | 25.0% | 35.0%(-10.0)#41 | 33.1%(-8.14)#5,072 |
| 42. | Tea | 25.2% | 35.0%(-9.81)#42 | 33.1%(-7.93)#5,147 |
| 43. | Gregory | 25.9% | 35.0%(-9.10)#43 | 33.1%(-7.21)#5,312 |
| 44. | Pierre | 26.3% | 35.0%(-8.72)#44 | 33.1%(-6.83)#5,398 |
| 45. | Sioux Falls | 27.6% | 35.0%(-7.41)#45 | 33.1%(-5.53)#5,765 |
| 46. | Dell Rapids | 27.9% | 35.0%(-7.11)#46 | 33.1%(-5.23)#5,856 |
| 47. | Estelline | 28.6% | 35.0%(-6.45)#47 | 33.1%(-4.56)#6,048 |
| 48. | Morristown | 28.6% | 35.0%(-6.45)#48 | 33.1%(-4.56)#6,128 |
| 49. | Buffalo | 30.0% | 35.0%(-5.02)#49 | 33.1%(-3.14)#6,497 |
| 50. | Oelrichs | 30.0% | 35.0%(-5.02)#50 | 33.1%(-3.14)#6,506 |
| 51. | Murdo | 31.2% | 35.0%(-3.77)#51 | 33.1%(-1.89)#6,813 |
| 52. | Agency Village | 31.7% | 35.0%(-3.31)#52 | 33.1%(-1.43)#6,920 |
| 53. | Nisland | 32.3% | 35.0%(-2.76)#53 | 33.1%(-0.877)#7,076 |
| 54. | Beresford | 33.3% | 35.0%(-1.69)#54 | 33.1%(+0.198)#7,299 |
| 55. | Montrose | 33.3% | 35.0%(-1.69)#55 | 33.1%(+0.198)#7,414 |
| 56. | Newell | 33.3% | 35.0%(-1.69)#56 | 33.1%(+0.198)#7,430 |
| 57. | Egan | 33.3% | 35.0%(-1.69)#57 | 33.1%(+0.198)#7,507 |
| 58. | Pierpont | 33.3% | 35.0%(-1.69)#58 | 33.1%(+0.198)#7,552 |
| 59. | North Sioux City | 34.3% | 35.0%(-0.762)#59 | 33.1%(+1.12)#7,744 |
| 60. | Peever Flats | 35.3% | 35.0%(+0.273)#60 | 33.1%(+2.16)#8,002 |
| 61. | Rapid City | 35.7% | 35.0%(+0.670)#61 | 33.1%(+2.56)#8,084 |
| 62. | Salem | 35.7% | 35.0%(+0.693)#62 | 33.1%(+2.58)#8,097 |
| 63. | Bridgewater | 35.7% | 35.0%(+0.693)#63 | 33.1%(+2.58)#8,110 |
| 64. | Keystone | 36.4% | 35.0%(+1.34)#64 | 33.1%(+3.23)#8,302 |
| 65. | Box Elder | 36.6% | 35.0%(+1.61)#65 | 33.1%(+3.50)#8,370 |
| 66. | Sisseton | 36.8% | 35.0%(+1.73)#66 | 33.1%(+3.62)#8,405 |
| 67. | Watertown | 37.1% | 35.0%(+2.07)#67 | 33.1%(+3.96)#8,496 |
| 68. | Sturgis | 37.1% | 35.0%(+2.08)#68 | 33.1%(+3.96)#8,497 |
| 69. | Eureka | 37.5% | 35.0%(+2.48)#69 | 33.1%(+4.36)#8,596 |
| 70. | Rosholt | 37.5% | 35.0%(+2.48)#70 | 33.1%(+4.36)#8,634 |
| 71. | Brandt | 37.5% | 35.0%(+2.48)#71 | 33.1%(+4.36)#8,652 |
| 72. | Pine Ridge | 37.8% | 35.0%(+2.76)#72 | 33.1%(+4.64)#8,702 |
| 73. | Custer | 38.6% | 35.0%(+3.55)#73 | 33.1%(+5.44)#8,920 |
| 74. | Spearfish | 38.8% | 35.0%(+3.80)#74 | 33.1%(+5.69)#8,961 |
| 75. | Summerset | 39.3% | 35.0%(+4.26)#75 | 33.1%(+6.15)#9,083 |
| 76. | Springfield | 40.0% | 35.0%(+4.98)#76 | 33.1%(+6.86)#9,246 |
| 77. | White River | 40.0% | 35.0%(+4.98)#77 | 33.1%(+6.86)#9,297 |
| 78. | Hudson | 40.0% | 35.0%(+4.98)#78 | 33.1%(+6.86)#9,320 |
| 79. | Wentworth | 40.0% | 35.0%(+4.98)#79 | 33.1%(+6.86)#9,367 |
| 80. | Freeman | 41.7% | 35.0%(+6.65)#80 | 33.1%(+8.53)#9,708 |
| 81. | La Plant | 41.7% | 35.0%(+6.65)#81 | 33.1%(+8.53)#9,741 |
| 82. | Belle Fourche | 42.4% | 35.0%(+7.33)#82 | 33.1%(+9.22)#9,879 |
| 83. | Elk Point | 42.4% | 35.0%(+7.40)#83 | 33.1%(+9.29)#9,896 |
| 84. | St Francis | 42.5% | 35.0%(+7.48)#84 | 33.1%(+9.36)#9,914 |
| 85. | Mount Vernon | 42.9% | 35.0%(+7.84)#85 | 33.1%(+9.72)#10,019 |
| 86. | Mitchell | 43.4% | 35.0%(+8.37)#86 | 33.1%(+10.3)#10,133 |
| 87. | Aberdeen | 44.8% | 35.0%(+9.81)#87 | 33.1%(+11.7)#10,461 |
| 88. | Dupree | 44.8% | 35.0%(+9.81)#88 | 33.1%(+11.7)#10,484 |
| 89. | Menno | 45.5% | 35.0%(+10.4)#89 | 33.1%(+12.3)#10,634 |
| 90. | Jefferson | 45.8% | 35.0%(+10.8)#90 | 33.1%(+12.7)#10,723 |
| 91. | Vermillion | 45.9% | 35.0%(+10.9)#91 | 33.1%(+12.7)#10,732 |
| 92. | Britton | 47.4% | 35.0%(+12.3)#92 | 33.1%(+14.2)#11,077 |
| 93. | Chamberlain | 48.8% | 35.0%(+13.8)#93 | 33.1%(+15.7)#11,367 |
| 94. | Lennox | 49.0% | 35.0%(+14.0)#94 | 33.1%(+15.9)#11,397 |
| 95. | Lead | 50.0% | 35.0%(+15.0)#95 | 33.1%(+16.9)#11,530 |
| 96. | Alcester | 50.0% | 35.0%(+15.0)#96 | 33.1%(+16.9)#11,603 |
| 97. | Veblen | 50.0% | 35.0%(+15.0)#97 | 33.1%(+16.9)#11,712 |
| 98. | Summit | 50.0% | 35.0%(+15.0)#98 | 33.1%(+16.9)#11,765 |
| 99. | Tulare | 50.0% | 35.0%(+15.0)#99 | 33.1%(+16.9)#11,862 |
| 100. | Letcher | 50.0% | 35.0%(+15.0)#100 | 33.1%(+16.9)#11,883 |
Common Questions
What are the Top 10 Cities with the Lowest Poverty Level Among Single Mothers in South Dakota?
Top 10 Cities with the Lowest Poverty Level Among Single Mothers in South Dakota are:
#1
5.6%
#2
5.9%
#3
6.1%
#4
6.2%
#5
6.2%
#6
6.2%
#7
6.7%
#8
8.0%
#9
9.1%
#10
9.1%
What city has the Lowest Poverty Level Among Single Mothers in South Dakota?
Scotland has the Lowest Poverty Level Among Single Mothers in South Dakota with 5.6%.
What is the Poverty Level Among Single Mothers in the State of South Dakota?
Poverty Level Among Single Mothers in South Dakota is 35.0%.
What is the Poverty Level Among Single Mothers in the United States?
Poverty Level Among Single Mothers in the United States is 33.1%.