Cities with the Lowest Poverty Level Among Single Mothers in Iowa
RELATED REPORTS & OPTIONS
Lowest Poverty | Single Mother
Iowa
Compare Cities
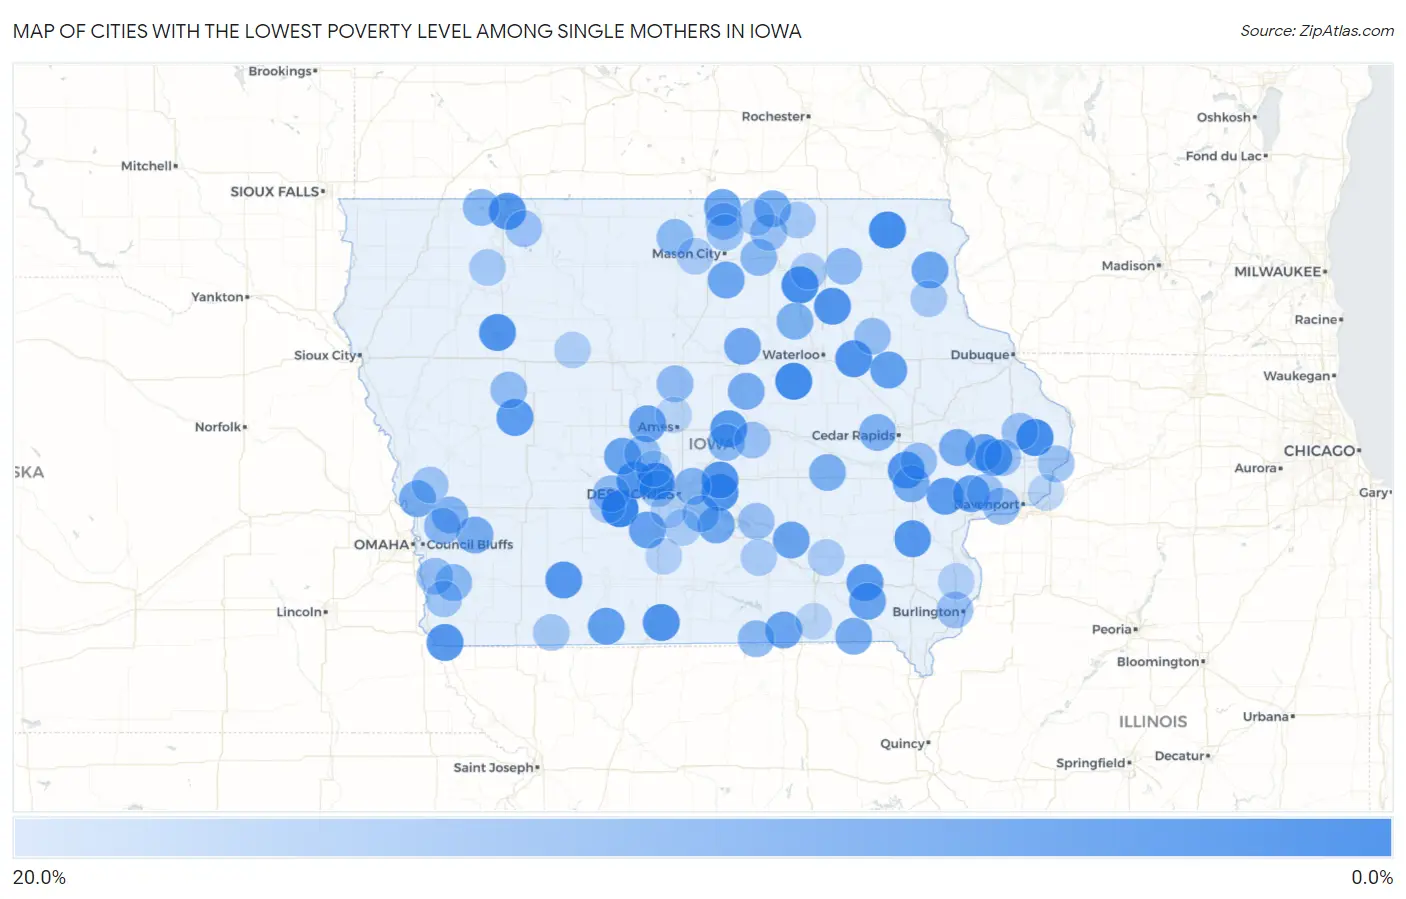
Map of Cities with the Lowest Poverty Level Among Single Mothers in Iowa
20.0%
0.0%
Cities with the Lowest Poverty Level Among Single Mothers in Iowa
| City | Single Mother Poverty | vs State | vs National | |
| 1. | Earlham | 1.8% | 32.4%(-30.6)#1 | 33.1%(-31.3)#26 |
| 2. | Grimes | 2.5% | 32.4%(-29.9)#2 | 33.1%(-30.6)#58 |
| 3. | Reinbeck | 3.2% | 32.4%(-29.2)#3 | 33.1%(-29.9)#106 |
| 4. | Decorah | 3.4% | 32.4%(-29.0)#4 | 33.1%(-29.7)#123 |
| 5. | Charlotte | 3.4% | 32.4%(-29.0)#5 | 33.1%(-29.7)#129 |
| 6. | Nashua | 3.8% | 32.4%(-28.6)#6 | 33.1%(-29.4)#158 |
| 7. | Jesup | 4.9% | 32.4%(-27.5)#7 | 33.1%(-28.3)#273 |
| 8. | Prairie City | 4.9% | 32.4%(-27.5)#8 | 33.1%(-28.3)#274 |
| 9. | Leon | 4.9% | 32.4%(-27.5)#9 | 33.1%(-28.3)#275 |
| 10. | Dallas Center | 5.0% | 32.4%(-27.4)#10 | 33.1%(-28.1)#288 |
| 11. | Tripoli | 5.0% | 32.4%(-27.4)#11 | 33.1%(-28.1)#291 |
| 12. | Storm Lake | 5.0% | 32.4%(-27.4)#12 | 33.1%(-28.1)#300 |
| 13. | Colfax | 5.5% | 32.4%(-26.9)#13 | 33.1%(-27.7)#361 |
| 14. | North Liberty | 5.5% | 32.4%(-26.9)#14 | 33.1%(-27.6)#364 |
| 15. | Hamburg | 5.6% | 32.4%(-26.9)#15 | 33.1%(-27.6)#371 |
| 16. | Ainsworth | 5.6% | 32.4%(-26.9)#16 | 33.1%(-27.6)#373 |
| 17. | Prescott | 5.6% | 32.4%(-26.9)#17 | 33.1%(-27.6)#376 |
| 18. | Spirit Lake | 5.7% | 32.4%(-26.7)#18 | 33.1%(-27.4)#396 |
| 19. | State Center | 6.1% | 32.4%(-26.3)#19 | 33.1%(-27.0)#454 |
| 20. | Wheatland | 6.1% | 32.4%(-26.3)#20 | 33.1%(-27.0)#456 |
| 21. | Fairfield | 6.3% | 32.4%(-26.1)#21 | 33.1%(-26.8)#487 |
| 22. | West Liberty | 6.4% | 32.4%(-26.0)#22 | 33.1%(-26.7)#496 |
| 23. | Arcadia | 6.4% | 32.4%(-26.0)#23 | 33.1%(-26.7)#498 |
| 24. | Quasqueton | 7.1% | 32.4%(-25.3)#24 | 33.1%(-26.0)#620 |
| 25. | Mount Ayr | 7.3% | 32.4%(-25.1)#25 | 33.1%(-25.9)#647 |
| 26. | Wilton | 7.5% | 32.4%(-24.9)#26 | 33.1%(-25.6)#693 |
| 27. | Patterson | 7.7% | 32.4%(-24.7)#27 | 33.1%(-25.4)#737 |
| 28. | University Park | 8.0% | 32.4%(-24.4)#28 | 33.1%(-25.1)#785 |
| 29. | Birmingham | 8.0% | 32.4%(-24.4)#29 | 33.1%(-25.1)#786 |
| 30. | Boone | 8.2% | 32.4%(-24.2)#30 | 33.1%(-25.0)#813 |
| 31. | Perry | 8.2% | 32.4%(-24.2)#31 | 33.1%(-24.9)#822 |
| 32. | Lowden | 8.3% | 32.4%(-24.1)#32 | 33.1%(-24.8)#847 |
| 33. | Moulton | 8.3% | 32.4%(-24.1)#33 | 33.1%(-24.8)#850 |
| 34. | Monona | 8.7% | 32.4%(-23.7)#34 | 33.1%(-24.4)#913 |
| 35. | Rockwell | 8.7% | 32.4%(-23.7)#35 | 33.1%(-24.4)#916 |
| 36. | Northwood | 8.8% | 32.4%(-23.6)#36 | 33.1%(-24.3)#947 |
| 37. | Ackley | 9.1% | 32.4%(-23.3)#37 | 33.1%(-24.0)#1,000 |
| 38. | Pleasantville | 9.5% | 32.4%(-22.9)#38 | 33.1%(-23.6)#1,075 |
| 39. | Missouri Valley | 9.9% | 32.4%(-22.5)#39 | 33.1%(-23.2)#1,141 |
| 40. | Oakland | 10.0% | 32.4%(-22.4)#40 | 33.1%(-23.1)#1,169 |
| 41. | University Heights | 10.0% | 32.4%(-22.4)#41 | 33.1%(-23.1)#1,172 |
| 42. | Stanwood | 10.0% | 32.4%(-22.4)#42 | 33.1%(-23.1)#1,184 |
| 43. | Cantril | 10.0% | 32.4%(-22.4)#43 | 33.1%(-23.1)#1,196 |
| 44. | Whitten | 10.0% | 32.4%(-22.4)#44 | 33.1%(-23.1)#1,200 |
| 45. | Stacyville | 10.3% | 32.4%(-22.1)#45 | 33.1%(-22.8)#1,253 |
| 46. | Victor | 10.5% | 32.4%(-21.9)#46 | 33.1%(-22.6)#1,280 |
| 47. | Shell Rock | 10.8% | 32.4%(-21.6)#47 | 33.1%(-22.3)#1,350 |
| 48. | Atkins | 11.1% | 32.4%(-21.3)#48 | 33.1%(-22.0)#1,403 |
| 49. | Neola | 11.3% | 32.4%(-21.1)#49 | 33.1%(-21.8)#1,476 |
| 50. | Altoona | 11.6% | 32.4%(-20.8)#50 | 33.1%(-21.5)#1,537 |
| 51. | Underwood | 12.1% | 32.4%(-20.3)#51 | 33.1%(-21.0)#1,651 |
| 52. | Malvern | 12.5% | 32.4%(-19.9)#52 | 33.1%(-20.6)#1,726 |
| 53. | Lake Park | 12.5% | 32.4%(-19.9)#53 | 33.1%(-20.6)#1,727 |
| 54. | Hartford | 12.5% | 32.4%(-19.9)#54 | 33.1%(-20.6)#1,738 |
| 55. | Rudd | 12.5% | 32.4%(-19.9)#55 | 33.1%(-20.6)#1,743 |
| 56. | Rhodes | 12.5% | 32.4%(-19.9)#56 | 33.1%(-20.6)#1,755 |
| 57. | Cincinnati | 12.5% | 32.4%(-19.9)#57 | 33.1%(-20.6)#1,760 |
| 58. | Forest City | 12.6% | 32.4%(-19.8)#58 | 33.1%(-20.5)#1,782 |
| 59. | Blue Grass | 12.9% | 32.4%(-19.5)#59 | 33.1%(-20.2)#1,839 |
| 60. | Redfield | 13.1% | 32.4%(-19.3)#60 | 33.1%(-20.0)#1,887 |
| 61. | Jewell Junction | 13.2% | 32.4%(-19.2)#61 | 33.1%(-19.9)#1,906 |
| 62. | Lawler | 13.3% | 32.4%(-19.1)#62 | 33.1%(-19.8)#1,955 |
| 63. | Kensett | 13.3% | 32.4%(-19.1)#63 | 33.1%(-19.8)#1,960 |
| 64. | Woodward | 13.6% | 32.4%(-18.8)#64 | 33.1%(-19.5)#2,017 |
| 65. | Wall Lake | 13.6% | 32.4%(-18.8)#65 | 33.1%(-19.5)#2,020 |
| 66. | Glenwood | 13.7% | 32.4%(-18.7)#66 | 33.1%(-19.5)#2,024 |
| 67. | Solon | 13.7% | 32.4%(-18.7)#67 | 33.1%(-19.4)#2,031 |
| 68. | Hazleton | 13.8% | 32.4%(-18.6)#68 | 33.1%(-19.3)#2,050 |
| 69. | Osage | 14.3% | 32.4%(-18.1)#69 | 33.1%(-18.8)#2,142 |
| 70. | Delmar | 14.3% | 32.4%(-18.1)#70 | 33.1%(-18.8)#2,172 |
| 71. | Calamus | 14.3% | 32.4%(-18.1)#71 | 33.1%(-18.8)#2,178 |
| 72. | Terril | 14.3% | 32.4%(-18.1)#72 | 33.1%(-18.8)#2,188 |
| 73. | Haverhill | 14.3% | 32.4%(-18.1)#73 | 33.1%(-18.8)#2,204 |
| 74. | Pella | 14.4% | 32.4%(-18.0)#74 | 33.1%(-18.7)#2,229 |
| 75. | West Burlington | 14.5% | 32.4%(-17.9)#75 | 33.1%(-18.7)#2,237 |
| 76. | Camanche | 14.6% | 32.4%(-17.8)#76 | 33.1%(-18.6)#2,254 |
| 77. | Clive | 14.8% | 32.4%(-17.7)#77 | 33.1%(-18.4)#2,290 |
| 78. | Logan | 14.8% | 32.4%(-17.6)#78 | 33.1%(-18.3)#2,307 |
| 79. | Durant | 15.0% | 32.4%(-17.4)#79 | 33.1%(-18.1)#2,345 |
| 80. | Manly | 15.0% | 32.4%(-17.4)#80 | 33.1%(-18.1)#2,349 |
| 81. | Tabor | 15.0% | 32.4%(-17.4)#81 | 33.1%(-18.1)#2,352 |
| 82. | Bedford | 15.8% | 32.4%(-16.6)#82 | 33.1%(-17.3)#2,528 |
| 83. | St Ansgar | 15.8% | 32.4%(-16.6)#83 | 33.1%(-17.3)#2,532 |
| 84. | Riceville | 15.9% | 32.4%(-16.5)#84 | 33.1%(-17.2)#2,569 |
| 85. | Elkader | 16.0% | 32.4%(-16.4)#85 | 33.1%(-17.1)#2,591 |
| 86. | Royal | 16.0% | 32.4%(-16.4)#86 | 33.1%(-17.1)#2,597 |
| 87. | Hedrick | 16.7% | 32.4%(-15.7)#87 | 33.1%(-16.5)#2,759 |
| 88. | Dexter | 16.7% | 32.4%(-15.7)#88 | 33.1%(-16.5)#2,763 |
| 89. | Ventura | 16.7% | 32.4%(-15.7)#89 | 33.1%(-16.5)#2,766 |
| 90. | Ionia | 16.7% | 32.4%(-15.7)#90 | 33.1%(-16.5)#2,795 |
| 91. | Hamilton | 16.7% | 32.4%(-15.7)#91 | 33.1%(-16.5)#2,812 |
| 92. | Indianola | 16.9% | 32.4%(-15.5)#92 | 33.1%(-16.3)#2,840 |
| 93. | Manson | 17.0% | 32.4%(-15.4)#93 | 33.1%(-16.2)#2,858 |
| 94. | Granger | 17.3% | 32.4%(-15.1)#94 | 33.1%(-15.8)#2,935 |
| 95. | Mediapolis | 17.5% | 32.4%(-14.9)#95 | 33.1%(-15.6)#2,974 |
| 96. | Norwalk | 17.6% | 32.4%(-14.8)#96 | 33.1%(-15.5)#2,982 |
| 97. | New Virginia | 17.6% | 32.4%(-14.8)#97 | 33.1%(-15.5)#2,995 |
| 98. | Le Claire | 18.0% | 32.4%(-14.4)#98 | 33.1%(-15.1)#3,086 |
| 99. | Bloomfield | 18.2% | 32.4%(-14.2)#99 | 33.1%(-15.0)#3,120 |
| 100. | Gilbert | 18.2% | 32.4%(-14.2)#100 | 33.1%(-15.0)#3,134 |
Common Questions
What are the Top 10 Cities with the Lowest Poverty Level Among Single Mothers in Iowa?
Top 10 Cities with the Lowest Poverty Level Among Single Mothers in Iowa are:
#1
1.8%
#2
2.5%
#3
3.2%
#4
3.4%
#5
3.4%
#6
3.8%
#7
4.9%
#8
4.9%
#9
4.9%
#10
5.0%
What city has the Lowest Poverty Level Among Single Mothers in Iowa?
Earlham has the Lowest Poverty Level Among Single Mothers in Iowa with 1.8%.
What is the Poverty Level Among Single Mothers in the State of Iowa?
Poverty Level Among Single Mothers in Iowa is 32.4%.
What is the Poverty Level Among Single Mothers in the United States?
Poverty Level Among Single Mothers in the United States is 33.1%.