Cities with the Lowest Poverty Level Among Single Mothers in Pennsylvania
RELATED REPORTS & OPTIONS
Lowest Poverty | Single Mother
Pennsylvania
Compare Cities
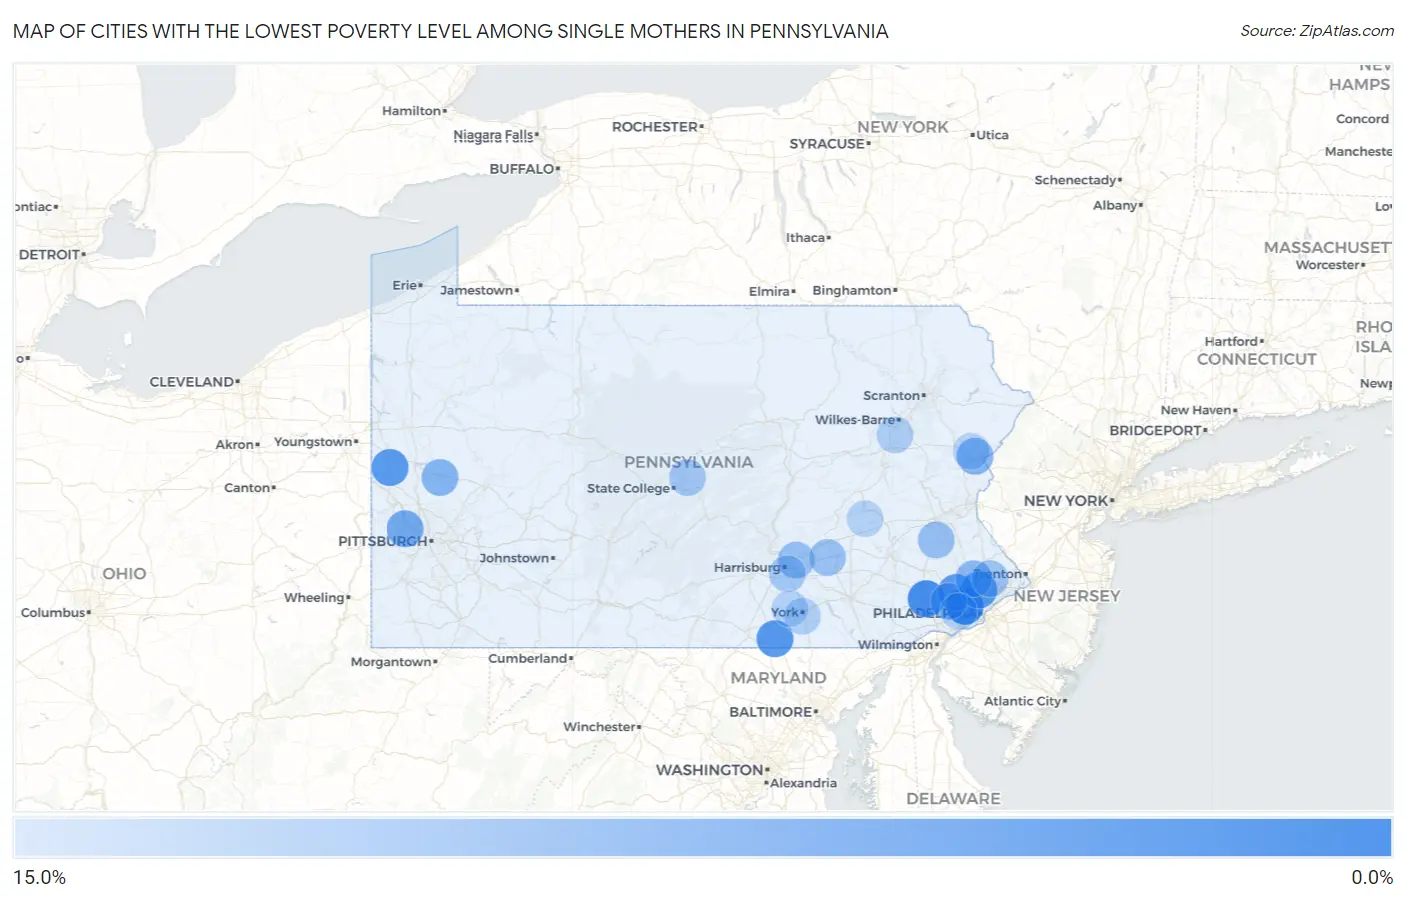
Map of Cities with the Lowest Poverty Level Among Single Mothers in Pennsylvania
15.0%
0.0%
Cities with the Lowest Poverty Level Among Single Mothers in Pennsylvania
| City | Single Mother Poverty | vs State | vs National | |
| 1. | Ardmore | 1.7% | 34.2%(-32.5)#1 | 33.1%(-31.4)#24 |
| 2. | Roslyn | 2.1% | 34.2%(-32.0)#2 | 33.1%(-31.0)#36 |
| 3. | Lansdowne Borough | 2.4% | 34.2%(-31.8)#3 | 33.1%(-30.8)#52 |
| 4. | West Mayfield Borough | 2.6% | 34.2%(-31.5)#4 | 33.1%(-30.5)#69 |
| 5. | Cleona Borough | 2.9% | 34.2%(-31.2)#5 | 33.1%(-30.2)#86 |
| 6. | Lionville | 3.0% | 34.2%(-31.2)#6 | 33.1%(-30.1)#89 |
| 7. | Bellevue Borough | 3.4% | 34.2%(-30.7)#7 | 33.1%(-29.7)#127 |
| 8. | Fleetwood Borough | 3.7% | 34.2%(-30.5)#8 | 33.1%(-29.5)#148 |
| 9. | Georgetown Cdp Luzerne County | 4.1% | 34.2%(-30.0)#9 | 33.1%(-29.0)#188 |
| 10. | Morton Borough | 4.2% | 34.2%(-30.0)#10 | 33.1%(-29.0)#192 |
| 11. | East Lansdowne Borough | 4.4% | 34.2%(-29.8)#11 | 33.1%(-28.7)#212 |
| 12. | Parkville | 4.5% | 34.2%(-29.7)#12 | 33.1%(-28.7)#218 |
| 13. | King Of Prussia | 4.5% | 34.2%(-29.6)#13 | 33.1%(-28.6)#226 |
| 14. | Oreland | 4.7% | 34.2%(-29.5)#14 | 33.1%(-28.5)#246 |
| 15. | West Pittsburg | 4.7% | 34.2%(-29.5)#15 | 33.1%(-28.4)#249 |
| 16. | Jermyn Borough | 4.8% | 34.2%(-29.4)#16 | 33.1%(-28.3)#265 |
| 17. | Alburtis Borough | 4.9% | 34.2%(-29.3)#17 | 33.1%(-28.3)#268 |
| 18. | Leetsdale Borough | 5.0% | 34.2%(-29.2)#18 | 33.1%(-28.1)#292 |
| 19. | Trafford Borough | 5.1% | 34.2%(-29.0)#19 | 33.1%(-28.0)#314 |
| 20. | Dillsburg Borough | 5.3% | 34.2%(-28.9)#20 | 33.1%(-27.8)#340 |
| 21. | Topton Borough | 5.4% | 34.2%(-28.8)#21 | 33.1%(-27.8)#345 |
| 22. | Emmaus Borough | 6.0% | 34.2%(-28.2)#22 | 33.1%(-27.2)#432 |
| 23. | Mountville Borough | 6.1% | 34.2%(-28.1)#23 | 33.1%(-27.0)#451 |
| 24. | Hughestown Borough | 6.2% | 34.2%(-27.9)#24 | 33.1%(-26.9)#468 |
| 25. | Clintonville Borough | 6.2% | 34.2%(-27.9)#25 | 33.1%(-26.9)#475 |
| 26. | Minersville Borough | 6.3% | 34.2%(-27.8)#26 | 33.1%(-26.8)#488 |
| 27. | Riegelsville Borough | 6.5% | 34.2%(-27.7)#27 | 33.1%(-26.7)#510 |
| 28. | Bonneauville Borough | 6.6% | 34.2%(-27.6)#28 | 33.1%(-26.6)#524 |
| 29. | Camp Hill Borough | 6.6% | 34.2%(-27.5)#29 | 33.1%(-26.5)#532 |
| 30. | Shamokin Dam Borough | 6.7% | 34.2%(-27.5)#30 | 33.1%(-26.5)#539 |
| 31. | York Haven Borough | 6.7% | 34.2%(-27.5)#31 | 33.1%(-26.5)#541 |
| 32. | Ohioville Borough | 6.7% | 34.2%(-27.5)#32 | 33.1%(-26.4)#557 |
| 33. | Langhorne Borough | 6.8% | 34.2%(-27.4)#33 | 33.1%(-26.3)#572 |
| 34. | Carnot Moon | 6.9% | 34.2%(-27.3)#34 | 33.1%(-26.3)#577 |
| 35. | Apollo Borough | 7.1% | 34.2%(-27.0)#35 | 33.1%(-26.0)#614 |
| 36. | Townville Borough | 7.1% | 34.2%(-27.0)#36 | 33.1%(-26.0)#631 |
| 37. | Ashland Borough | 7.3% | 34.2%(-26.9)#37 | 33.1%(-25.8)#657 |
| 38. | West Middlesex Borough | 7.4% | 34.2%(-26.8)#38 | 33.1%(-25.7)#673 |
| 39. | Newville Borough | 7.5% | 34.2%(-26.6)#39 | 33.1%(-25.6)#696 |
| 40. | Trappe Borough | 7.6% | 34.2%(-26.5)#40 | 33.1%(-25.5)#708 |
| 41. | Waynesboro Borough | 7.8% | 34.2%(-26.4)#41 | 33.1%(-25.4)#746 |
| 42. | Arlington Heights | 8.1% | 34.2%(-26.1)#42 | 33.1%(-25.1)#790 |
| 43. | Montoursville Borough | 8.2% | 34.2%(-26.0)#43 | 33.1%(-24.9)#815 |
| 44. | Jamestown Borough | 8.3% | 34.2%(-25.8)#44 | 33.1%(-24.8)#849 |
| 45. | Homeacre Lyndora | 8.4% | 34.2%(-25.8)#45 | 33.1%(-24.7)#868 |
| 46. | Berwyn | 8.5% | 34.2%(-25.7)#46 | 33.1%(-24.7)#878 |
| 47. | Palo Alto Borough | 8.6% | 34.2%(-25.6)#47 | 33.1%(-24.6)#895 |
| 48. | Conway Borough | 8.7% | 34.2%(-25.5)#48 | 33.1%(-24.4)#910 |
| 49. | Bridgewater Borough | 8.7% | 34.2%(-25.5)#49 | 33.1%(-24.4)#919 |
| 50. | Franklin Park Borough | 8.7% | 34.2%(-25.4)#50 | 33.1%(-24.4)#928 |
| 51. | Midland Borough | 8.8% | 34.2%(-25.4)#51 | 33.1%(-24.4)#936 |
| 52. | Olyphant Borough | 8.8% | 34.2%(-25.3)#52 | 33.1%(-24.3)#954 |
| 53. | Edinboro Borough | 9.0% | 34.2%(-25.2)#53 | 33.1%(-24.2)#980 |
| 54. | Spring House | 9.1% | 34.2%(-25.1)#54 | 33.1%(-24.0)#993 |
| 55. | Mercersburg Borough | 9.2% | 34.2%(-25.0)#55 | 33.1%(-24.0)#1,024 |
| 56. | Doylestown Borough | 9.3% | 34.2%(-24.9)#56 | 33.1%(-23.9)#1,034 |
| 57. | Laureldale Borough | 9.5% | 34.2%(-24.7)#57 | 33.1%(-23.7)#1,062 |
| 58. | Pleasantville Borough Venango County | 9.5% | 34.2%(-24.7)#58 | 33.1%(-23.6)#1,079 |
| 59. | Clarksville Borough | 9.5% | 34.2%(-24.7)#59 | 33.1%(-23.6)#1,084 |
| 60. | Paxtonia | 10.0% | 34.2%(-24.2)#60 | 33.1%(-23.1)#1,159 |
| 61. | Hereford | 10.0% | 34.2%(-24.2)#61 | 33.1%(-23.1)#1,170 |
| 62. | Hyndman Borough | 10.0% | 34.2%(-24.2)#62 | 33.1%(-23.1)#1,177 |
| 63. | Annville | 10.3% | 34.2%(-23.9)#63 | 33.1%(-22.9)#1,226 |
| 64. | East Prospect Borough | 10.5% | 34.2%(-23.7)#64 | 33.1%(-22.6)#1,282 |
| 65. | Newton Hamilton Borough | 10.5% | 34.2%(-23.7)#65 | 33.1%(-22.6)#1,292 |
| 66. | Brookhaven Borough | 10.5% | 34.2%(-23.6)#66 | 33.1%(-22.6)#1,295 |
| 67. | East Butler Borough | 10.6% | 34.2%(-23.6)#67 | 33.1%(-22.5)#1,308 |
| 68. | Warminster Heights | 10.7% | 34.2%(-23.5)#68 | 33.1%(-22.5)#1,318 |
| 69. | Crafton Borough | 10.7% | 34.2%(-23.5)#69 | 33.1%(-22.4)#1,322 |
| 70. | Dunmore Borough | 10.7% | 34.2%(-23.5)#70 | 33.1%(-22.4)#1,326 |
| 71. | Marcus Hook Borough | 10.7% | 34.2%(-23.4)#71 | 33.1%(-22.4)#1,338 |
| 72. | Pleasant Gap | 10.8% | 34.2%(-23.4)#72 | 33.1%(-22.3)#1,348 |
| 73. | Conyngham Borough | 10.8% | 34.2%(-23.4)#73 | 33.1%(-22.3)#1,349 |
| 74. | Great Bend Borough | 10.8% | 34.2%(-23.4)#74 | 33.1%(-22.3)#1,352 |
| 75. | Yardley Borough | 10.8% | 34.2%(-23.3)#75 | 33.1%(-22.3)#1,354 |
| 76. | West Easton Borough | 10.9% | 34.2%(-23.3)#76 | 33.1%(-22.3)#1,361 |
| 77. | Yeadon Borough | 10.9% | 34.2%(-23.2)#77 | 33.1%(-22.2)#1,369 |
| 78. | Youngsville Borough | 10.9% | 34.2%(-23.2)#78 | 33.1%(-22.2)#1,373 |
| 79. | New Cumberland Borough | 11.1% | 34.2%(-23.1)#79 | 33.1%(-22.1)#1,388 |
| 80. | Gettysburg Borough | 11.1% | 34.2%(-23.1)#80 | 33.1%(-22.0)#1,395 |
| 81. | Penn Borough | 11.1% | 34.2%(-23.1)#81 | 33.1%(-22.0)#1,416 |
| 82. | New Market | 11.2% | 34.2%(-22.9)#82 | 33.1%(-21.9)#1,462 |
| 83. | Duncansville Borough | 11.4% | 34.2%(-22.8)#83 | 33.1%(-21.8)#1,486 |
| 84. | Oakmont Borough | 11.7% | 34.2%(-22.5)#84 | 33.1%(-21.4)#1,543 |
| 85. | Tidioute Borough | 11.8% | 34.2%(-22.4)#85 | 33.1%(-21.4)#1,561 |
| 86. | Parkside Borough | 11.8% | 34.2%(-22.4)#86 | 33.1%(-21.3)#1,584 |
| 87. | Mountain Top | 11.9% | 34.2%(-22.3)#87 | 33.1%(-21.2)#1,594 |
| 88. | Shippensburg Borough | 11.9% | 34.2%(-22.3)#88 | 33.1%(-21.2)#1,597 |
| 89. | Grantley | 12.2% | 34.2%(-22.0)#89 | 33.1%(-20.9)#1,662 |
| 90. | Ambler Borough | 12.2% | 34.2%(-22.0)#90 | 33.1%(-20.9)#1,666 |
| 91. | Clarks Summit Borough | 12.2% | 34.2%(-21.9)#91 | 33.1%(-20.9)#1,670 |
| 92. | Lake Wynonah | 12.4% | 34.2%(-21.8)#92 | 33.1%(-20.7)#1,697 |
| 93. | Broomall | 12.4% | 34.2%(-21.8)#93 | 33.1%(-20.7)#1,700 |
| 94. | Clifton Heights Borough | 12.5% | 34.2%(-21.7)#94 | 33.1%(-20.6)#1,717 |
| 95. | Fox Chapel Borough | 12.5% | 34.2%(-21.7)#95 | 33.1%(-20.6)#1,720 |
| 96. | Pennsbury Village Borough | 12.5% | 34.2%(-21.7)#96 | 33.1%(-20.6)#1,739 |
| 97. | Weigelstown | 12.5% | 34.2%(-21.6)#97 | 33.1%(-20.6)#1,765 |
| 98. | Exeter Borough | 12.6% | 34.2%(-21.6)#98 | 33.1%(-20.5)#1,769 |
| 99. | Honey Brook Borough | 12.7% | 34.2%(-21.5)#99 | 33.1%(-20.5)#1,790 |
| 100. | Penn Estates | 12.7% | 34.2%(-21.5)#100 | 33.1%(-20.5)#1,791 |
Common Questions
What are the Top 10 Cities with the Lowest Poverty Level Among Single Mothers in Pennsylvania?
Top 10 Cities with the Lowest Poverty Level Among Single Mothers in Pennsylvania are:
#1
1.7%
#2
3.0%
#3
4.5%
#4
4.5%
#5
4.7%
#6
4.7%
#7
6.9%
#8
8.1%
#9
8.4%
#10
8.5%
What city has the Lowest Poverty Level Among Single Mothers in Pennsylvania?
Ardmore has the Lowest Poverty Level Among Single Mothers in Pennsylvania with 1.7%.
What is the Poverty Level Among Single Mothers in the State of Pennsylvania?
Poverty Level Among Single Mothers in Pennsylvania is 34.2%.
What is the Poverty Level Among Single Mothers in the United States?
Poverty Level Among Single Mothers in the United States is 33.1%.