Cities with the Lowest Poverty Level Among Single Mothers in Indiana
RELATED REPORTS & OPTIONS
Lowest Poverty | Single Mother
Indiana
Compare Cities
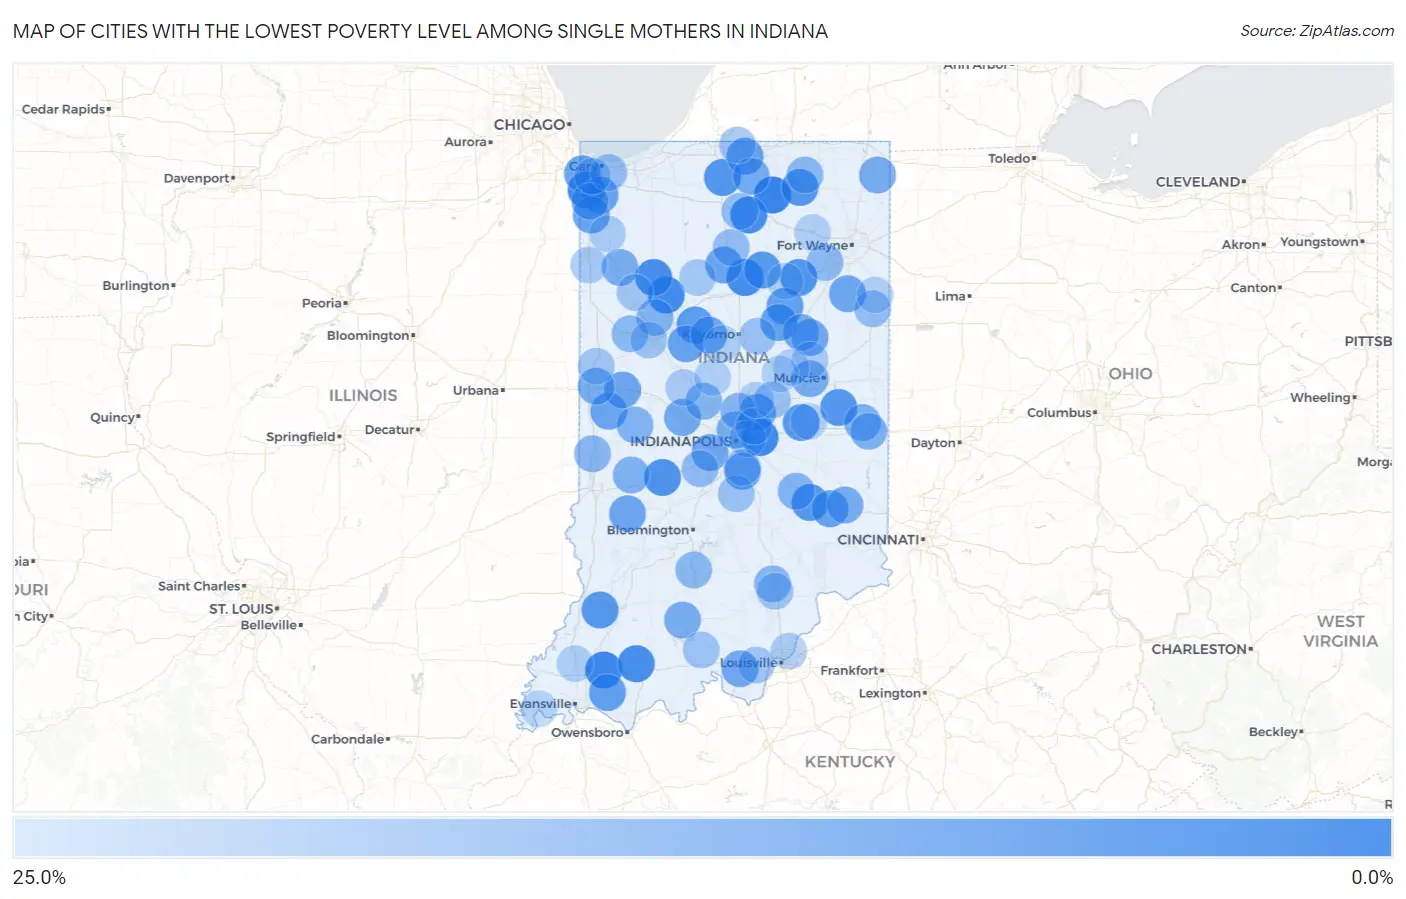
Map of Cities with the Lowest Poverty Level Among Single Mothers in Indiana
25.0%
0.0%
Cities with the Lowest Poverty Level Among Single Mothers in Indiana
| City | Single Mother Poverty | vs State | vs National | |
| 1. | Milford | 3.0% | 35.1%(-32.1)#1 | 33.1%(-30.1)#88 |
| 2. | St John | 3.4% | 35.1%(-31.7)#2 | 33.1%(-29.8)#121 |
| 3. | Lynnville | 3.7% | 35.1%(-31.4)#3 | 33.1%(-29.4)#152 |
| 4. | Cumberland | 3.9% | 35.1%(-31.2)#4 | 33.1%(-29.2)#170 |
| 5. | Monticello | 4.6% | 35.1%(-30.5)#5 | 33.1%(-28.5)#237 |
| 6. | Denver | 5.0% | 35.1%(-30.1)#6 | 33.1%(-28.1)#298 |
| 7. | Monon | 5.3% | 35.1%(-29.8)#7 | 33.1%(-27.9)#328 |
| 8. | Holland | 5.3% | 35.1%(-29.8)#8 | 33.1%(-27.9)#333 |
| 9. | Etna Green | 5.3% | 35.1%(-29.8)#9 | 33.1%(-27.9)#336 |
| 10. | Cloverdale | 6.6% | 35.1%(-28.5)#10 | 33.1%(-26.5)#528 |
| 11. | Andrews | 6.9% | 35.1%(-28.2)#11 | 33.1%(-26.2)#583 |
| 12. | Lakeville | 7.1% | 35.1%(-27.9)#12 | 33.1%(-26.0)#622 |
| 13. | Ligonier | 7.3% | 35.1%(-27.8)#13 | 33.1%(-25.9)#649 |
| 14. | Mooreland | 7.4% | 35.1%(-27.7)#14 | 33.1%(-25.7)#677 |
| 15. | Greensburg | 7.6% | 35.1%(-27.5)#15 | 33.1%(-25.6)#698 |
| 16. | Shirley | 7.7% | 35.1%(-27.4)#16 | 33.1%(-25.4)#725 |
| 17. | Monroe City | 7.7% | 35.1%(-27.4)#17 | 33.1%(-25.4)#727 |
| 18. | Roann | 8.0% | 35.1%(-27.1)#18 | 33.1%(-25.1)#787 |
| 19. | Flora | 8.2% | 35.1%(-26.9)#19 | 33.1%(-24.9)#824 |
| 20. | La Fontaine | 9.3% | 35.1%(-25.8)#20 | 33.1%(-23.8)#1,044 |
| 21. | Boonville | 9.3% | 35.1%(-25.7)#21 | 33.1%(-23.8)#1,045 |
| 22. | Sweetser | 9.4% | 35.1%(-25.7)#22 | 33.1%(-23.7)#1,056 |
| 23. | Osceola | 9.8% | 35.1%(-25.3)#23 | 33.1%(-23.3)#1,124 |
| 24. | Munster | 9.8% | 35.1%(-25.2)#24 | 33.1%(-23.3)#1,132 |
| 25. | Rossville | 9.9% | 35.1%(-25.2)#25 | 33.1%(-23.3)#1,134 |
| 26. | New Point | 10.0% | 35.1%(-25.1)#26 | 33.1%(-23.1)#1,192 |
| 27. | Fishers | 10.3% | 35.1%(-24.8)#27 | 33.1%(-22.8)#1,231 |
| 28. | Crown Point | 10.3% | 35.1%(-24.7)#28 | 33.1%(-22.8)#1,244 |
| 29. | New Whiteland | 10.4% | 35.1%(-24.7)#29 | 33.1%(-22.7)#1,263 |
| 30. | Kingman | 10.5% | 35.1%(-24.6)#30 | 33.1%(-22.6)#1,287 |
| 31. | Fulton | 10.5% | 35.1%(-24.6)#31 | 33.1%(-22.6)#1,293 |
| 32. | Lowell | 10.6% | 35.1%(-24.5)#32 | 33.1%(-22.5)#1,305 |
| 33. | Bluffton | 10.9% | 35.1%(-24.2)#33 | 33.1%(-22.3)#1,360 |
| 34. | Upland | 11.1% | 35.1%(-24.0)#34 | 33.1%(-22.0)#1,400 |
| 35. | Clay City | 11.1% | 35.1%(-24.0)#35 | 33.1%(-22.0)#1,412 |
| 36. | Hillsboro | 11.1% | 35.1%(-24.0)#36 | 33.1%(-22.0)#1,430 |
| 37. | Burlington | 11.1% | 35.1%(-24.0)#37 | 33.1%(-22.0)#1,431 |
| 38. | Corydon | 11.4% | 35.1%(-23.7)#38 | 33.1%(-21.7)#1,492 |
| 39. | Plainfield | 11.5% | 35.1%(-23.6)#39 | 33.1%(-21.7)#1,500 |
| 40. | Jamestown | 11.8% | 35.1%(-23.3)#40 | 33.1%(-21.4)#1,560 |
| 41. | Cedar Lake | 11.9% | 35.1%(-23.2)#41 | 33.1%(-21.3)#1,593 |
| 42. | Wakarusa | 12.0% | 35.1%(-23.1)#42 | 33.1%(-21.1)#1,618 |
| 43. | Gas City | 12.5% | 35.1%(-22.6)#43 | 33.1%(-20.6)#1,719 |
| 44. | Hamilton | 12.5% | 35.1%(-22.6)#44 | 33.1%(-20.6)#1,723 |
| 45. | Oldenburg | 12.5% | 35.1%(-22.6)#45 | 33.1%(-20.6)#1,737 |
| 46. | Covington | 12.6% | 35.1%(-22.5)#46 | 33.1%(-20.5)#1,779 |
| 47. | Yorktown | 12.7% | 35.1%(-22.3)#47 | 33.1%(-20.4)#1,802 |
| 48. | French Lick | 12.8% | 35.1%(-22.3)#48 | 33.1%(-20.4)#1,809 |
| 49. | Rensselaer | 12.9% | 35.1%(-22.2)#49 | 33.1%(-20.3)#1,825 |
| 50. | Rocky Ripple | 13.3% | 35.1%(-21.8)#50 | 33.1%(-19.8)#1,944 |
| 51. | Greens Fork | 13.3% | 35.1%(-21.8)#51 | 33.1%(-19.8)#1,947 |
| 52. | Centerville | 13.6% | 35.1%(-21.5)#52 | 33.1%(-19.5)#1,999 |
| 53. | Harmony | 13.7% | 35.1%(-21.4)#53 | 33.1%(-19.4)#2,036 |
| 54. | Brookston | 14.0% | 35.1%(-21.1)#54 | 33.1%(-19.1)#2,094 |
| 55. | St Paul | 14.3% | 35.1%(-20.8)#55 | 33.1%(-18.8)#2,161 |
| 56. | Waveland | 14.3% | 35.1%(-20.8)#56 | 33.1%(-18.8)#2,180 |
| 57. | Lebanon | 14.6% | 35.1%(-20.5)#57 | 33.1%(-18.5)#2,266 |
| 58. | Carmel | 14.7% | 35.1%(-20.4)#58 | 33.1%(-18.5)#2,272 |
| 59. | Fairview Park | 14.8% | 35.1%(-20.3)#59 | 33.1%(-18.3)#2,308 |
| 60. | Crothersville | 15.0% | 35.1%(-20.1)#60 | 33.1%(-18.1)#2,346 |
| 61. | Topeka | 15.2% | 35.1%(-19.9)#61 | 33.1%(-18.0)#2,375 |
| 62. | Oolitic | 15.2% | 35.1%(-19.9)#62 | 33.1%(-17.9)#2,378 |
| 63. | Otterbein | 15.6% | 35.1%(-19.5)#63 | 33.1%(-17.5)#2,492 |
| 64. | Roanoke | 15.9% | 35.1%(-19.1)#64 | 33.1%(-17.2)#2,576 |
| 65. | Monrovia | 16.3% | 35.1%(-18.8)#65 | 33.1%(-16.9)#2,651 |
| 66. | Rochester | 16.7% | 35.1%(-18.4)#66 | 33.1%(-16.5)#2,717 |
| 67. | Berne | 16.7% | 35.1%(-18.4)#67 | 33.1%(-16.5)#2,720 |
| 68. | New Chicago | 16.7% | 35.1%(-18.4)#68 | 33.1%(-16.5)#2,729 |
| 69. | Bourbon | 16.8% | 35.1%(-18.2)#69 | 33.1%(-16.3)#2,835 |
| 70. | Warren Park | 17.4% | 35.1%(-17.6)#70 | 33.1%(-15.7)#2,958 |
| 71. | Lawrence | 17.5% | 35.1%(-17.6)#71 | 33.1%(-15.7)#2,961 |
| 72. | Trafalgar | 17.6% | 35.1%(-17.4)#72 | 33.1%(-15.5)#2,991 |
| 73. | Lapel | 17.7% | 35.1%(-17.4)#73 | 33.1%(-15.4)#3,012 |
| 74. | Greentown | 17.7% | 35.1%(-17.3)#74 | 33.1%(-15.4)#3,018 |
| 75. | West Lafayette | 18.0% | 35.1%(-17.1)#75 | 33.1%(-15.2)#3,083 |
| 76. | English | 18.2% | 35.1%(-16.9)#76 | 33.1%(-15.0)#3,136 |
| 77. | Austin | 18.3% | 35.1%(-16.8)#77 | 33.1%(-14.8)#3,194 |
| 78. | Granger | 18.5% | 35.1%(-16.6)#78 | 33.1%(-14.6)#3,225 |
| 79. | Lanesville | 18.8% | 35.1%(-16.3)#79 | 33.1%(-14.4)#3,293 |
| 80. | West Lebanon | 18.8% | 35.1%(-16.3)#80 | 33.1%(-14.4)#3,296 |
| 81. | Greenwood | 18.8% | 35.1%(-16.3)#81 | 33.1%(-14.3)#3,319 |
| 82. | Wolcott | 19.0% | 35.1%(-16.0)#82 | 33.1%(-14.1)#3,383 |
| 83. | Royal Center | 19.4% | 35.1%(-15.7)#83 | 33.1%(-13.8)#3,461 |
| 84. | Morocco | 19.6% | 35.1%(-15.5)#84 | 33.1%(-13.6)#3,516 |
| 85. | Griffith | 19.7% | 35.1%(-15.4)#85 | 33.1%(-13.5)#3,526 |
| 86. | Thorntown | 20.0% | 35.1%(-15.1)#86 | 33.1%(-13.1)#3,617 |
| 87. | Gaston | 20.0% | 35.1%(-15.1)#87 | 33.1%(-13.1)#3,635 |
| 88. | Roselawn | 20.2% | 35.1%(-14.8)#88 | 33.1%(-12.9)#3,728 |
| 89. | Jeffersonville | 20.3% | 35.1%(-14.8)#89 | 33.1%(-12.8)#3,746 |
| 90. | Fort Branch | 20.5% | 35.1%(-14.6)#90 | 33.1%(-12.7)#3,777 |
| 91. | Russiaville | 20.7% | 35.1%(-14.4)#91 | 33.1%(-12.4)#3,843 |
| 92. | Monroe | 20.8% | 35.1%(-14.3)#92 | 33.1%(-12.3)#3,895 |
| 93. | Columbia City | 20.9% | 35.1%(-14.1)#93 | 33.1%(-12.2)#3,921 |
| 94. | Kirklin | 21.1% | 35.1%(-14.0)#94 | 33.1%(-12.1)#3,954 |
| 95. | Alexandria | 21.1% | 35.1%(-14.0)#95 | 33.1%(-12.0)#3,967 |
| 96. | Frankton | 21.2% | 35.1%(-13.9)#96 | 33.1%(-12.0)#3,974 |
| 97. | Noblesville | 21.4% | 35.1%(-13.7)#97 | 33.1%(-11.8)#4,019 |
| 98. | Kennard | 21.4% | 35.1%(-13.7)#98 | 33.1%(-11.7)#4,054 |
| 99. | Lagro | 21.4% | 35.1%(-13.7)#99 | 33.1%(-11.7)#4,064 |
| 100. | Mount Vernon | 21.8% | 35.1%(-13.2)#100 | 33.1%(-11.3)#4,164 |
Common Questions
What are the Top 10 Cities with the Lowest Poverty Level Among Single Mothers in Indiana?
Top 10 Cities with the Lowest Poverty Level Among Single Mothers in Indiana are:
#1
3.0%
#2
3.4%
#3
3.7%
#4
3.9%
#5
4.6%
#6
5.0%
#7
5.3%
#8
5.3%
#9
5.3%
#10
6.6%
What city has the Lowest Poverty Level Among Single Mothers in Indiana?
Milford has the Lowest Poverty Level Among Single Mothers in Indiana with 3.0%.
What is the Poverty Level Among Single Mothers in the State of Indiana?
Poverty Level Among Single Mothers in Indiana is 35.1%.
What is the Poverty Level Among Single Mothers in the United States?
Poverty Level Among Single Mothers in the United States is 33.1%.