Cities with the Lowest Poverty Level Among Single Mothers in Arkansas
RELATED REPORTS & OPTIONS
Lowest Poverty | Single Mother
Arkansas
Compare Cities
Map of Cities with the Lowest Poverty Level Among Single Mothers in Arkansas
40.0%
0.0%
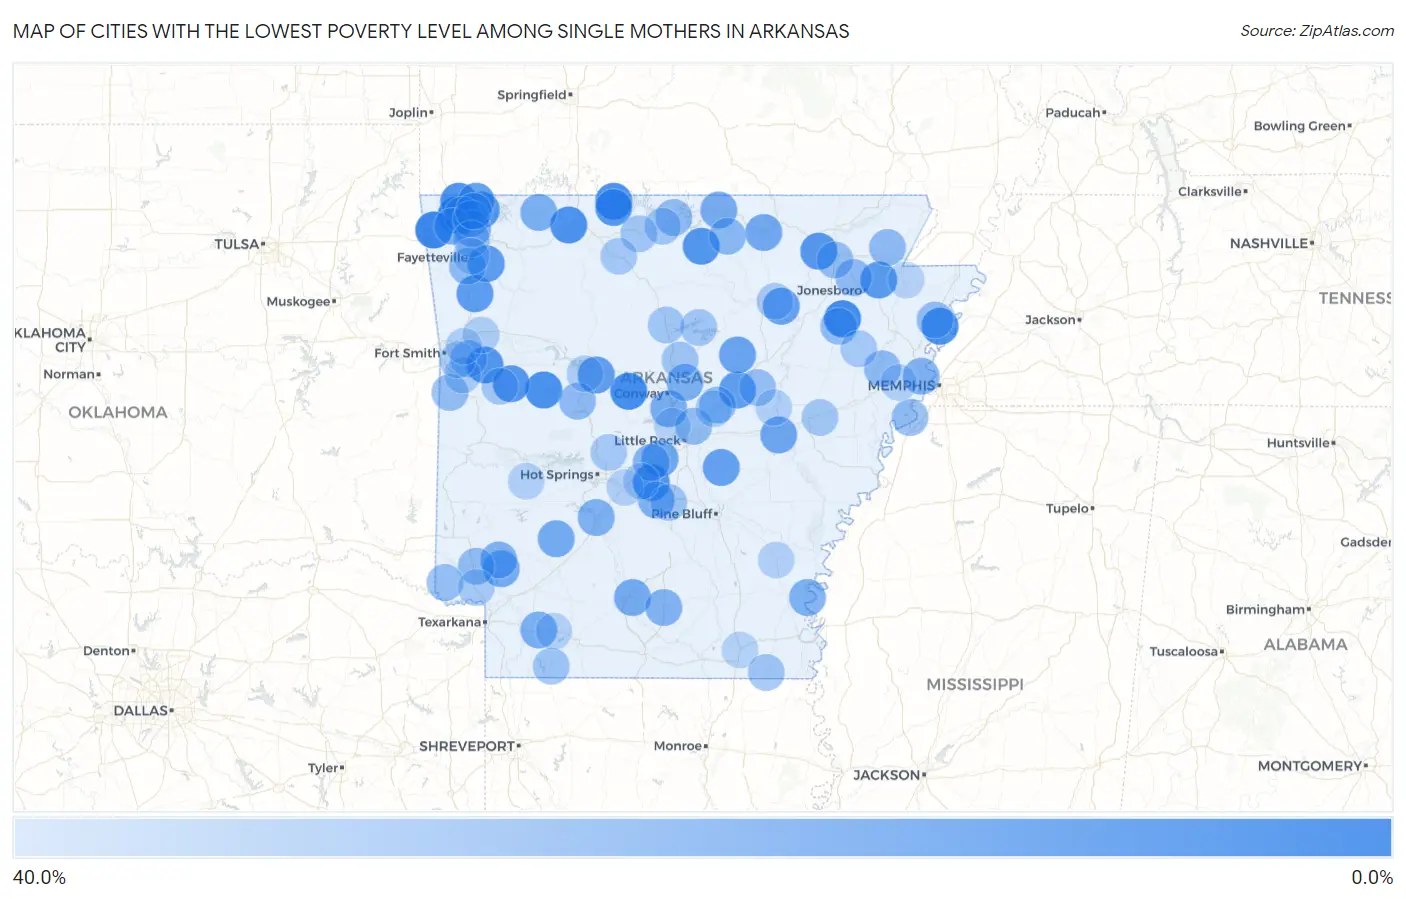
Cities with the Lowest Poverty Level Among Single Mothers in Arkansas
| City | Single Mother Poverty | vs State | vs National | |
| 1. | Centerton | 1.9% | 39.8% (-37.9)#1 | 33.1% (-31.2)#30 |
| 2. | Gentry | 2.9% | 39.8% (-36.9)#2 | 33.1% (-30.2)#85 |
| 3. | Weiner | 4.8% | 39.8% (-35.0)#3 | 33.1% (-28.4)#259 |
| 4. | Oppelo | 5.0% | 39.8% (-34.8)#4 | 33.1% (-28.1)#293 |
| 5. | Havana | 6.2% | 39.8% (-33.6)#5 | 33.1% (-27.0)#458 |
| 6. | Diamond City | 6.5% | 39.8% (-33.3)#6 | 33.1% (-26.7)#508 |
| 7. | Bella Vista | 6.7% | 39.8% (-33.1)#7 | 33.1% (-26.4)#560 |
| 8. | Wilson | 7.2% | 39.8% (-32.6)#8 | 33.1% (-25.9)#644 |
| 9. | Alpena | 7.4% | 39.8% (-32.4)#9 | 33.1% (-25.7)#676 |
| 10. | Ozark Acres | 8.1% | 39.8% (-31.7)#10 | 33.1% (-25.0)#805 |
| 11. | Charleston | 8.3% | 39.8% (-31.5)#11 | 33.1% (-24.8)#838 |
| 12. | Tull | 8.3% | 39.8% (-31.5)#12 | 33.1% (-24.8)#853 |
| 13. | Avoca | 8.7% | 39.8% (-31.1)#13 | 33.1% (-24.4)#920 |
| 14. | Calico Rock | 9.1% | 39.8% (-30.7)#14 | 33.1% (-24.0)#999 |
| 15. | Magazine | 9.3% | 39.8% (-30.5)#15 | 33.1% (-23.8)#1,040 |
| 16. | Black Rock | 9.5% | 39.8% (-30.3)#16 | 33.1% (-23.6)#1,078 |
| 17. | Lead Hill | 10.0% | 39.8% (-29.8)#17 | 33.1% (-23.1)#1,193 |
| 18. | Brookland | 10.5% | 39.8% (-29.3)#18 | 33.1% (-22.7)#1,269 |
| 19. | Winslow | 11.1% | 39.8% (-28.7)#19 | 33.1% (-22.0)#1,446 |
| 20. | Elkins | 11.4% | 39.8% (-28.4)#20 | 33.1% (-21.8)#1,484 |
| 21. | Pea Ridge | 11.5% | 39.8% (-28.3)#21 | 33.1% (-21.6)#1,512 |
| 22. | Pottsville | 12.1% | 39.8% (-27.7)#22 | 33.1% (-21.0)#1,640 |
| 23. | Mcrae | 12.3% | 39.8% (-27.5)#23 | 33.1% (-20.9)#1,680 |
| 24. | England | 13.3% | 39.8% (-26.5)#24 | 33.1% (-19.8)#1,927 |
| 25. | Newark | 13.3% | 39.8% (-26.5)#25 | 33.1% (-19.8)#1,930 |
| 26. | Letona | 14.3% | 39.8% (-25.5)#26 | 33.1% (-18.8)#2,199 |
| 27. | De Valls Bluff | 16.1% | 39.8% (-23.7)#27 | 33.1% (-17.0)#2,619 |
| 28. | Bryant | 16.2% | 39.8% (-23.6)#28 | 33.1% (-17.0)#2,624 |
| 29. | Ash Flat | 16.7% | 39.8% (-23.1)#29 | 33.1% (-16.5)#2,739 |
| 30. | Antoine | 17.4% | 39.8% (-22.4)#30 | 33.1% (-15.7)#2,952 |
| 31. | East Camden | 17.6% | 39.8% (-22.2)#31 | 33.1% (-15.5)#2,990 |
| 32. | Tollette | 17.6% | 39.8% (-22.2)#32 | 33.1% (-15.5)#3,002 |
| 33. | Viola | 18.2% | 39.8% (-21.6)#33 | 33.1% (-15.0)#3,168 |
| 34. | Bentonville | 18.5% | 39.8% (-21.3)#34 | 33.1% (-14.6)#3,241 |
| 35. | Mayflower | 18.8% | 39.8% (-21.0)#35 | 33.1% (-14.4)#3,290 |
| 36. | Lewisville | 19.2% | 39.8% (-20.6)#36 | 33.1% (-13.9)#3,428 |
| 37. | Berryville | 19.3% | 39.8% (-20.5)#37 | 33.1% (-13.8)#3,451 |
| 38. | Lowell | 19.8% | 39.8% (-20.0)#38 | 33.1% (-13.4)#3,544 |
| 39. | Holland | 20.0% | 39.8% (-19.8)#39 | 33.1% (-13.1)#3,633 |
| 40. | Arkansas City | 20.0% | 39.8% (-19.8)#40 | 33.1% (-13.1)#3,650 |
| 41. | Prattsville | 20.0% | 39.8% (-19.8)#41 | 33.1% (-13.1)#3,657 |
| 42. | Mineral Springs | 20.4% | 39.8% (-19.4)#42 | 33.1% (-12.7)#3,767 |
| 43. | Caddo Valley | 20.6% | 39.8% (-19.2)#43 | 33.1% (-12.5)#3,812 |
| 44. | Benton | 20.7% | 39.8% (-19.1)#44 | 33.1% (-12.4)#3,849 |
| 45. | Marion | 20.8% | 39.8% (-19.0)#45 | 33.1% (-12.3)#3,879 |
| 46. | Hampton | 20.9% | 39.8% (-18.9)#46 | 33.1% (-12.2)#3,919 |
| 47. | Highfill | 21.2% | 39.8% (-18.6)#47 | 33.1% (-12.0)#3,975 |
| 48. | Oxford | 23.1% | 39.8% (-16.7)#48 | 33.1% (-10.1)#4,500 |
| 49. | Greenland | 23.6% | 39.8% (-16.2)#49 | 33.1% (-9.50)#4,649 |
| 50. | Oak Grove Heights | 24.0% | 39.8% (-15.8)#50 | 33.1% (-9.14)#4,748 |
| 51. | Ola | 24.0% | 39.8% (-15.8)#51 | 33.1% (-9.14)#4,750 |
| 52. | Parkin | 24.0% | 39.8% (-15.8)#52 | 33.1% (-9.14)#4,753 |
| 53. | Austin | 24.1% | 39.8% (-15.7)#53 | 33.1% (-9.08)#4,765 |
| 54. | Bono | 24.1% | 39.8% (-15.7)#54 | 33.1% (-9.03)#4,778 |
| 55. | Mountain Home | 24.8% | 39.8% (-15.0)#55 | 33.1% (-8.38)#4,921 |
| 56. | Lavaca | 25.0% | 39.8% (-14.8)#56 | 33.1% (-8.14)#4,977 |
| 57. | Horseshoe Lake | 25.0% | 39.8% (-14.8)#57 | 33.1% (-8.14)#5,061 |
| 58. | Midland | 25.0% | 39.8% (-14.8)#58 | 33.1% (-8.14)#5,074 |
| 59. | Ben Lomond | 25.0% | 39.8% (-14.8)#59 | 33.1% (-8.14)#5,094 |
| 60. | Waldenburg | 25.0% | 39.8% (-14.8)#60 | 33.1% (-8.14)#5,118 |
| 61. | Marie | 25.0% | 39.8% (-14.8)#61 | 33.1% (-8.14)#5,119 |
| 62. | Rogers | 25.1% | 39.8% (-14.7)#62 | 33.1% (-8.06)#5,127 |
| 63. | Sherwood | 25.2% | 39.8% (-14.6)#63 | 33.1% (-7.98)#5,136 |
| 64. | Hoxie | 25.9% | 39.8% (-13.9)#64 | 33.1% (-7.28)#5,290 |
| 65. | Foreman | 26.3% | 39.8% (-13.5)#65 | 33.1% (-6.82)#5,407 |
| 66. | Griffithville | 26.3% | 39.8% (-13.5)#66 | 33.1% (-6.82)#5,424 |
| 67. | Taylor | 27.8% | 39.8% (-12.0)#67 | 33.1% (-5.36)#5,820 |
| 68. | Sheridan | 28.1% | 39.8% (-11.7)#68 | 33.1% (-5.07)#5,900 |
| 69. | Springdale | 28.1% | 39.8% (-11.7)#69 | 33.1% (-4.99)#5,933 |
| 70. | Guy | 28.6% | 39.8% (-11.2)#70 | 33.1% (-4.56)#6,067 |
| 71. | Wilmot | 28.6% | 39.8% (-11.2)#71 | 33.1% (-4.56)#6,084 |
| 72. | Yellville | 29.0% | 39.8% (-10.8)#72 | 33.1% (-4.10)#6,201 |
| 73. | Greers Ferry | 29.0% | 39.8% (-10.8)#73 | 33.1% (-4.10)#6,204 |
| 74. | Clinton | 29.2% | 39.8% (-10.6)#74 | 33.1% (-3.91)#6,248 |
| 75. | Wheatley | 29.4% | 39.8% (-10.4)#75 | 33.1% (-3.72)#6,299 |
| 76. | Booneville | 29.4% | 39.8% (-10.4)#76 | 33.1% (-3.69)#6,311 |
| 77. | Gassville | 29.5% | 39.8% (-10.3)#77 | 33.1% (-3.59)#6,327 |
| 78. | Pindall | 30.0% | 39.8% (-9.80)#78 | 33.1% (-3.14)#6,508 |
| 79. | Hot Springs Village | 30.1% | 39.8% (-9.73)#79 | 33.1% (-3.07)#6,516 |
| 80. | Little Flock | 30.2% | 39.8% (-9.58)#80 | 33.1% (-2.92)#6,540 |
| 81. | Cherry Valley | 30.3% | 39.8% (-9.50)#81 | 33.1% (-2.83)#6,569 |
| 82. | Ashdown | 30.7% | 39.8% (-9.07)#82 | 33.1% (-2.41)#6,659 |
| 83. | Greenwood | 31.2% | 39.8% (-8.59)#83 | 33.1% (-1.93)#6,790 |
| 84. | Sulphur Rock | 31.4% | 39.8% (-8.37)#84 | 33.1% (-1.71)#6,855 |
| 85. | Cabot | 31.7% | 39.8% (-8.12)#85 | 33.1% (-1.46)#6,913 |
| 86. | Mulberry | 32.1% | 39.8% (-7.66)#86 | 33.1% (-0.993)#7,037 |
| 87. | Dardanelle | 32.2% | 39.8% (-7.57)#87 | 33.1% (-0.904)#7,058 |
| 88. | Barling | 32.3% | 39.8% (-7.49)#88 | 33.1% (-0.828)#7,088 |
| 89. | Dumas | 33.3% | 39.8% (-6.47)#89 | 33.1% (+0.198)#7,281 |
| 90. | Des Arc | 33.3% | 39.8% (-6.47)#90 | 33.1% (+0.198)#7,323 |
| 91. | Kibler | 33.3% | 39.8% (-6.47)#91 | 33.1% (+0.198)#7,337 |
| 92. | Rockport | 33.3% | 39.8% (-6.47)#92 | 33.1% (+0.198)#7,357 |
| 93. | Norman | 33.3% | 39.8% (-6.47)#93 | 33.1% (+0.198)#7,456 |
| 94. | Traskwood | 33.3% | 39.8% (-6.47)#94 | 33.1% (+0.198)#7,465 |
| 95. | Buckner | 33.3% | 39.8% (-6.47)#95 | 33.1% (+0.198)#7,476 |
| 96. | Jennette | 33.3% | 39.8% (-6.47)#96 | 33.1% (+0.198)#7,571 |
| 97. | Hamburg | 33.6% | 39.8% (-6.18)#97 | 33.1% (+0.485)#7,618 |
| 98. | Fayetteville | 34.2% | 39.8% (-5.59)#98 | 33.1% (+1.08)#7,726 |
| 99. | Maumelle | 34.3% | 39.8% (-5.52)#99 | 33.1% (+1.14)#7,748 |
| 100. | Monette | 34.4% | 39.8% (-5.37)#100 | 33.1% (+1.29)#7,789 |
Common Questions
What are the Top 10 Cities with the Lowest Poverty Level Among Single Mothers in Arkansas?
Top 10 Cities with the Lowest Poverty Level Among Single Mothers in Arkansas are:
#1
1.9%
#2
2.9%
#3
4.8%
#4
5.0%
#5
6.2%
#6
6.5%
#7
6.7%
#8
7.2%
#9
7.4%
#10
8.3%
What city has the Lowest Poverty Level Among Single Mothers in Arkansas?
Centerton has the Lowest Poverty Level Among Single Mothers in Arkansas with 1.9%.
What is the Poverty Level Among Single Mothers in the State of Arkansas?
Poverty Level Among Single Mothers in Arkansas is 39.8%.
What is the Poverty Level Among Single Mothers in the United States?
Poverty Level Among Single Mothers in the United States is 33.1%.