Cities with the Lowest Poverty Level Among Single Mothers in Massachusetts
RELATED REPORTS & OPTIONS
Lowest Poverty | Single Mother
Massachusetts
Compare Cities
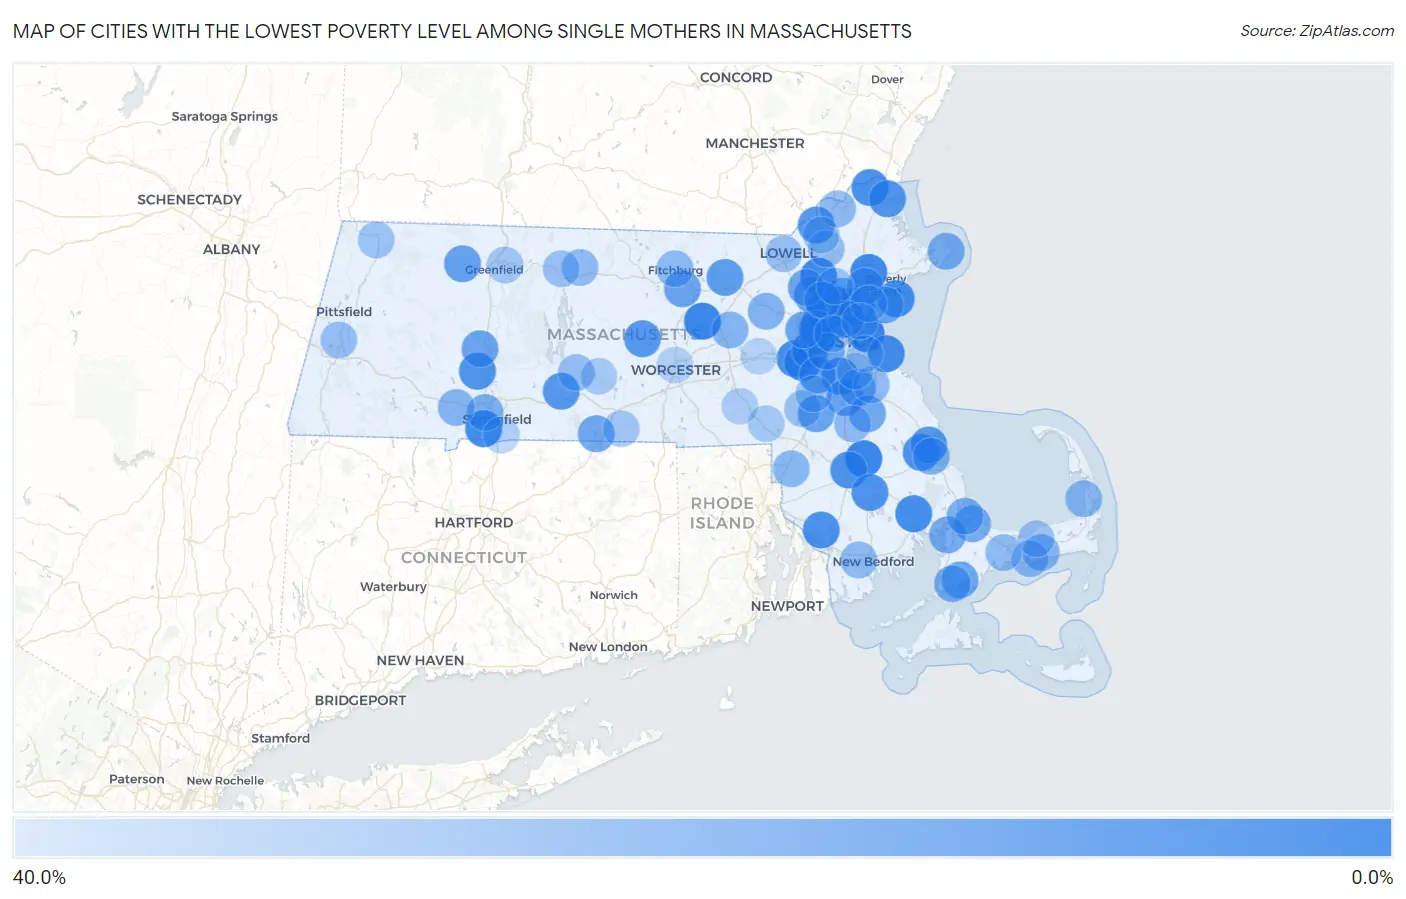
Map of Cities with the Lowest Poverty Level Among Single Mothers in Massachusetts
40.0%
0.0%
Cities with the Lowest Poverty Level Among Single Mothers in Massachusetts
| City | Single Mother Poverty | vs State | vs National | |
| 1. | Winchester | 5.2% | 27.1%(-21.9)#1 | 33.1%(-28.0)#316 |
| 2. | Winthrop Town | 5.2% | 27.1%(-21.9)#2 | 33.1%(-27.9)#322 |
| 3. | Clinton | 5.5% | 27.1%(-21.7)#3 | 33.1%(-27.7)#359 |
| 4. | Bridgewater Town | 5.6% | 27.1%(-21.6)#4 | 33.1%(-27.6)#366 |
| 5. | Danvers | 6.7% | 27.1%(-20.4)#5 | 33.1%(-26.4)#553 |
| 6. | Wilmington | 7.2% | 27.1%(-19.9)#6 | 33.1%(-25.9)#643 |
| 7. | Agawam Town | 7.6% | 27.1%(-19.5)#7 | 33.1%(-25.5)#700 |
| 8. | West Wareham | 7.9% | 27.1%(-19.3)#8 | 33.1%(-25.3)#759 |
| 9. | Wellesley | 7.9% | 27.1%(-19.2)#9 | 33.1%(-25.2)#764 |
| 10. | Hull | 8.5% | 27.1%(-18.6)#10 | 33.1%(-24.7)#883 |
| 11. | Saugus | 8.6% | 27.1%(-18.5)#11 | 33.1%(-24.5)#896 |
| 12. | Marblehead | 8.7% | 27.1%(-18.5)#12 | 33.1%(-24.5)#906 |
| 13. | Needham | 8.7% | 27.1%(-18.4)#13 | 33.1%(-24.4)#933 |
| 14. | Amesbury Town | 9.0% | 27.1%(-18.2)#14 | 33.1%(-24.2)#976 |
| 15. | Milton | 9.3% | 27.1%(-17.9)#15 | 33.1%(-23.9)#1,033 |
| 16. | Stoneham | 9.7% | 27.1%(-17.4)#16 | 33.1%(-23.4)#1,115 |
| 17. | Kingston | 9.8% | 27.1%(-17.4)#17 | 33.1%(-23.4)#1,116 |
| 18. | Somerset | 9.9% | 27.1%(-17.2)#18 | 33.1%(-23.2)#1,140 |
| 19. | Raynham Center | 9.9% | 27.1%(-17.2)#19 | 33.1%(-23.2)#1,144 |
| 20. | Easthampton Town | 10.3% | 27.1%(-16.8)#20 | 33.1%(-22.8)#1,234 |
| 21. | North Lakeville | 10.7% | 27.1%(-16.5)#21 | 33.1%(-22.5)#1,320 |
| 22. | Newton | 10.7% | 27.1%(-16.4)#22 | 33.1%(-22.4)#1,336 |
| 23. | Newburyport | 10.9% | 27.1%(-16.2)#23 | 33.1%(-22.2)#1,371 |
| 24. | Methuen Town | 11.6% | 27.1%(-15.5)#24 | 33.1%(-21.5)#1,532 |
| 25. | Medford | 12.1% | 27.1%(-15.1)#25 | 33.1%(-21.1)#1,634 |
| 26. | Arlington | 12.3% | 27.1%(-14.8)#26 | 33.1%(-20.9)#1,681 |
| 27. | South Duxbury | 12.3% | 27.1%(-14.8)#27 | 33.1%(-20.8)#1,682 |
| 28. | Rutland | 12.3% | 27.1%(-14.8)#28 | 33.1%(-20.8)#1,684 |
| 29. | Palmer Town | 12.4% | 27.1%(-14.7)#29 | 33.1%(-20.7)#1,707 |
| 30. | Ayer | 13.7% | 27.1%(-13.4)#30 | 33.1%(-19.4)#2,032 |
| 31. | Watertown Town | 15.3% | 27.1%(-11.9)#31 | 33.1%(-17.9)#2,390 |
| 32. | Burlington | 15.3% | 27.1%(-11.8)#32 | 33.1%(-17.9)#2,394 |
| 33. | Dedham | 15.5% | 27.1%(-11.7)#33 | 33.1%(-17.7)#2,458 |
| 34. | Belmont | 15.5% | 27.1%(-11.7)#34 | 33.1%(-17.7)#2,460 |
| 35. | Shelburne Falls | 15.9% | 27.1%(-11.2)#35 | 33.1%(-17.3)#2,564 |
| 36. | Randolph Town | 15.9% | 27.1%(-11.2)#36 | 33.1%(-17.2)#2,573 |
| 37. | Melrose | 16.5% | 27.1%(-10.7)#37 | 33.1%(-16.7)#2,685 |
| 38. | Leominster | 16.5% | 27.1%(-10.6)#38 | 33.1%(-16.6)#2,695 |
| 39. | Sharon | 16.7% | 27.1%(-10.5)#39 | 33.1%(-16.5)#2,718 |
| 40. | Northampton | 16.7% | 27.1%(-10.4)#40 | 33.1%(-16.4)#2,817 |
| 41. | Brookline | 16.8% | 27.1%(-10.3)#41 | 33.1%(-16.3)#2,828 |
| 42. | Braintree Town | 17.1% | 27.1%(-10.0)#42 | 33.1%(-16.0)#2,887 |
| 43. | East Falmouth | 17.2% | 27.1%(-9.95)#43 | 33.1%(-16.0)#2,903 |
| 44. | Waltham | 17.3% | 27.1%(-9.82)#44 | 33.1%(-15.8)#2,930 |
| 45. | Wakefield | 17.4% | 27.1%(-9.69)#45 | 33.1%(-15.7)#2,955 |
| 46. | Malden | 17.6% | 27.1%(-9.50)#46 | 33.1%(-15.5)#2,981 |
| 47. | Pinehurst | 17.8% | 27.1%(-9.34)#47 | 33.1%(-15.4)#3,028 |
| 48. | Abington | 18.4% | 27.1%(-8.72)#48 | 33.1%(-14.7)#3,213 |
| 49. | Holland | 18.5% | 27.1%(-8.60)#49 | 33.1%(-14.6)#3,234 |
| 50. | Swampscott | 18.6% | 27.1%(-8.53)#50 | 33.1%(-14.5)#3,251 |
| 51. | Sandwich | 19.5% | 27.1%(-7.58)#51 | 33.1%(-13.6)#3,504 |
| 52. | Monument Beach | 19.6% | 27.1%(-7.56)#52 | 33.1%(-13.6)#3,512 |
| 53. | Woburn | 19.7% | 27.1%(-7.46)#53 | 33.1%(-13.5)#3,527 |
| 54. | Rockport | 19.7% | 27.1%(-7.40)#54 | 33.1%(-13.4)#3,535 |
| 55. | Teaticket | 20.4% | 27.1%(-6.75)#55 | 33.1%(-12.8)#3,757 |
| 56. | Peabody | 20.7% | 27.1%(-6.41)#56 | 33.1%(-12.4)#3,854 |
| 57. | Sagamore | 20.8% | 27.1%(-6.34)#57 | 33.1%(-12.4)#3,868 |
| 58. | North Attleborough | 20.8% | 27.1%(-6.31)#58 | 33.1%(-12.3)#3,875 |
| 59. | Amherst | 20.9% | 27.1%(-6.25)#59 | 33.1%(-12.3)#3,903 |
| 60. | West Springfield Town | 20.9% | 27.1%(-6.20)#60 | 33.1%(-12.2)#3,917 |
| 61. | North Plymouth | 21.5% | 27.1%(-5.60)#61 | 33.1%(-11.6)#4,080 |
| 62. | West Concord | 22.2% | 27.1%(-4.90)#62 | 33.1%(-10.9)#4,248 |
| 63. | South Yarmouth | 23.0% | 27.1%(-4.15)#63 | 33.1%(-10.2)#4,463 |
| 64. | Hudson | 23.0% | 27.1%(-4.14)#64 | 33.1%(-10.2)#4,466 |
| 65. | Westfield | 23.4% | 27.1%(-3.74)#65 | 33.1%(-9.76)#4,581 |
| 66. | North Eastham | 23.9% | 27.1%(-3.21)#66 | 33.1%(-9.22)#4,728 |
| 67. | Attleboro | 24.1% | 27.1%(-3.02)#67 | 33.1%(-9.03)#4,776 |
| 68. | Fitchburg | 24.7% | 27.1%(-2.43)#68 | 33.1%(-8.44)#4,904 |
| 69. | Smith Mills | 24.9% | 27.1%(-2.22)#69 | 33.1%(-8.23)#4,942 |
| 70. | West Yarmouth | 25.2% | 27.1%(-1.96)#70 | 33.1%(-7.97)#5,138 |
| 71. | Brockton | 25.2% | 27.1%(-1.89)#71 | 33.1%(-7.90)#5,154 |
| 72. | Haverhill | 25.3% | 27.1%(-1.83)#72 | 33.1%(-7.85)#5,161 |
| 73. | Athol | 25.4% | 27.1%(-1.73)#73 | 33.1%(-7.74)#5,182 |
| 74. | Barnstable Town | 25.5% | 27.1%(-1.66)#74 | 33.1%(-7.68)#5,196 |
| 75. | Lynn | 25.5% | 27.1%(-1.60)#75 | 33.1%(-7.61)#5,205 |
| 76. | Greenfield | 26.1% | 27.1%(-1.03)#76 | 33.1%(-7.04)#5,363 |
| 77. | Lenox | 26.4% | 27.1%(-0.733)#77 | 33.1%(-6.75)#5,431 |
| 78. | Weymouth Town | 26.5% | 27.1%(-0.574)#78 | 33.1%(-6.59)#5,458 |
| 79. | Andover | 26.5% | 27.1%(-0.574)#79 | 33.1%(-6.59)#5,461 |
| 80. | Ware | 26.7% | 27.1%(-0.469)#80 | 33.1%(-6.48)#5,481 |
| 81. | Lowell | 26.9% | 27.1%(-0.257)#81 | 33.1%(-6.27)#5,556 |
| 82. | Walpole | 27.6% | 27.1%(+0.437)#82 | 33.1%(-5.58)#5,747 |
| 83. | Orange | 27.8% | 27.1%(+0.656)#83 | 33.1%(-5.36)#5,806 |
| 84. | Cambridge | 28.2% | 27.1%(+1.07)#84 | 33.1%(-4.95)#5,942 |
| 85. | Norwood | 28.3% | 27.1%(+1.19)#85 | 33.1%(-4.82)#5,969 |
| 86. | North Adams | 28.3% | 27.1%(+1.20)#86 | 33.1%(-4.82)#5,973 |
| 87. | Yarmouth Port | 28.9% | 27.1%(+1.77)#87 | 33.1%(-4.25)#6,166 |
| 88. | Turners Falls | 29.5% | 27.1%(+2.41)#88 | 33.1%(-3.61)#6,323 |
| 89. | Southbridge Town | 29.6% | 27.1%(+2.48)#89 | 33.1%(-3.54)#6,341 |
| 90. | Reading | 29.6% | 27.1%(+2.49)#90 | 33.1%(-3.52)#6,344 |
| 91. | Lawrence | 29.6% | 27.1%(+2.51)#91 | 33.1%(-3.50)#6,360 |
| 92. | Quincy | 30.0% | 27.1%(+2.85)#92 | 33.1%(-3.17)#6,439 |
| 93. | Franklin Town | 30.3% | 27.1%(+3.17)#93 | 33.1%(-2.84)#6,556 |
| 94. | West Brookfield | 30.4% | 27.1%(+3.23)#94 | 33.1%(-2.78)#6,572 |
| 95. | Milford | 31.8% | 27.1%(+4.71)#95 | 33.1%(-1.30)#6,964 |
| 96. | Longmeadow | 32.9% | 27.1%(+5.81)#96 | 33.1%(-0.199)#7,222 |
| 97. | Worcester | 33.6% | 27.1%(+6.48)#97 | 33.1%(+0.463)#7,612 |
| 98. | Framingham | 33.7% | 27.1%(+6.54)#98 | 33.1%(+0.523)#7,626 |
| 99. | Boston | 33.8% | 27.1%(+6.70)#99 | 33.1%(+0.688)#7,656 |
| 100. | Revere | 34.4% | 27.1%(+7.25)#100 | 33.1%(+1.24)#7,769 |
Common Questions
What are the Top 10 Cities with the Lowest Poverty Level Among Single Mothers in Massachusetts?
Top 10 Cities with the Lowest Poverty Level Among Single Mothers in Massachusetts are:
#1
5.2%
#2
5.2%
#3
5.5%
#4
5.6%
#5
6.7%
#6
7.2%
#7
7.6%
#8
7.9%
#9
7.9%
#10
8.5%
What city has the Lowest Poverty Level Among Single Mothers in Massachusetts?
Winchester has the Lowest Poverty Level Among Single Mothers in Massachusetts with 5.2%.
What is the Poverty Level Among Single Mothers in the State of Massachusetts?
Poverty Level Among Single Mothers in Massachusetts is 27.1%.
What is the Poverty Level Among Single Mothers in the United States?
Poverty Level Among Single Mothers in the United States is 33.1%.