Cities with the Lowest Female Poverty Level in Oklahoma
RELATED REPORTS & OPTIONS
Lowest Poverty | Female
Oklahoma
Compare Cities
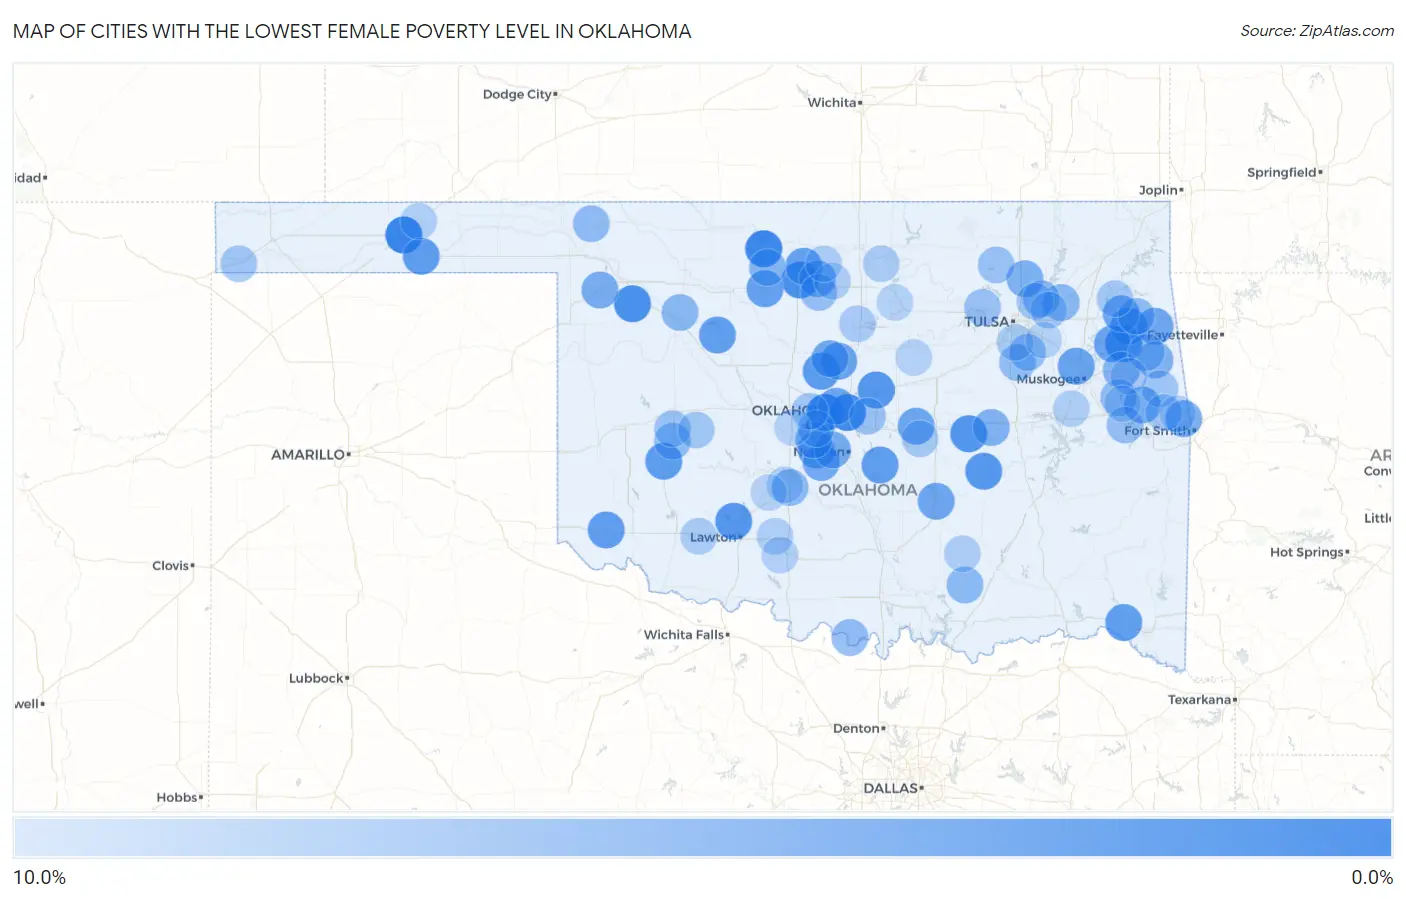
Map of Cities with the Lowest Female Poverty Level in Oklahoma
10.0%
0.0%
Cities with the Lowest Female Poverty Level in Oklahoma
| City | Female Poverty | vs State | vs National | |
| 1. | Optima | 0.95% | 16.5%(-15.5)#1 | 13.7%(-12.7)#231 |
| 2. | Woodlawn Park | 1.1% | 16.5%(-15.3)#2 | 13.7%(-12.5)#327 |
| 3. | Jet | 1.4% | 16.5%(-15.1)#3 | 13.7%(-12.3)#476 |
| 4. | Forest Park | 1.7% | 16.5%(-14.8)#4 | 13.7%(-12.0)#671 |
| 5. | Pickett | 1.9% | 16.5%(-14.6)#5 | 13.7%(-11.8)#802 |
| 6. | North Enid | 2.2% | 16.5%(-14.3)#6 | 13.7%(-11.5)#1,066 |
| 7. | Sharon | 2.3% | 16.5%(-14.2)#7 | 13.7%(-11.4)#1,103 |
| 8. | Gideon | 2.3% | 16.5%(-14.2)#8 | 13.7%(-11.4)#1,164 |
| 9. | Bearden | 2.9% | 16.5%(-13.6)#9 | 13.7%(-10.8)#1,664 |
| 10. | Medicine Park | 2.9% | 16.5%(-13.6)#10 | 13.7%(-10.8)#1,719 |
| 11. | Luther | 3.0% | 16.5%(-13.5)#11 | 13.7%(-10.7)#1,786 |
| 12. | Horntown | 3.0% | 16.5%(-13.5)#12 | 13.7%(-10.7)#1,844 |
| 13. | Cashion | 3.2% | 16.5%(-13.3)#13 | 13.7%(-10.5)#1,965 |
| 14. | Cookson | 3.2% | 16.5%(-13.2)#14 | 13.7%(-10.5)#2,064 |
| 15. | Rocky | 3.5% | 16.5%(-13.0)#15 | 13.7%(-10.2)#2,309 |
| 16. | Teresita | 3.6% | 16.5%(-12.9)#16 | 13.7%(-10.1)#2,418 |
| 17. | Etowah | 3.6% | 16.5%(-12.9)#17 | 13.7%(-10.1)#2,505 |
| 18. | East Duke | 3.7% | 16.5%(-12.8)#18 | 13.7%(-10.0)#2,524 |
| 19. | Hardesty | 3.7% | 16.5%(-12.8)#19 | 13.7%(-10.0)#2,530 |
| 20. | Canton | 3.7% | 16.5%(-12.8)#20 | 13.7%(-9.96)#2,607 |
| 21. | Millerton | 3.8% | 16.5%(-12.7)#21 | 13.7%(-9.85)#2,714 |
| 22. | Kremlin | 3.9% | 16.5%(-12.6)#22 | 13.7%(-9.75)#2,818 |
| 23. | Meno | 4.0% | 16.5%(-12.5)#23 | 13.7%(-9.74)#2,833 |
| 24. | Middleberg | 4.0% | 16.5%(-12.5)#24 | 13.7%(-9.70)#2,898 |
| 25. | Taylor Ferry | 4.2% | 16.5%(-12.3)#25 | 13.7%(-9.48)#3,145 |
| 26. | Tullahassee | 4.2% | 16.5%(-12.3)#26 | 13.7%(-9.47)#3,156 |
| 27. | Lost City | 4.3% | 16.5%(-12.2)#27 | 13.7%(-9.37)#3,281 |
| 28. | Bridge Creek | 4.3% | 16.5%(-12.2)#28 | 13.7%(-9.37)#3,282 |
| 29. | Cedar Valley | 4.4% | 16.5%(-12.1)#29 | 13.7%(-9.34)#3,341 |
| 30. | Johnson | 4.5% | 16.5%(-12.0)#30 | 13.7%(-9.20)#3,494 |
| 31. | Cimarron City | 4.6% | 16.5%(-11.9)#31 | 13.7%(-9.10)#3,617 |
| 32. | Byng | 4.6% | 16.5%(-11.9)#32 | 13.7%(-9.07)#3,661 |
| 33. | Chewey | 4.7% | 16.5%(-11.8)#33 | 13.7%(-8.98)#3,752 |
| 34. | Rose | 4.8% | 16.5%(-11.7)#34 | 13.7%(-8.94)#3,795 |
| 35. | Nichols Hills | 4.8% | 16.5%(-11.7)#35 | 13.7%(-8.91)#3,836 |
| 36. | Blanchard | 4.9% | 16.5%(-11.6)#36 | 13.7%(-8.77)#4,007 |
| 37. | Dwight Mission | 5.0% | 16.5%(-11.5)#37 | 13.7%(-8.70)#4,096 |
| 38. | Remy | 5.1% | 16.5%(-11.4)#38 | 13.7%(-8.61)#4,196 |
| 39. | Newcastle | 5.2% | 16.5%(-11.3)#39 | 13.7%(-8.53)#4,300 |
| 40. | Fargo | 5.2% | 16.5%(-11.3)#40 | 13.7%(-8.46)#4,360 |
| 41. | Ingalls | 5.3% | 16.5%(-11.2)#41 | 13.7%(-8.44)#4,402 |
| 42. | Breckenridge | 5.3% | 16.5%(-11.2)#42 | 13.7%(-8.37)#4,505 |
| 43. | Vera | 5.7% | 16.5%(-10.8)#43 | 13.7%(-8.01)#4,933 |
| 44. | Tuttle | 5.9% | 16.5%(-10.6)#44 | 13.7%(-7.84)#5,159 |
| 45. | Titanic | 5.9% | 16.5%(-10.6)#45 | 13.7%(-7.82)#5,187 |
| 46. | Clearview | 5.9% | 16.5%(-10.6)#46 | 13.7%(-7.82)#5,208 |
| 47. | Goltry | 6.2% | 16.5%(-10.3)#47 | 13.7%(-7.50)#5,597 |
| 48. | Zeb | 6.4% | 16.5%(-10.1)#48 | 13.7%(-7.32)#5,807 |
| 49. | Justice | 6.5% | 16.5%(-10.00)#49 | 13.7%(-7.20)#5,963 |
| 50. | Chester | 6.5% | 16.5%(-9.98)#50 | 13.7%(-7.18)#5,997 |
| 51. | Coleman | 6.6% | 16.5%(-9.88)#51 | 13.7%(-7.08)#6,115 |
| 52. | Ninnekah | 6.7% | 16.5%(-9.83)#52 | 13.7%(-7.03)#6,166 |
| 53. | Limestone | 6.7% | 16.5%(-9.81)#53 | 13.7%(-7.01)#6,213 |
| 54. | Welty | 6.9% | 16.5%(-9.60)#54 | 13.7%(-6.80)#6,468 |
| 55. | Leon | 7.0% | 16.5%(-9.52)#55 | 13.7%(-6.72)#6,574 |
| 56. | Buffalo | 7.0% | 16.5%(-9.49)#56 | 13.7%(-6.69)#6,614 |
| 57. | Paradise Hill | 7.0% | 16.5%(-9.48)#57 | 13.7%(-6.68)#6,627 |
| 58. | New Cordell | 7.1% | 16.5%(-9.44)#58 | 13.7%(-6.64)#6,679 |
| 59. | Leach | 7.1% | 16.5%(-9.36)#59 | 13.7%(-6.56)#6,765 |
| 60. | Liberty | 7.1% | 16.5%(-9.36)#60 | 13.7%(-6.56)#6,771 |
| 61. | Bixby | 7.2% | 16.5%(-9.28)#61 | 13.7%(-6.48)#6,873 |
| 62. | Fairmont | 7.4% | 16.5%(-9.15)#62 | 13.7%(-6.35)#7,022 |
| 63. | Mustang | 7.4% | 16.5%(-9.12)#63 | 13.7%(-6.32)#7,048 |
| 64. | Eldon | 7.4% | 16.5%(-9.09)#64 | 13.7%(-6.29)#7,076 |
| 65. | Tamaha | 7.4% | 16.5%(-9.06)#65 | 13.7%(-6.26)#7,106 |
| 66. | Prue | 7.6% | 16.5%(-8.92)#66 | 13.7%(-6.12)#7,266 |
| 67. | Choctaw | 7.6% | 16.5%(-8.85)#67 | 13.7%(-6.05)#7,318 |
| 68. | Barnsdall | 7.7% | 16.5%(-8.82)#68 | 13.7%(-6.02)#7,355 |
| 69. | Bessie | 7.8% | 16.5%(-8.73)#69 | 13.7%(-5.93)#7,489 |
| 70. | Owasso | 7.8% | 16.5%(-8.67)#70 | 13.7%(-5.87)#7,566 |
| 71. | Verdigris | 8.1% | 16.5%(-8.44)#71 | 13.7%(-5.64)#7,842 |
| 72. | Yukon | 8.1% | 16.5%(-8.41)#72 | 13.7%(-5.61)#7,865 |
| 73. | Greasy | 8.1% | 16.5%(-8.39)#73 | 13.7%(-5.59)#7,901 |
| 74. | Felt | 8.2% | 16.5%(-8.34)#74 | 13.7%(-5.54)#7,977 |
| 75. | Corn | 8.3% | 16.5%(-8.24)#75 | 13.7%(-5.44)#8,087 |
| 76. | Akins | 8.3% | 16.5%(-8.22)#76 | 13.7%(-5.42)#8,114 |
| 77. | Nashoba | 8.3% | 16.5%(-8.17)#77 | 13.7%(-5.37)#8,205 |
| 78. | Wickliffe | 8.4% | 16.5%(-8.15)#78 | 13.7%(-5.35)#8,222 |
| 79. | Earlsboro | 8.5% | 16.5%(-8.00)#79 | 13.7%(-5.20)#8,363 |
| 80. | Orlando | 8.7% | 16.5%(-7.80)#80 | 13.7%(-5.00)#8,602 |
| 81. | Pettit | 8.7% | 16.5%(-7.77)#81 | 13.7%(-4.97)#8,626 |
| 82. | Jenks | 8.8% | 16.5%(-7.71)#82 | 13.7%(-4.91)#8,696 |
| 83. | Indiahoma | 8.8% | 16.5%(-7.69)#83 | 13.7%(-4.89)#8,719 |
| 84. | Marland | 8.9% | 16.5%(-7.62)#84 | 13.7%(-4.82)#8,819 |
| 85. | Garber | 8.9% | 16.5%(-7.56)#85 | 13.7%(-4.76)#8,894 |
| 86. | Central High | 9.0% | 16.5%(-7.53)#86 | 13.7%(-4.73)#8,920 |
| 87. | Clarita | 9.0% | 16.5%(-7.49)#87 | 13.7%(-4.69)#8,971 |
| 88. | Hunter | 9.1% | 16.5%(-7.41)#88 | 13.7%(-4.61)#9,075 |
| 89. | Rentiesville | 9.1% | 16.5%(-7.41)#89 | 13.7%(-4.61)#9,078 |
| 90. | Peckham | 9.1% | 16.5%(-7.41)#90 | 13.7%(-4.61)#9,086 |
| 91. | Hooker | 9.1% | 16.5%(-7.40)#91 | 13.7%(-4.60)#9,092 |
| 92. | Long | 9.2% | 16.5%(-7.30)#92 | 13.7%(-4.50)#9,193 |
| 93. | Empire City | 9.3% | 16.5%(-7.21)#93 | 13.7%(-4.41)#9,304 |
| 94. | Redbird Smith | 9.3% | 16.5%(-7.20)#94 | 13.7%(-4.40)#9,313 |
| 95. | Norge | 9.3% | 16.5%(-7.20)#95 | 13.7%(-4.40)#9,321 |
| 96. | Agra | 9.3% | 16.5%(-7.17)#96 | 13.7%(-4.37)#9,360 |
| 97. | Morrison | 9.3% | 16.5%(-7.16)#97 | 13.7%(-4.36)#9,373 |
| 98. | Broken Arrow | 9.4% | 16.5%(-7.05)#98 | 13.7%(-4.25)#9,515 |
| 99. | Union City | 9.5% | 16.5%(-6.98)#99 | 13.7%(-4.18)#9,595 |
| 100. | Cement | 9.5% | 16.5%(-6.98)#100 | 13.7%(-4.18)#9,606 |
Common Questions
What are the Top 10 Cities with the Lowest Female Poverty Level in Oklahoma?
Top 10 Cities with the Lowest Female Poverty Level in Oklahoma are:
#1
0.95%
#2
1.1%
#3
1.4%
#4
1.7%
#5
2.2%
#6
2.3%
#7
2.3%
#8
2.9%
#9
2.9%
#10
3.0%
What city has the Lowest Female Poverty Level in Oklahoma?
Optima has the Lowest Female Poverty Level in Oklahoma with 0.95%.
What is the Poverty Level Among Females in the State of Oklahoma?
Poverty Level Among Females in Oklahoma is 16.5%.
What is the Poverty Level Among Females in the United States?
Poverty Level Among Females in the United States is 13.7%.