Cities with the Largest West Indian Community in Georgia
RELATED REPORTS & OPTIONS
West Indian
Georgia
Compare Cities
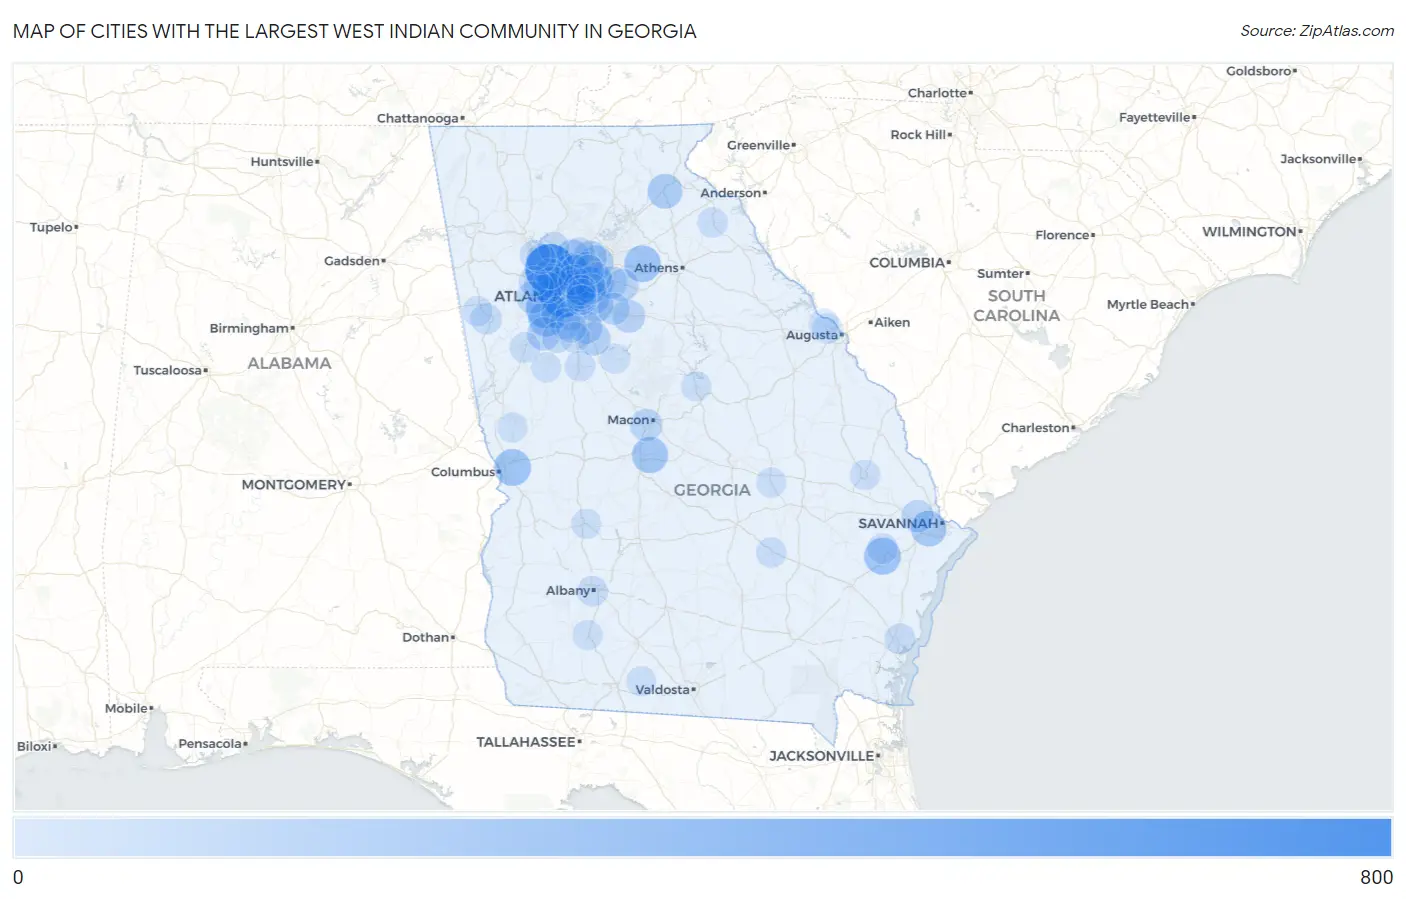
Map of Cities with the Largest West Indian Community in Georgia
0
800
Cities with the Largest West Indian Community in Georgia
| City | West Indian | vs State | vs National | |
| 1. | Marietta | 771 | 13,386(5.76%)#1 | 267,308(0.29%)#22 |
| 2. | Atlanta | 681 | 13,386(5.09%)#2 | 267,308(0.25%)#26 |
| 3. | South Fulton | 317 | 13,386(2.37%)#3 | 267,308(0.12%)#95 |
| 4. | Columbus | 262 | 13,386(1.96%)#4 | 267,308(0.10%)#118 |
| 5. | Hinesville | 261 | 13,386(1.95%)#5 | 267,308(0.10%)#120 |
| 6. | Winder | 252 | 13,386(1.88%)#6 | 267,308(0.09%)#126 |
| 7. | Warner Robins | 233 | 13,386(1.74%)#7 | 267,308(0.09%)#137 |
| 8. | Union City | 215 | 13,386(1.61%)#8 | 267,308(0.08%)#152 |
| 9. | Augusta-Richmond County Consolidated Government (Balance) | 204 | 13,386(1.52%)#9 | 267,308(0.08%)#163 |
| 10. | Savannah | 203 | 13,386(1.52%)#10 | 267,308(0.08%)#164 |
| 11. | Cornelia | 179 | 13,386(1.34%)#11 | 267,308(0.07%)#190 |
| 12. | Mountain Park | 175 | 13,386(1.31%)#12 | 267,308(0.07%)#196 |
| 13. | Stonecrest | 158 | 13,386(1.18%)#13 | 267,308(0.06%)#213 |
| 14. | Duluth | 158 | 13,386(1.18%)#14 | 267,308(0.06%)#214 |
| 15. | Redan | 147 | 13,386(1.10%)#15 | 267,308(0.05%)#228 |
| 16. | North Decatur | 133 | 13,386(0.99%)#16 | 267,308(0.05%)#256 |
| 17. | Johns Creek | 132 | 13,386(0.99%)#17 | 267,308(0.05%)#257 |
| 18. | Mcdonough | 129 | 13,386(0.96%)#18 | 267,308(0.05%)#267 |
| 19. | Roswell | 128 | 13,386(0.96%)#19 | 267,308(0.05%)#270 |
| 20. | Sandy Springs | 123 | 13,386(0.92%)#20 | 267,308(0.05%)#284 |
| 21. | Tyrone | 120 | 13,386(0.90%)#21 | 267,308(0.04%)#289 |
| 22. | North Druid Hills | 119 | 13,386(0.89%)#22 | 267,308(0.04%)#291 |
| 23. | Covington | 110 | 13,386(0.82%)#23 | 267,308(0.04%)#320 |
| 24. | Stockbridge | 99 | 13,386(0.74%)#24 | 267,308(0.04%)#357 |
| 25. | Snellville | 96 | 13,386(0.72%)#25 | 267,308(0.04%)#367 |
| 26. | Macon Bibb County | 94 | 13,386(0.70%)#26 | 267,308(0.04%)#371 |
| 27. | Bloomingdale | 94 | 13,386(0.70%)#27 | 267,308(0.04%)#375 |
| 28. | Tucker | 91 | 13,386(0.68%)#28 | 267,308(0.03%)#387 |
| 29. | Loganville | 91 | 13,386(0.68%)#29 | 267,308(0.03%)#388 |
| 30. | Athens-Clarke County Unified Government (Balance) | 83 | 13,386(0.62%)#30 | 267,308(0.03%)#419 |
| 31. | Smyrna | 81 | 13,386(0.61%)#31 | 267,308(0.03%)#427 |
| 32. | College Park | 75 | 13,386(0.56%)#32 | 267,308(0.03%)#450 |
| 33. | Conyers | 74 | 13,386(0.55%)#33 | 267,308(0.03%)#459 |
| 34. | Douglasville | 73 | 13,386(0.55%)#34 | 267,308(0.03%)#462 |
| 35. | Mableton | 51 | 13,386(0.38%)#35 | 267,308(0.02%)#618 |
| 36. | Belvedere Park | 44 | 13,386(0.33%)#36 | 267,308(0.02%)#686 |
| 37. | Carrollton | 42 | 13,386(0.31%)#37 | 267,308(0.02%)#708 |
| 38. | Peachtree Corners | 39 | 13,386(0.29%)#38 | 267,308(0.01%)#745 |
| 39. | Forest Park | 37 | 13,386(0.28%)#39 | 267,308(0.01%)#774 |
| 40. | Woodstock | 35 | 13,386(0.26%)#40 | 267,308(0.01%)#808 |
| 41. | Riverdale | 35 | 13,386(0.26%)#41 | 267,308(0.01%)#812 |
| 42. | Dunwoody | 31 | 13,386(0.23%)#42 | 267,308(0.01%)#871 |
| 43. | Lilburn | 29 | 13,386(0.22%)#43 | 267,308(0.01%)#926 |
| 44. | Fayetteville | 28 | 13,386(0.21%)#44 | 267,308(0.01%)#944 |
| 45. | Fair Oaks | 28 | 13,386(0.21%)#45 | 267,308(0.01%)#946 |
| 46. | Austell | 28 | 13,386(0.21%)#46 | 267,308(0.01%)#947 |
| 47. | Albany | 26 | 13,386(0.19%)#47 | 267,308(0.01%)#987 |
| 48. | Newnan | 25 | 13,386(0.19%)#48 | 267,308(0.01%)#1,010 |
| 49. | Lovejoy | 23 | 13,386(0.17%)#49 | 267,308(0.01%)#1,080 |
| 50. | Country Club Estates | 22 | 13,386(0.16%)#50 | 267,308(0.01%)#1,113 |
| 51. | Griffin | 20 | 13,386(0.15%)#51 | 267,308(0.01%)#1,166 |
| 52. | Hazlehurst | 20 | 13,386(0.15%)#52 | 267,308(0.01%)#1,179 |
| 53. | Fairplay | 19 | 13,386(0.14%)#53 | 267,308(0.01%)#1,228 |
| 54. | Fort Stewart | 18 | 13,386(0.13%)#54 | 267,308(0.01%)#1,259 |
| 55. | Brookhaven | 16 | 13,386(0.12%)#55 | 267,308(0.01%)#1,312 |
| 56. | Stone Mountain | 16 | 13,386(0.12%)#56 | 267,308(0.01%)#1,326 |
| 57. | Alpharetta | 15 | 13,386(0.11%)#57 | 267,308(0.01%)#1,339 |
| 58. | Powder Springs | 13 | 13,386(0.10%)#58 | 267,308(0.00%)#1,426 |
| 59. | Royston | 12 | 13,386(0.09%)#59 | 267,308(0.00%)#1,494 |
| 60. | Acworth | 10 | 13,386(0.07%)#60 | 267,308(0.00%)#1,564 |
| 61. | Norcross | 10 | 13,386(0.07%)#61 | 267,308(0.00%)#1,569 |
| 62. | Scottdale | 10 | 13,386(0.07%)#62 | 267,308(0.00%)#1,578 |
| 63. | Jonesboro | 10 | 13,386(0.07%)#63 | 267,308(0.00%)#1,589 |
| 64. | Statesboro | 9 | 13,386(0.07%)#64 | 267,308(0.00%)#1,612 |
| 65. | Martinez | 8 | 13,386(0.06%)#65 | 267,308(0.00%)#1,675 |
| 66. | Kennesaw | 8 | 13,386(0.06%)#66 | 267,308(0.00%)#1,676 |
| 67. | Candler Mcafee | 8 | 13,386(0.06%)#67 | 267,308(0.00%)#1,682 |
| 68. | Milledgeville | 7 | 13,386(0.05%)#68 | 267,308(0.00%)#1,740 |
| 69. | Jackson | 7 | 13,386(0.05%)#69 | 267,308(0.00%)#1,757 |
| 70. | Mount Zion | 7 | 13,386(0.05%)#70 | 267,308(0.00%)#1,771 |
| 71. | Evans | 6 | 13,386(0.04%)#71 | 267,308(0.00%)#1,791 |
| 72. | Avondale Estates | 5 | 13,386(0.04%)#72 | 267,308(0.00%)#1,880 |
| 73. | Soperton | 5 | 13,386(0.04%)#73 | 267,308(0.00%)#1,883 |
| 74. | Americus | 3 | 13,386(0.02%)#74 | 267,308(0.00%)#1,949 |
| 75. | Camilla | 3 | 13,386(0.02%)#75 | 267,308(0.00%)#1,962 |
| 76. | Barwick | 3 | 13,386(0.02%)#76 | 267,308(0.00%)#1,985 |
| 77. | Hamilton | 1 | 13,386(0.01%)#77 | 267,308(0.00%)#2,059 |
| 78. | Haralson | 1 | 13,386(0.01%)#78 | 267,308(0.00%)#2,068 |
Common Questions
What are the Top 10 Cities with the Largest West Indian Community in Georgia?
Top 10 Cities with the Largest West Indian Community in Georgia are:
#1
771
#2
681
#3
317
#4
262
#5
261
#6
252
#7
233
#8
215
#9
203
#10
179
What city has the Largest West Indian Community in Georgia?
Marietta has the Largest West Indian Community in Georgia with 771.
What is the Total West Indian Population in the State of Georgia?
Total West Indian Population in Georgia is 13,386.
What is the Total West Indian Population in the United States?
Total West Indian Population in the United States is 267,308.