Cities with the Largest West Indian Community in the United States
RELATED REPORTS & OPTIONS
West Indian
United States
Compare Cities
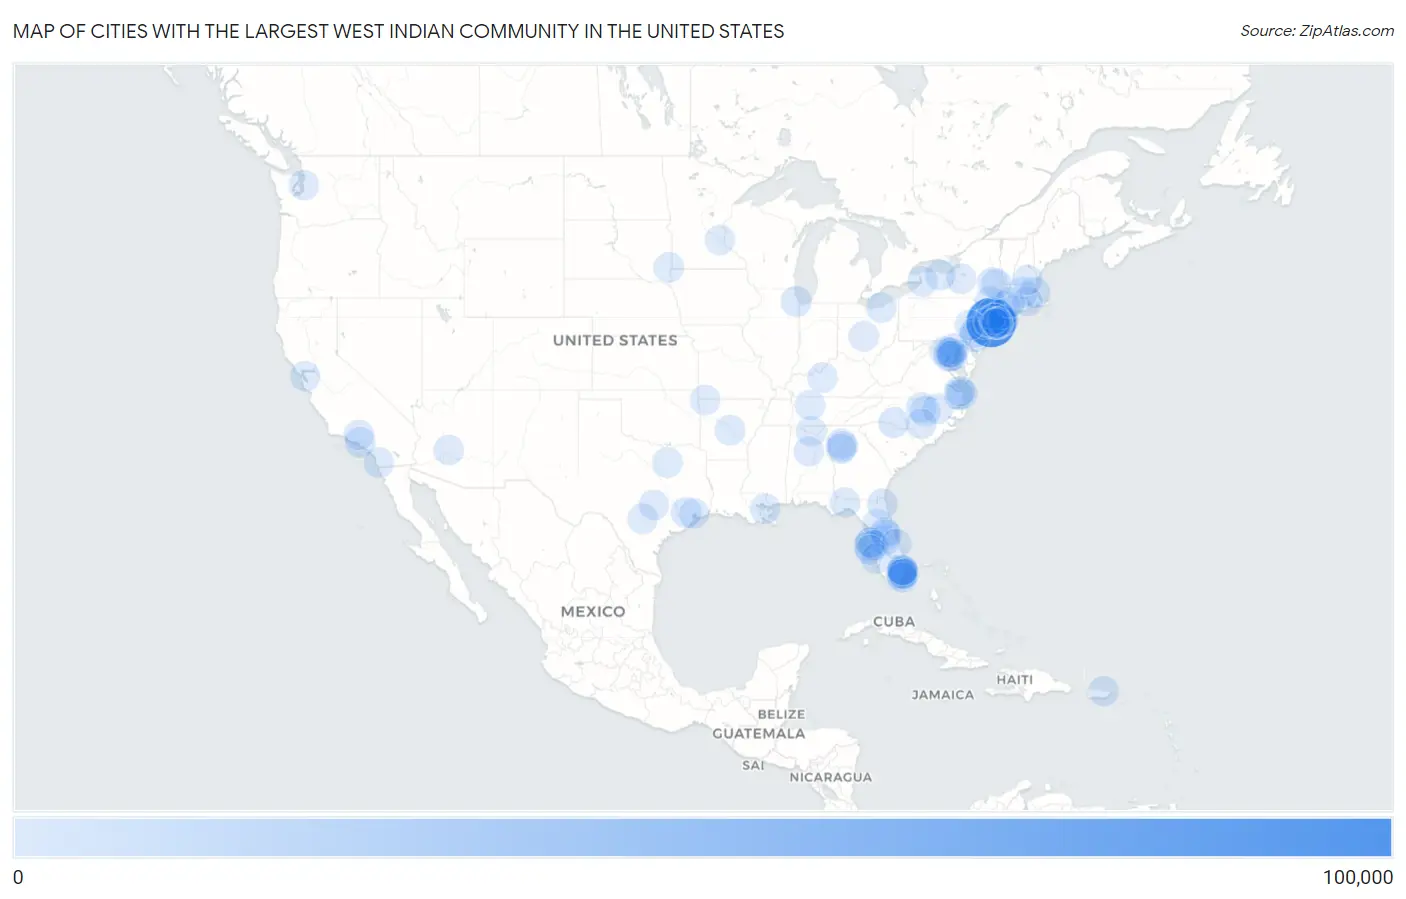
Map of Cities with the Largest West Indian Community in the United States
0
100,000
Cities with the Largest West Indian Community in the United States
| City | West Indian | vs State | vs National | |
| 1. | New York | 81,226 | 100,842(80.55%)#1 | 267,308(30.39%)#1 |
| 2. | Philadelphia | 4,818 | 10,676(45.13%)#1 | 267,308(1.80%)#2 |
| 3. | Boston | 1,926 | 6,718(28.67%)#1 | 267,308(0.72%)#3 |
| 4. | Chicago | 1,909 | 3,326(57.40%)#1 | 267,308(0.71%)#4 |
| 5. | Mount Vernon | 1,850 | 100,842(1.83%)#2 | 267,308(0.69%)#5 |
| 6. | Houston | 1,612 | 11,580(13.92%)#1 | 267,308(0.60%)#6 |
| 7. | Charlotte | 1,587 | 7,634(20.79%)#1 | 267,308(0.59%)#7 |
| 8. | Washington | 1,501 | 1,501(100.00%)#1 | 267,308(0.56%)#8 |
| 9. | Los Angeles | 1,440 | 9,156(15.73%)#1 | 267,308(0.54%)#9 |
| 10. | Baltimore | 1,391 | 10,755(12.93%)#1 | 267,308(0.52%)#10 |
| 11. | Waterbury | 1,234 | 5,114(24.13%)#1 | 267,308(0.46%)#11 |
| 12. | Virginia Beach | 1,115 | 6,773(16.46%)#1 | 267,308(0.42%)#12 |
| 13. | Jacksonville | 1,108 | 34,477(3.21%)#1 | 267,308(0.41%)#13 |
| 14. | Fort Lauderdale | 969 | 34,477(2.81%)#2 | 267,308(0.36%)#14 |
| 15. | San Juan | 908 | 3,595(25.26%)#1 | 267,308(0.34%)#15 |
| 16. | Dallas | 853 | 11,580(7.37%)#2 | 267,308(0.32%)#16 |
| 17. | Pembroke Pines | 843 | 34,477(2.45%)#3 | 267,308(0.32%)#17 |
| 18. | Phoenix | 840 | 2,122(39.59%)#1 | 267,308(0.31%)#18 |
| 19. | Baldwin | 816 | 100,842(0.81%)#3 | 267,308(0.31%)#19 |
| 20. | Columbus | 801 | 3,179(25.20%)#1 | 267,308(0.30%)#20 |
| 21. | Miramar | 777 | 34,477(2.25%)#4 | 267,308(0.29%)#21 |
| 22. | Marietta | 771 | 13,386(5.76%)#1 | 267,308(0.29%)#22 |
| 23. | Baytown | 769 | 11,580(6.64%)#3 | 267,308(0.29%)#23 |
| 24. | Newark | 758 | 14,042(5.40%)#1 | 267,308(0.28%)#24 |
| 25. | Yonkers | 710 | 100,842(0.70%)#4 | 267,308(0.27%)#25 |
| 26. | Atlanta | 681 | 13,386(5.09%)#2 | 267,308(0.25%)#26 |
| 27. | Schenectady | 680 | 100,842(0.67%)#5 | 267,308(0.25%)#27 |
| 28. | Tampa | 669 | 34,477(1.94%)#5 | 267,308(0.25%)#28 |
| 29. | Tallahassee | 663 | 34,477(1.92%)#6 | 267,308(0.25%)#29 |
| 30. | New Orleans | 648 | 1,922(33.71%)#1 | 267,308(0.24%)#30 |
| 31. | Sunrise | 641 | 34,477(1.86%)#7 | 267,308(0.24%)#31 |
| 32. | Jersey City | 618 | 14,042(4.40%)#2 | 267,308(0.23%)#32 |
| 33. | Germantown | 601 | 10,755(5.59%)#2 | 267,308(0.22%)#33 |
| 34. | Seattle | 600 | 1,977(30.35%)#1 | 267,308(0.22%)#34 |
| 35. | Rochester | 596 | 100,842(0.59%)#6 | 267,308(0.22%)#35 |
| 36. | Poinciana | 588 | 34,477(1.71%)#8 | 267,308(0.22%)#36 |
| 37. | St Petersburg | 574 | 34,477(1.66%)#9 | 267,308(0.21%)#37 |
| 38. | Orlando | 546 | 34,477(1.58%)#10 | 267,308(0.20%)#38 |
| 39. | Hollywood | 532 | 34,477(1.54%)#11 | 267,308(0.20%)#39 |
| 40. | Tillson | 530 | 100,842(0.53%)#7 | 267,308(0.20%)#40 |
| 41. | Plainfield | 520 | 14,042(3.70%)#3 | 267,308(0.19%)#41 |
| 42. | Horsham | 517 | 10,676(4.84%)#2 | 267,308(0.19%)#42 |
| 43. | Raleigh | 503 | 7,634(6.59%)#2 | 267,308(0.19%)#43 |
| 44. | East Orange | 502 | 14,042(3.57%)#4 | 267,308(0.19%)#44 |
| 45. | Pine Hills | 499 | 34,477(1.45%)#12 | 267,308(0.19%)#45 |
| 46. | Huntsville | 492 | 1,999(24.61%)#1 | 267,308(0.18%)#46 |
| 47. | Freeport | 484 | 100,842(0.48%)#8 | 267,308(0.18%)#47 |
| 48. | Egypt Lake Leto | 476 | 34,477(1.38%)#13 | 267,308(0.18%)#48 |
| 49. | Nashville | 473 | 1,437(32.92%)#1 | 267,308(0.18%)#49 |
| 50. | San Antonio | 470 | 11,580(4.06%)#4 | 267,308(0.18%)#50 |
| 51. | Margate | 460 | 34,477(1.33%)#14 | 267,308(0.17%)#51 |
| 52. | Centereach | 460 | 100,842(0.46%)#9 | 267,308(0.17%)#52 |
| 53. | Austin | 447 | 11,580(3.86%)#5 | 267,308(0.17%)#53 |
| 54. | Haverstraw | 443 | 100,842(0.44%)#10 | 267,308(0.17%)#54 |
| 55. | San Diego | 440 | 9,156(4.81%)#2 | 267,308(0.16%)#55 |
| 56. | Durham | 435 | 7,634(5.70%)#3 | 267,308(0.16%)#56 |
| 57. | Port Charlotte | 435 | 34,477(1.26%)#15 | 267,308(0.16%)#57 |
| 58. | Worcester | 431 | 6,718(6.42%)#2 | 267,308(0.16%)#58 |
| 59. | Silver Springs Shores | 431 | 34,477(1.25%)#16 | 267,308(0.16%)#59 |
| 60. | Allentown | 426 | 10,676(3.99%)#3 | 267,308(0.16%)#60 |
| 61. | Sioux Falls | 423 | 484(87.40%)#1 | 267,308(0.16%)#61 |
| 62. | Oakland | 410 | 9,156(4.48%)#3 | 267,308(0.15%)#62 |
| 63. | Riverview | 406 | 34,477(1.18%)#17 | 267,308(0.15%)#63 |
| 64. | Santa Clarita | 402 | 9,156(4.39%)#4 | 267,308(0.15%)#64 |
| 65. | Rocky Mount | 399 | 7,634(5.23%)#4 | 267,308(0.15%)#65 |
| 66. | Bridgeport | 398 | 5,114(7.78%)#2 | 267,308(0.15%)#66 |
| 67. | Sayreville Borough | 398 | 14,042(2.83%)#5 | 267,308(0.15%)#67 |
| 68. | Elizabethtown | 396 | 705(56.17%)#1 | 267,308(0.15%)#68 |
| 69. | New Rochelle | 392 | 100,842(0.39%)#11 | 267,308(0.15%)#69 |
| 70. | Providence | 391 | 753(51.93%)#1 | 267,308(0.15%)#70 |
| 71. | Bowie | 389 | 10,755(3.62%)#3 | 267,308(0.15%)#71 |
| 72. | Chesapeake | 375 | 6,773(5.54%)#2 | 267,308(0.14%)#72 |
| 73. | Central Islip | 370 | 100,842(0.37%)#12 | 267,308(0.14%)#73 |
| 74. | Tamarac | 367 | 34,477(1.06%)#18 | 267,308(0.14%)#74 |
| 75. | Miami | 365 | 34,477(1.06%)#19 | 267,308(0.14%)#75 |
| 76. | Buffalo | 362 | 100,842(0.36%)#13 | 267,308(0.14%)#76 |
| 77. | Hempstead | 362 | 100,842(0.36%)#14 | 267,308(0.14%)#77 |
| 78. | Memphis | 359 | 34,477(1.04%)#20 | 267,308(0.13%)#78 |
| 79. | Hartford | 355 | 5,114(6.94%)#3 | 267,308(0.13%)#79 |
| 80. | Pea Ridge | 354 | 918(38.56%)#1 | 267,308(0.13%)#80 |
| 81. | Fairland | 353 | 10,755(3.28%)#4 | 267,308(0.13%)#81 |
| 82. | Cleveland | 352 | 3,179(11.07%)#2 | 267,308(0.13%)#82 |
| 83. | Troy | 351 | 100,842(0.35%)#15 | 267,308(0.13%)#83 |
| 84. | Davie | 345 | 34,477(1.00%)#21 | 267,308(0.13%)#84 |
| 85. | Kettering | 340 | 10,755(3.16%)#5 | 267,308(0.13%)#85 |
| 86. | St Paul | 336 | 1,444(23.27%)#1 | 267,308(0.13%)#86 |
| 87. | Fayetteville | 331 | 7,634(4.34%)#5 | 267,308(0.12%)#87 |
| 88. | Uniondale | 330 | 100,842(0.33%)#16 | 267,308(0.12%)#88 |
| 89. | South Laurel | 325 | 10,755(3.02%)#6 | 267,308(0.12%)#89 |
| 90. | Manchester | 324 | 569(56.94%)#1 | 267,308(0.12%)#90 |
| 91. | University Cdp Hillsborough County | 320 | 34,477(0.93%)#22 | 267,308(0.12%)#91 |
| 92. | Syracuse | 319 | 100,842(0.32%)#17 | 267,308(0.12%)#92 |
| 93. | Little Rock | 317 | 918(34.53%)#2 | 267,308(0.12%)#93 |
| 94. | Coral Springs | 317 | 34,477(0.92%)#23 | 267,308(0.12%)#94 |
| 95. | South Fulton | 317 | 13,386(2.37%)#3 | 267,308(0.12%)#95 |
| 96. | Norfolk | 315 | 6,773(4.65%)#3 | 267,308(0.12%)#96 |
| 97. | Valley Stream | 315 | 100,842(0.31%)#18 | 267,308(0.12%)#97 |
| 98. | Palm Bay | 311 | 34,477(0.90%)#24 | 267,308(0.12%)#98 |
| 99. | Birmingham | 308 | 1,999(15.41%)#2 | 267,308(0.12%)#99 |
| 100. | Menlo Park Terrace | 307 | 14,042(2.19%)#6 | 267,308(0.11%)#100 |
Common Questions
What are the Top 10 Cities with the Largest West Indian Community in the United States?
Top 10 Cities with the Largest West Indian Community in the United States are:
#1
81,226
#2
4,818
#3
1,926
#4
1,909
#5
1,850
#6
1,612
#7
1,587
#8
1,501
#9
1,440
#10
1,391
What city has the Largest West Indian Community in the United States?
New York has the Largest West Indian Community in the United States with 81,226.
What is the Total West Indian Population in the United States?
Total West Indian Population in the United States is 267,308.