Cities with the Largest West Indian Community in Maryland
RELATED REPORTS & OPTIONS
West Indian
Maryland
Compare Cities
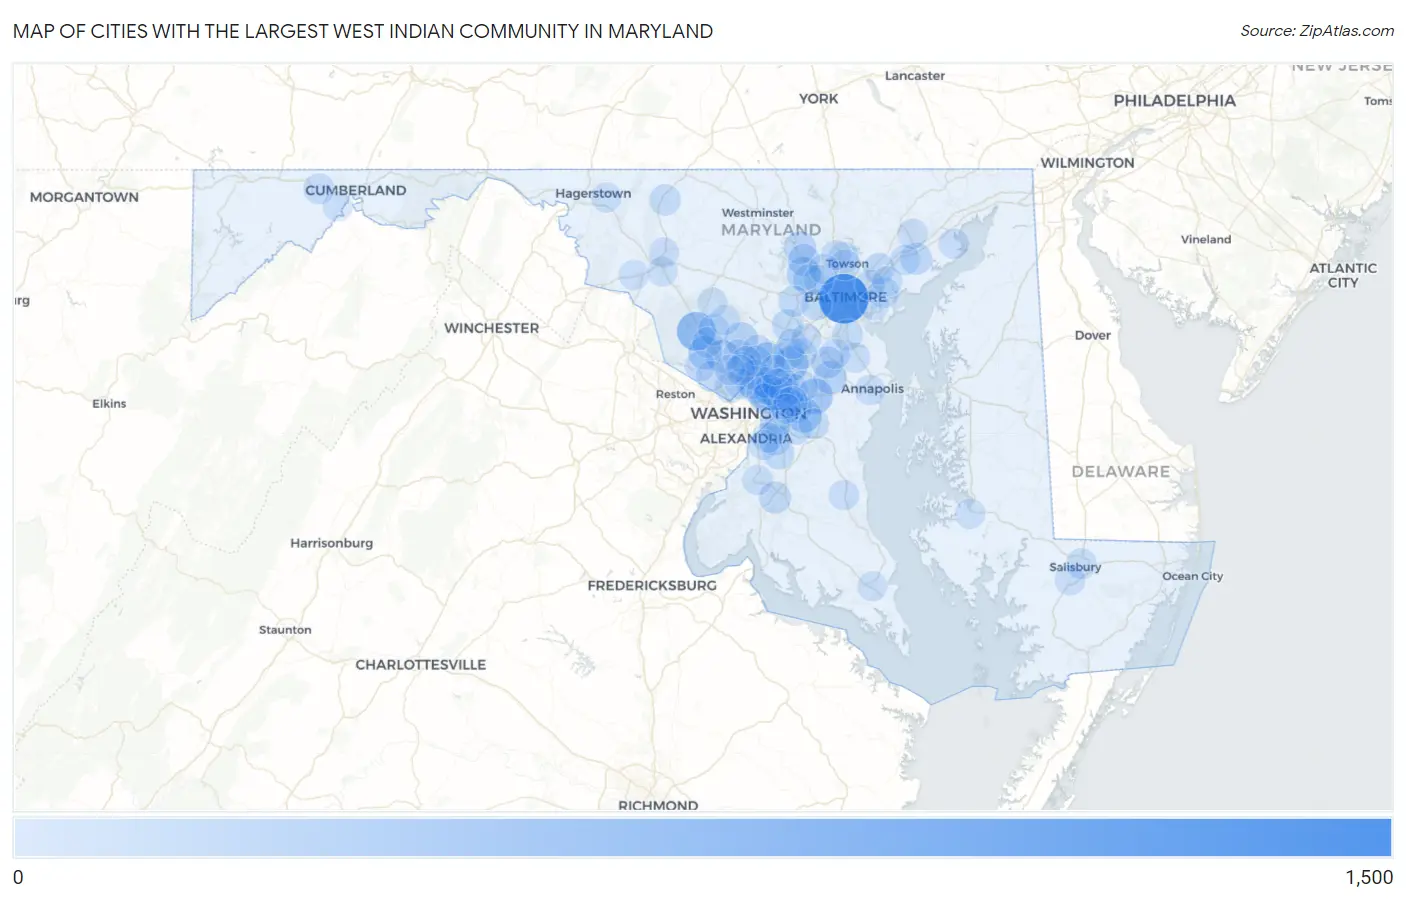
Map of Cities with the Largest West Indian Community in Maryland
0
1,500
Cities with the Largest West Indian Community in Maryland
| City | West Indian | vs State | vs National | |
| 1. | Baltimore | 1,391 | 10,755(12.93%)#1 | 267,308(0.52%)#10 |
| 2. | Germantown | 601 | 10,755(5.59%)#2 | 267,308(0.22%)#33 |
| 3. | Bowie | 389 | 10,755(3.62%)#3 | 267,308(0.15%)#71 |
| 4. | Fairland | 353 | 10,755(3.28%)#4 | 267,308(0.13%)#81 |
| 5. | Kettering | 340 | 10,755(3.16%)#5 | 267,308(0.13%)#85 |
| 6. | South Laurel | 325 | 10,755(3.02%)#6 | 267,308(0.12%)#89 |
| 7. | North Potomac | 269 | 10,755(2.50%)#7 | 267,308(0.10%)#115 |
| 8. | Randallstown | 260 | 10,755(2.42%)#8 | 267,308(0.10%)#121 |
| 9. | Olney | 224 | 10,755(2.08%)#9 | 267,308(0.08%)#143 |
| 10. | Rockville | 219 | 10,755(2.04%)#10 | 267,308(0.08%)#148 |
| 11. | Crofton | 209 | 10,755(1.94%)#11 | 267,308(0.08%)#156 |
| 12. | Silver Spring | 183 | 10,755(1.70%)#12 | 267,308(0.07%)#188 |
| 13. | Reisterstown | 166 | 10,755(1.54%)#13 | 267,308(0.06%)#208 |
| 14. | Greenbelt | 157 | 10,755(1.46%)#14 | 267,308(0.06%)#216 |
| 15. | Takoma Park | 155 | 10,755(1.44%)#15 | 267,308(0.06%)#219 |
| 16. | Owings Mills | 144 | 10,755(1.34%)#16 | 267,308(0.05%)#237 |
| 17. | Odenton | 142 | 10,755(1.32%)#17 | 267,308(0.05%)#243 |
| 18. | Waldorf | 134 | 10,755(1.25%)#18 | 267,308(0.05%)#250 |
| 19. | Edgewood | 131 | 10,755(1.22%)#19 | 267,308(0.05%)#258 |
| 20. | Chillum | 121 | 10,755(1.13%)#20 | 267,308(0.05%)#286 |
| 21. | East Riverdale | 114 | 10,755(1.06%)#21 | 267,308(0.04%)#308 |
| 22. | Lake Arbor | 112 | 10,755(1.04%)#22 | 267,308(0.04%)#316 |
| 23. | Westphalia | 104 | 10,755(0.97%)#23 | 267,308(0.04%)#338 |
| 24. | Columbia | 100 | 10,755(0.93%)#24 | 267,308(0.04%)#353 |
| 25. | Essex | 97 | 10,755(0.90%)#25 | 267,308(0.04%)#362 |
| 26. | Milford Mill | 96 | 10,755(0.89%)#26 | 267,308(0.04%)#366 |
| 27. | White Marsh | 93 | 10,755(0.86%)#27 | 267,308(0.03%)#377 |
| 28. | Laurel | 92 | 10,755(0.86%)#28 | 267,308(0.03%)#382 |
| 29. | Aspen Hill | 91 | 10,755(0.85%)#29 | 267,308(0.03%)#384 |
| 30. | Clinton | 91 | 10,755(0.85%)#30 | 267,308(0.03%)#386 |
| 31. | Thurmont | 88 | 10,755(0.82%)#31 | 267,308(0.03%)#401 |
| 32. | Glen Burnie | 83 | 10,755(0.77%)#32 | 267,308(0.03%)#420 |
| 33. | Montgomery Village | 82 | 10,755(0.76%)#33 | 267,308(0.03%)#422 |
| 34. | Camp Springs | 81 | 10,755(0.75%)#34 | 267,308(0.03%)#431 |
| 35. | Colesville | 77 | 10,755(0.72%)#35 | 267,308(0.03%)#442 |
| 36. | Maryland City | 75 | 10,755(0.70%)#36 | 267,308(0.03%)#449 |
| 37. | Ellicott City | 74 | 10,755(0.69%)#37 | 267,308(0.03%)#456 |
| 38. | Bethesda | 72 | 10,755(0.67%)#38 | 267,308(0.03%)#469 |
| 39. | Woodlawn Cdp Baltimore County | 71 | 10,755(0.66%)#39 | 267,308(0.03%)#476 |
| 40. | Catonsville | 70 | 10,755(0.65%)#40 | 267,308(0.03%)#485 |
| 41. | Brentwood | 70 | 10,755(0.65%)#41 | 267,308(0.03%)#490 |
| 42. | Glenn Dale | 68 | 10,755(0.63%)#42 | 267,308(0.03%)#501 |
| 43. | Coral Hills | 65 | 10,755(0.60%)#43 | 267,308(0.02%)#511 |
| 44. | Riverdale Park | 59 | 10,755(0.55%)#44 | 267,308(0.02%)#560 |
| 45. | Lutherville | 58 | 10,755(0.54%)#45 | 267,308(0.02%)#566 |
| 46. | Seabrook | 56 | 10,755(0.52%)#46 | 267,308(0.02%)#583 |
| 47. | Frostburg | 56 | 10,755(0.52%)#47 | 267,308(0.02%)#586 |
| 48. | Towson | 55 | 10,755(0.51%)#48 | 267,308(0.02%)#588 |
| 49. | Suitland | 55 | 10,755(0.51%)#49 | 267,308(0.02%)#591 |
| 50. | Brock Hall | 55 | 10,755(0.51%)#50 | 267,308(0.02%)#594 |
| 51. | Four Corners | 48 | 10,755(0.45%)#51 | 267,308(0.02%)#645 |
| 52. | Salisbury | 47 | 10,755(0.44%)#52 | 267,308(0.02%)#653 |
| 53. | Temple Hills | 46 | 10,755(0.43%)#53 | 267,308(0.02%)#672 |
| 54. | Adelphi | 44 | 10,755(0.41%)#54 | 267,308(0.02%)#685 |
| 55. | Huntingtown | 43 | 10,755(0.40%)#55 | 267,308(0.02%)#697 |
| 56. | Potomac | 42 | 10,755(0.39%)#56 | 267,308(0.02%)#700 |
| 57. | Bel Air South | 41 | 10,755(0.38%)#57 | 267,308(0.02%)#718 |
| 58. | Landover | 40 | 10,755(0.37%)#58 | 267,308(0.01%)#735 |
| 59. | Mount Rainier | 40 | 10,755(0.37%)#59 | 267,308(0.01%)#739 |
| 60. | University Park | 40 | 10,755(0.37%)#60 | 267,308(0.01%)#741 |
| 61. | Joppatowne | 39 | 10,755(0.36%)#61 | 267,308(0.01%)#750 |
| 62. | North Laurel | 38 | 10,755(0.35%)#62 | 267,308(0.01%)#759 |
| 63. | Aberdeen Proving Ground | 38 | 10,755(0.35%)#63 | 267,308(0.01%)#766 |
| 64. | Cloverly | 37 | 10,755(0.34%)#64 | 267,308(0.01%)#775 |
| 65. | New Carrollton | 37 | 10,755(0.34%)#65 | 267,308(0.01%)#776 |
| 66. | Fruitland | 37 | 10,755(0.34%)#66 | 267,308(0.01%)#781 |
| 67. | Wheaton | 34 | 10,755(0.32%)#67 | 267,308(0.01%)#822 |
| 68. | Gaithersburg | 33 | 10,755(0.31%)#68 | 267,308(0.01%)#840 |
| 69. | Accokeek | 30 | 10,755(0.28%)#69 | 267,308(0.01%)#900 |
| 70. | Jessup | 30 | 10,755(0.28%)#70 | 267,308(0.01%)#903 |
| 71. | Berwyn Heights | 30 | 10,755(0.28%)#71 | 267,308(0.01%)#907 |
| 72. | Annapolis | 29 | 10,755(0.27%)#72 | 267,308(0.01%)#921 |
| 73. | Chevy Chase | 29 | 10,755(0.27%)#73 | 267,308(0.01%)#928 |
| 74. | Glenarden | 28 | 10,755(0.26%)#74 | 267,308(0.01%)#949 |
| 75. | Beltsville | 27 | 10,755(0.25%)#75 | 267,308(0.01%)#970 |
| 76. | Glenmont | 27 | 10,755(0.25%)#76 | 267,308(0.01%)#973 |
| 77. | Travilah | 27 | 10,755(0.25%)#77 | 267,308(0.01%)#977 |
| 78. | Frederick | 26 | 10,755(0.24%)#78 | 267,308(0.01%)#986 |
| 79. | Robinwood | 25 | 10,755(0.23%)#79 | 267,308(0.01%)#1,023 |
| 80. | Severna Park | 24 | 10,755(0.22%)#80 | 267,308(0.01%)#1,039 |
| 81. | Lochearn | 23 | 10,755(0.21%)#81 | 267,308(0.01%)#1,071 |
| 82. | North Kensington | 23 | 10,755(0.21%)#82 | 267,308(0.01%)#1,081 |
| 83. | Gambrills | 23 | 10,755(0.21%)#83 | 267,308(0.01%)#1,087 |
| 84. | Cambridge | 22 | 10,755(0.20%)#84 | 267,308(0.01%)#1,110 |
| 85. | North Bethesda | 21 | 10,755(0.20%)#85 | 267,308(0.01%)#1,127 |
| 86. | Flower Hill | 21 | 10,755(0.20%)#86 | 267,308(0.01%)#1,141 |
| 87. | Laytonsville | 21 | 10,755(0.20%)#87 | 267,308(0.01%)#1,147 |
| 88. | Dundalk | 19 | 10,755(0.18%)#88 | 267,308(0.01%)#1,190 |
| 89. | Springdale | 19 | 10,755(0.18%)#89 | 267,308(0.01%)#1,218 |
| 90. | Cresaptown | 19 | 10,755(0.18%)#90 | 267,308(0.01%)#1,220 |
| 91. | Rosedale | 18 | 10,755(0.17%)#91 | 267,308(0.01%)#1,246 |
| 92. | Mays Chapel | 18 | 10,755(0.17%)#92 | 267,308(0.01%)#1,254 |
| 93. | Jefferson | 16 | 10,755(0.15%)#93 | 267,308(0.01%)#1,331 |
| 94. | Middle River | 13 | 10,755(0.12%)#94 | 267,308(0.00%)#1,418 |
| 95. | Pikesville | 12 | 10,755(0.11%)#95 | 267,308(0.00%)#1,454 |
| 96. | California | 12 | 10,755(0.11%)#96 | 267,308(0.00%)#1,474 |
| 97. | Ballenger Creek | 11 | 10,755(0.10%)#97 | 267,308(0.00%)#1,512 |
| 98. | Oxon Hill | 11 | 10,755(0.10%)#98 | 267,308(0.00%)#1,518 |
| 99. | Damascus | 11 | 10,755(0.10%)#99 | 267,308(0.00%)#1,522 |
| 100. | Summerfield | 11 | 10,755(0.10%)#100 | 267,308(0.00%)#1,524 |
Common Questions
What are the Top 10 Cities with the Largest West Indian Community in Maryland?
Top 10 Cities with the Largest West Indian Community in Maryland are:
#1
1,391
#2
601
#3
389
#4
353
#5
340
#6
325
#7
269
#8
260
#9
224
#10
219
What city has the Largest West Indian Community in Maryland?
Baltimore has the Largest West Indian Community in Maryland with 1,391.
What is the Total West Indian Population in the State of Maryland?
Total West Indian Population in Maryland is 10,755.
What is the Total West Indian Population in the United States?
Total West Indian Population in the United States is 267,308.