Cities with the Largest West Indian Community in New York
RELATED REPORTS & OPTIONS
West Indian
New York
Compare Cities
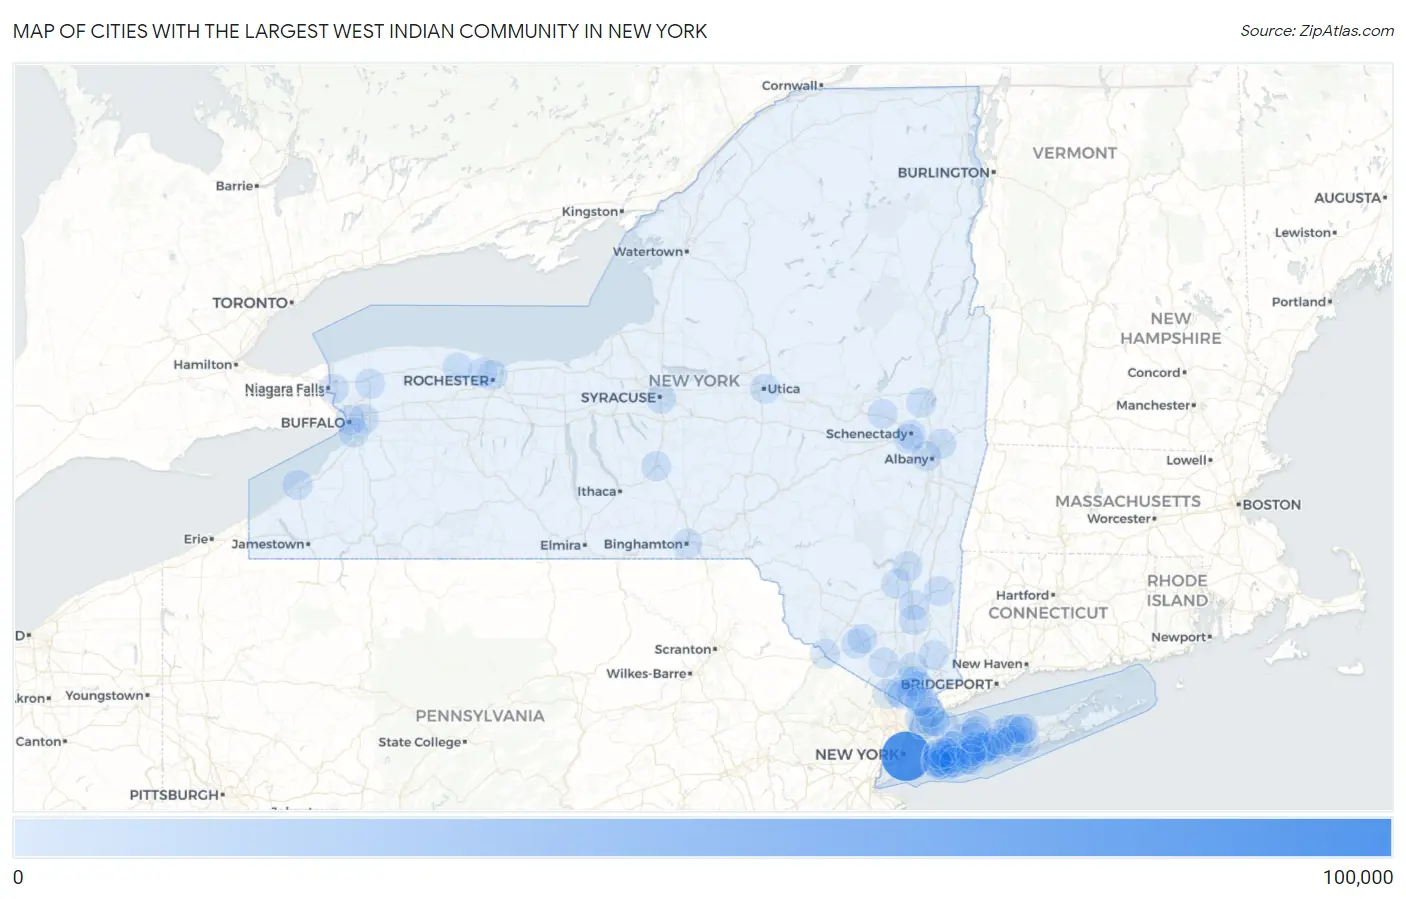
Map of Cities with the Largest West Indian Community in New York
0
100,000
Cities with the Largest West Indian Community in New York
| City | West Indian | vs State | vs National | |
| 1. | New York | 81,226 | 100,842(80.55%)#1 | 267,308(30.39%)#1 |
| 2. | Mount Vernon | 1,850 | 100,842(1.83%)#2 | 267,308(0.69%)#5 |
| 3. | Baldwin | 816 | 100,842(0.81%)#3 | 267,308(0.31%)#19 |
| 4. | Yonkers | 710 | 100,842(0.70%)#4 | 267,308(0.27%)#25 |
| 5. | Schenectady | 680 | 100,842(0.67%)#5 | 267,308(0.25%)#27 |
| 6. | Rochester | 596 | 100,842(0.59%)#6 | 267,308(0.22%)#35 |
| 7. | Tillson | 530 | 100,842(0.53%)#7 | 267,308(0.20%)#40 |
| 8. | Freeport | 484 | 100,842(0.48%)#8 | 267,308(0.18%)#47 |
| 9. | Centereach | 460 | 100,842(0.46%)#9 | 267,308(0.17%)#52 |
| 10. | Haverstraw | 443 | 100,842(0.44%)#10 | 267,308(0.17%)#54 |
| 11. | New Rochelle | 392 | 100,842(0.39%)#11 | 267,308(0.15%)#69 |
| 12. | Central Islip | 370 | 100,842(0.37%)#12 | 267,308(0.14%)#73 |
| 13. | Buffalo | 362 | 100,842(0.36%)#13 | 267,308(0.14%)#76 |
| 14. | Hempstead | 362 | 100,842(0.36%)#14 | 267,308(0.14%)#77 |
| 15. | Troy | 351 | 100,842(0.35%)#15 | 267,308(0.13%)#83 |
| 16. | Uniondale | 330 | 100,842(0.33%)#16 | 267,308(0.12%)#88 |
| 17. | Syracuse | 319 | 100,842(0.32%)#17 | 267,308(0.12%)#92 |
| 18. | Valley Stream | 315 | 100,842(0.31%)#18 | 267,308(0.12%)#97 |
| 19. | Elmont | 301 | 100,842(0.30%)#19 | 267,308(0.11%)#103 |
| 20. | Rotterdam | 296 | 100,842(0.29%)#20 | 267,308(0.11%)#104 |
| 21. | North Valley Stream | 293 | 100,842(0.29%)#21 | 267,308(0.11%)#105 |
| 22. | Albany | 262 | 100,842(0.26%)#22 | 267,308(0.10%)#119 |
| 23. | Middletown | 260 | 100,842(0.26%)#23 | 267,308(0.10%)#122 |
| 24. | Peekskill | 249 | 100,842(0.25%)#24 | 267,308(0.09%)#128 |
| 25. | Poughkeepsie | 229 | 100,842(0.23%)#25 | 267,308(0.09%)#141 |
| 26. | Holtsville | 199 | 100,842(0.20%)#26 | 267,308(0.07%)#171 |
| 27. | Brentwood | 152 | 100,842(0.15%)#27 | 267,308(0.06%)#221 |
| 28. | Dunkirk | 148 | 100,842(0.15%)#28 | 267,308(0.06%)#226 |
| 29. | Glen Cove | 143 | 100,842(0.14%)#29 | 267,308(0.05%)#241 |
| 30. | North Merrick | 138 | 100,842(0.14%)#30 | 267,308(0.05%)#245 |
| 31. | Utica | 137 | 100,842(0.14%)#31 | 267,308(0.05%)#246 |
| 32. | Port Jervis | 134 | 100,842(0.13%)#32 | 267,308(0.05%)#252 |
| 33. | Massapequa | 130 | 100,842(0.13%)#33 | 267,308(0.05%)#263 |
| 34. | Lakeview | 125 | 100,842(0.12%)#34 | 267,308(0.05%)#280 |
| 35. | Amsterdam | 121 | 100,842(0.12%)#35 | 267,308(0.05%)#288 |
| 36. | East Massapequa | 110 | 100,842(0.11%)#36 | 267,308(0.04%)#319 |
| 37. | Oceanside | 105 | 100,842(0.10%)#37 | 267,308(0.04%)#336 |
| 38. | Ossining | 101 | 100,842(0.10%)#38 | 267,308(0.04%)#349 |
| 39. | Huntington Station | 99 | 100,842(0.10%)#39 | 267,308(0.04%)#356 |
| 40. | East Rockaway | 99 | 100,842(0.10%)#40 | 267,308(0.04%)#358 |
| 41. | Patchogue | 98 | 100,842(0.10%)#41 | 267,308(0.04%)#360 |
| 42. | Monroe | 95 | 100,842(0.09%)#42 | 267,308(0.04%)#369 |
| 43. | North Bellport | 91 | 100,842(0.09%)#43 | 267,308(0.03%)#390 |
| 44. | Elmsford | 91 | 100,842(0.09%)#44 | 267,308(0.03%)#391 |
| 45. | West Hempstead | 89 | 100,842(0.09%)#45 | 267,308(0.03%)#397 |
| 46. | Scotchtown | 78 | 100,842(0.08%)#46 | 267,308(0.03%)#441 |
| 47. | Cheektowaga | 74 | 100,842(0.07%)#47 | 267,308(0.03%)#455 |
| 48. | New Cassel | 71 | 100,842(0.07%)#48 | 267,308(0.03%)#478 |
| 49. | Rockville Centre | 69 | 100,842(0.07%)#49 | 267,308(0.03%)#493 |
| 50. | Hewlett | 68 | 100,842(0.07%)#50 | 267,308(0.03%)#502 |
| 51. | Westbury | 67 | 100,842(0.07%)#51 | 267,308(0.03%)#508 |
| 52. | East Meadow | 65 | 100,842(0.06%)#52 | 267,308(0.02%)#509 |
| 53. | Selden | 64 | 100,842(0.06%)#53 | 267,308(0.02%)#520 |
| 54. | Wyandanch | 61 | 100,842(0.06%)#54 | 267,308(0.02%)#538 |
| 55. | Nesconset | 61 | 100,842(0.06%)#55 | 267,308(0.02%)#539 |
| 56. | Islip Terrace | 61 | 100,842(0.06%)#56 | 267,308(0.02%)#542 |
| 57. | Greece | 60 | 100,842(0.06%)#57 | 267,308(0.02%)#547 |
| 58. | Roosevelt | 59 | 100,842(0.06%)#58 | 267,308(0.02%)#557 |
| 59. | South Farmingdale | 57 | 100,842(0.06%)#59 | 267,308(0.02%)#575 |
| 60. | Cortland | 56 | 100,842(0.06%)#60 | 267,308(0.02%)#585 |
| 61. | Bay Shore | 55 | 100,842(0.05%)#61 | 267,308(0.02%)#590 |
| 62. | Clarkson | 53 | 100,842(0.05%)#62 | 267,308(0.02%)#608 |
| 63. | East Kingston | 53 | 100,842(0.05%)#63 | 267,308(0.02%)#609 |
| 64. | South Valley Stream | 52 | 100,842(0.05%)#64 | 267,308(0.02%)#613 |
| 65. | Mamaroneck | 50 | 100,842(0.05%)#65 | 267,308(0.02%)#626 |
| 66. | Binghamton | 48 | 100,842(0.05%)#66 | 267,308(0.02%)#639 |
| 67. | Syosset | 47 | 100,842(0.05%)#67 | 267,308(0.02%)#657 |
| 68. | East Setauket | 47 | 100,842(0.05%)#68 | 267,308(0.02%)#659 |
| 69. | North Babylon | 46 | 100,842(0.05%)#69 | 267,308(0.02%)#666 |
| 70. | Suffern | 46 | 100,842(0.05%)#70 | 267,308(0.02%)#670 |
| 71. | Ballston Spa | 46 | 100,842(0.05%)#71 | 267,308(0.02%)#674 |
| 72. | Coram | 45 | 100,842(0.04%)#72 | 267,308(0.02%)#681 |
| 73. | North Bay Shore | 45 | 100,842(0.04%)#73 | 267,308(0.02%)#683 |
| 74. | South Lockport | 43 | 100,842(0.04%)#74 | 267,308(0.02%)#695 |
| 75. | Centerport | 43 | 100,842(0.04%)#75 | 267,308(0.02%)#696 |
| 76. | Holbrook | 42 | 100,842(0.04%)#76 | 267,308(0.02%)#707 |
| 77. | Spring Valley | 41 | 100,842(0.04%)#77 | 267,308(0.02%)#722 |
| 78. | Lackawanna | 41 | 100,842(0.04%)#78 | 267,308(0.02%)#724 |
| 79. | South Floral Park | 41 | 100,842(0.04%)#79 | 267,308(0.02%)#728 |
| 80. | Mahopac | 39 | 100,842(0.04%)#80 | 267,308(0.01%)#753 |
| 81. | Wheatley Heights | 39 | 100,842(0.04%)#81 | 267,308(0.01%)#755 |
| 82. | North Amityville | 38 | 100,842(0.04%)#82 | 267,308(0.01%)#761 |
| 83. | Baywood | 38 | 100,842(0.04%)#83 | 267,308(0.01%)#764 |
| 84. | Niagara Falls | 34 | 100,842(0.03%)#84 | 267,308(0.01%)#823 |
| 85. | Garden City | 34 | 100,842(0.03%)#85 | 267,308(0.01%)#828 |
| 86. | Amityville | 34 | 100,842(0.03%)#86 | 267,308(0.01%)#832 |
| 87. | Greenlawn | 33 | 100,842(0.03%)#87 | 267,308(0.01%)#847 |
| 88. | Gordon Heights | 33 | 100,842(0.03%)#88 | 267,308(0.01%)#851 |
| 89. | Middle Island | 32 | 100,842(0.03%)#89 | 267,308(0.01%)#857 |
| 90. | Croton On Hudson | 32 | 100,842(0.03%)#90 | 267,308(0.01%)#862 |
| 91. | Millbrook | 32 | 100,842(0.03%)#91 | 267,308(0.01%)#865 |
| 92. | East Farmingdale | 31 | 100,842(0.03%)#92 | 267,308(0.01%)#881 |
| 93. | Scarsdale | 30 | 100,842(0.03%)#93 | 267,308(0.01%)#899 |
| 94. | South Huntington | 30 | 100,842(0.03%)#94 | 267,308(0.01%)#902 |
| 95. | Valley Cottage | 30 | 100,842(0.03%)#95 | 267,308(0.01%)#904 |
| 96. | Merrick | 29 | 100,842(0.03%)#96 | 267,308(0.01%)#924 |
| 97. | Nanuet | 29 | 100,842(0.03%)#97 | 267,308(0.01%)#925 |
| 98. | Wappingers Falls | 29 | 100,842(0.03%)#98 | 267,308(0.01%)#930 |
| 99. | Tarrytown | 28 | 100,842(0.03%)#99 | 267,308(0.01%)#945 |
| 100. | Islandia | 28 | 100,842(0.03%)#100 | 267,308(0.01%)#953 |
Common Questions
What are the Top 10 Cities with the Largest West Indian Community in New York?
Top 10 Cities with the Largest West Indian Community in New York are:
#1
81,226
#2
1,850
#3
816
#4
710
#5
680
#6
596
#7
530
#8
484
#9
460
#10
443
What city has the Largest West Indian Community in New York?
New York has the Largest West Indian Community in New York with 81,226.
What is the Total West Indian Population in the State of New York?
Total West Indian Population in New York is 100,842.
What is the Total West Indian Population in the United States?
Total West Indian Population in the United States is 267,308.