Cities with the Fewest Births per 1,000 Teenage Women Under the Age of 20 in New Mexico
RELATED REPORTS & OPTIONS
Lowest Birth Rate | Women 15-19
New Mexico
Compare Cities
Map of Cities with the Fewest Births per 1,000 Teenage Women Under the Age of 20 in New Mexico
1,000.0
0.0
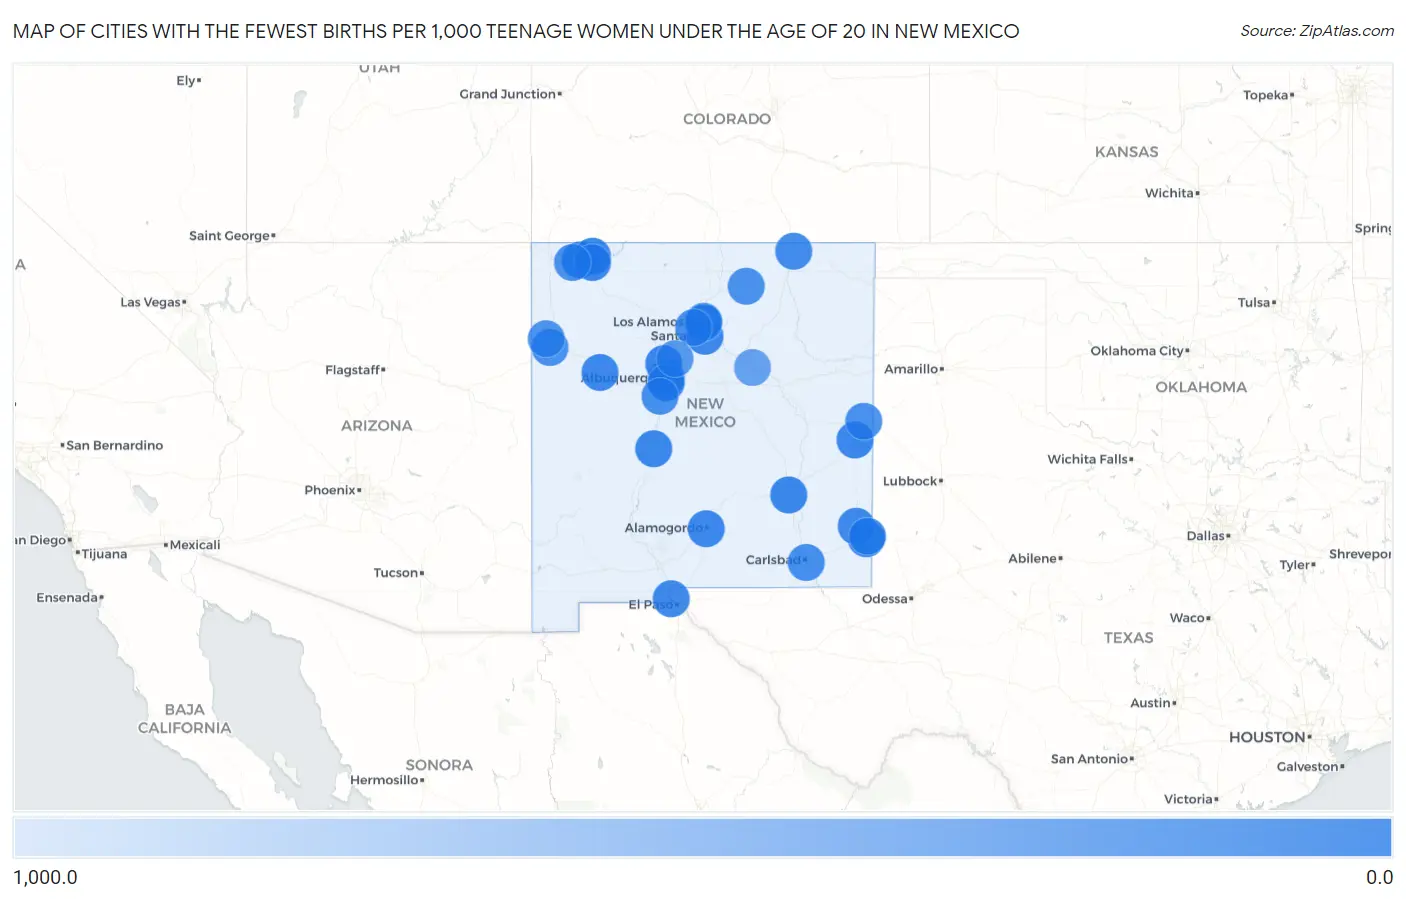
Cities with the Fewest Births per 1,000 Teenage Women Under the Age of 20 in New Mexico
| City | Births / 1,000 Women | vs State | vs National | |
| 1. | Farmington | 4.0 | 18.0(-14.0)#1 | 10.0(-6.00)#132 |
| 2. | Albuquerque | 5.0 | 18.0(-13.0)#2 | 10.0(-5.00)#140 |
| 3. | Rio Rancho | 7.0 | 18.0(-11.0)#3 | 10.0(-3.00)#233 |
| 4. | Socorro | 13.0 | 18.0(-5.00)#4 | 10.0(+3.00)#482 |
| 5. | Roswell | 15.0 | 18.0(-3.00)#5 | 10.0(+5.00)#540 |
| 6. | South Valley | 24.0 | 18.0(+6.00)#6 | 10.0(+14.0)#785 |
| 7. | Portales | 24.0 | 18.0(+6.00)#7 | 10.0(+14.0)#792 |
| 8. | Aztec | 27.0 | 18.0(+9.00)#8 | 10.0(+17.0)#871 |
| 9. | Bloomfield | 29.0 | 18.0(+11.0)#9 | 10.0(+19.0)#901 |
| 10. | Alamogordo | 30.0 | 18.0(+12.0)#10 | 10.0(+20.0)#914 |
| 11. | Espanola | 34.0 | 18.0(+16.0)#11 | 10.0(+24.0)#989 |
| 12. | Hobbs | 38.0 | 18.0(+20.0)#12 | 10.0(+28.0)#1,054 |
| 13. | Santa Fe | 39.0 | 18.0(+21.0)#13 | 10.0(+29.0)#1,067 |
| 14. | Grants | 40.0 | 18.0(+22.0)#14 | 10.0(+30.0)#1,088 |
| 15. | Sunland Park | 59.0 | 18.0(+41.0)#15 | 10.0(+49.0)#1,291 |
| 16. | Lovington | 60.0 | 18.0(+42.0)#16 | 10.0(+50.0)#1,302 |
| 17. | Pojoaque | 71.0 | 18.0(+53.0)#17 | 10.0(+61.0)#1,406 |
| 18. | Cuyamungue | 80.0 | 18.0(+62.0)#18 | 10.0(+70.0)#1,470 |
| 19. | North Hobbs | 93.0 | 18.0(+75.0)#19 | 10.0(+83.0)#1,559 |
| 20. | Raton | 94.0 | 18.0(+76.0)#20 | 10.0(+84.0)#1,563 |
| 21. | Carlsbad | 101.0 | 18.0(+83.0)#21 | 10.0(+91.0)#1,600 |
| 22. | Los Lunas | 104.0 | 18.0(+86.0)#22 | 10.0(+94.0)#1,618 |
| 23. | White Rock | 128.0 | 18.0(+110)#23 | 10.0(+118)#1,747 |
| 24. | Gallup | 144.0 | 18.0(+126)#24 | 10.0(+134)#1,810 |
| 25. | Upper Fruitland | 147.0 | 18.0(+129)#25 | 10.0(+137)#1,827 |
| 26. | Angel Fire | 150.0 | 18.0(+132)#26 | 10.0(+140)#1,840 |
| 27. | Clovis | 157.0 | 18.0(+139)#27 | 10.0(+147)#1,860 |
| 28. | Yah Ta Hey | 167.0 | 18.0(+149)#28 | 10.0(+157)#1,904 |
| 29. | Santa Ana Pueblo | 250.0 | 18.0(+232)#29 | 10.0(+240)#2,082 |
| 30. | Tecolotito | 368.0 | 18.0(+350)#30 | 10.0(+358)#2,214 |
| 31. | Valle Vista | 1,000.0 | 18.0(+982)#31 | 10.0(+990)#2,386 |
1
2Common Questions
What are the Top 10 Cities with the Fewest Births per 1,000 Teenage Women Under the Age of 20 in New Mexico?
Top 10 Cities with the Fewest Births per 1,000 Teenage Women Under the Age of 20 in New Mexico are:
#1
0.0
#2
0.0
#3
0.0
#4
0.0
#5
0.0
#6
0.0
#7
0.0
#8
0.0
#9
0.0
#10
0.0
What city has the Fewest Births per 1,000 Teenage Women Under the Age of 20 in New Mexico?
Farmington has the Fewest Births per 1,000 Teenage Women Under the Age of 20 in New Mexico with 4.0.
What is the Number of Births per 1,000 Teenage Women Under the Age of 20 in the State of New Mexico?
Number of Births per 1,000 Teenage Women Under the Age of 20 in New Mexico is 18.0.
What is the Number of Births per 1,000 Teenage Women Under the Age of 20 in the United States?
Number of Births per 1,000 Teenage Women Under the Age of 20 in the United States is 10.0.