Cities with the Fewest Births per 1,000 Teenage Women Under the Age of 20 in Minnesota

RELATED REPORTS & OPTIONS

Lowest Birth Rate | Women 15-19
Population
Families and Households
Female Fertility
Female Fertility (Unmarried)
Race (Community Size)
Race (Percentage)
Ancestry (Community Size)
AfghanAfricanAlaska NativeAlaskan AthabascanAlbanianAleutAlsatianAmericanApacheArabArapahoArgentineanArmenianAssyrian / Chaldean / SyriacAustralianAustrianBahamianBangladeshiBarbadianBasqueBelgianBelizeanBermudanBhutaneseBlackfeetBolivianBrazilianBritishBritish West IndianBulgarianBurmeseCajunCambodianCanadianCape VerdeanCarpatho RusynCelticCentral AmericanCentral American IndianCherokeeCheyenneChickasawChileanChineseChippewaChoctawColombianColvilleComancheCosta RicanCreeCreekCroatianCrowCubanCypriotCzechCzechoslovakianDanishDelawareDominicanDutchDutch West IndianEastern EuropeanEcuadorianEgyptianEnglishEstonianEthiopianEuropeanFijianFilipinoFinnishFrenchFrench American IndianFrench CanadianGermanGerman RussianGhanaianGreekGuamanian / ChamorroGuatemalanGuyaneseHaitianHmongHonduranHopiHoumaHungarianIcelanderIndian (Asian)IndonesianInupiatIranianIraqiIrishIroquoisIsraeliItalianJamaicanJapaneseJordanianKenyanKiowaKoreanLaotianLatvianLebaneseLiberianLithuanianLumbeeLuxembourgerMacedonianMalaysianMalteseMarshalleseMenomineeMexicanMexican American IndianMongolianMoroccanNative HawaiianNavajoNepaleseNew ZealanderNicaraguanNigerianNorthern EuropeanNorwegianOkinawanOsageOttawaPaiutePakistaniPalestinianPanamanianParaguayanPennsylvania GermanPeruvianPimaPolishPortuguesePotawatomiPuebloPuerto RicanPuget Sound SalishRomanianRussianSalvadoranSamoanScandinavianScotch-IrishScottishSeminoleSenegaleseSerbianShoshoneSierra LeoneanSiouxSlavicSlovakSloveneSomaliSouth AfricanSouth AmericanSouth American IndianSoviet UnionSpaniardSpanishSpanish AmericanSpanish American IndianSri LankanSubsaharan AfricanSudaneseSwedishSwissSyrianTaiwaneseThaiTlingit-HaidaTohono O'OdhamTonganTrinidadian and TobagonianTsimshianTurkishU.S. Virgin IslanderUgandanUkrainianUruguayanUteVenezuelanVietnameseWelshWest IndianYakamaYaquiYugoslavianYumanYup'ikZimbabwean
Ancestry (Percentage)
AfghanAfricanAlaska NativeAlaskan AthabascanAlbanianAleutAlsatianAmericanApacheArabArapahoArgentineanArmenianAssyrian / Chaldean / SyriacAustralianAustrianBahamianBangladeshiBarbadianBasqueBelgianBelizeanBermudanBhutaneseBlackfeetBolivianBrazilianBritishBritish West IndianBulgarianBurmeseCajunCambodianCanadianCape VerdeanCarpatho RusynCelticCentral AmericanCentral American IndianCherokeeCheyenneChickasawChileanChineseChippewaChoctawColombianColvilleComancheCosta RicanCreeCreekCroatianCrowCubanCypriotCzechCzechoslovakianDanishDelawareDominicanDutchDutch West IndianEastern EuropeanEcuadorianEgyptianEnglishEstonianEthiopianEuropeanFijianFilipinoFinnishFrenchFrench American IndianFrench CanadianGermanGerman RussianGhanaianGreekGuamanian / ChamorroGuatemalanGuyaneseHaitianHmongHonduranHopiHoumaHungarianIcelanderIndian (Asian)IndonesianInupiatIranianIraqiIrishIroquoisIsraeliItalianJamaicanJapaneseJordanianKenyanKiowaKoreanLaotianLatvianLebaneseLiberianLithuanianLumbeeLuxembourgerMacedonianMalaysianMalteseMarshalleseMenomineeMexicanMexican American IndianMongolianMoroccanNative HawaiianNavajoNepaleseNew ZealanderNicaraguanNigerianNorthern EuropeanNorwegianOkinawanOsageOttawaPaiutePakistaniPalestinianPanamanianParaguayanPennsylvania GermanPeruvianPimaPolishPortuguesePotawatomiPuebloPuerto RicanPuget Sound SalishRomanianRussianSalvadoranSamoanScandinavianScotch-IrishScottishSeminoleSenegaleseSerbianShoshoneSierra LeoneanSiouxSlavicSlovakSloveneSomaliSouth AfricanSouth AmericanSouth American IndianSoviet UnionSpaniardSpanishSpanish AmericanSpanish American IndianSri LankanSubsaharan AfricanSudaneseSwedishSwissSyrianTaiwaneseThaiTlingit-HaidaTohono O'OdhamTonganTrinidadian and TobagonianTsimshianTurkishU.S. Virgin IslanderUgandanUkrainianUruguayanUteVenezuelanVietnameseWelshWest IndianYakamaYaquiYugoslavianYumanYup'ikZimbabwean
Immigrant Origin (Total)
AfghanistanAfricaAlbaniaArgentinaArmeniaAsiaAustraliaAustriaAzoresBahamasBangladeshBarbadosBelarusBelgiumBelizeBoliviaBosnia and HerzegovinaBrazilBulgariaBurma / MyanmarCabo VerdeCambodiaCameroonCanadaCaribbeanCentral AmericaChileChinaColombiaCongoCosta RicaCroatiaCubaCzechoslovakiaDenmarkDominicaDominican RepublicEastern AfricaEastern AsiaEastern EuropeEcuadorEgyptEl SalvadorEnglandEritreaEthiopiaEuropeFijiFranceGermanyGhanaGreeceGrenadaGuatemalaGuyanaHaitiHondurasHong KongHungaryIndiaIndonesiaIranIraqIrelandIsraelItalyJamaicaJapanJordanKazakhstanKenyaKoreaKuwaitLaosLatin AmericaLatviaLebanonLiberiaLithuaniaMalaysiaMexicoMicronesiaMiddle AfricaMoldovaMoroccoNepalNetherlandsNicaraguaNigeriaNorth MacedoniaNorthern AfricaNorthern EuropeNorwayOceaniaPakistanPanamaPeruPhilippinesPolandPortugalRomaniaRussiaSaudi ArabiaScotlandSenegalSerbiaSierra LeoneSingaporeSomaliaSouth AfricaSouth AmericaSouth Central AsiaSouth Eastern AsiaSouthern EuropeSpainSri LankaSt. Vincent and the GrenadinesSudanSwedenSwitzerlandSyriaTaiwanThailandTrinidad and TobagoTurkeyUgandaUkraineUruguayUzbekistanVenezuelaVietnamWest IndiesWestern AfricaWestern AsiaWestern EuropeYemenZaireZimbabwe
Immigrant Origin (Percentage)
AfghanistanAfricaAlbaniaArgentinaArmeniaAsiaAustraliaAustriaAzoresBahamasBangladeshBarbadosBelarusBelgiumBelizeBoliviaBosnia and HerzegovinaBrazilBulgariaBurma / MyanmarCabo VerdeCambodiaCameroonCanadaCaribbeanCentral AmericaChileChinaColombiaCongoCosta RicaCroatiaCubaCzechoslovakiaDenmarkDominicaDominican RepublicEastern AfricaEastern AsiaEastern EuropeEcuadorEgyptEl SalvadorEnglandEritreaEthiopiaEuropeFijiFranceGermanyGhanaGreeceGrenadaGuatemalaGuyanaHaitiHondurasHong KongHungaryIndiaIndonesiaIranIraqIrelandIsraelItalyJamaicaJapanJordanKazakhstanKenyaKoreaKuwaitLaosLatin AmericaLatviaLebanonLiberiaLithuaniaMalaysiaMexicoMicronesiaMiddle AfricaMoldovaMoroccoNepalNetherlandsNicaraguaNigeriaNorth MacedoniaNorthern AfricaNorthern EuropeNorwayOceaniaPakistanPanamaPeruPhilippinesPolandPortugalRomaniaRussiaSaudi ArabiaScotlandSenegalSerbiaSierra LeoneSingaporeSomaliaSouth AfricaSouth AmericaSouth Central AsiaSouth Eastern AsiaSouthern EuropeSpainSri LankaSt. Vincent and the GrenadinesSudanSwedenSwitzerlandSyriaTaiwanThailandTrinidad and TobagoTurkeyUgandaUkraineUruguayUzbekistanVenezuelaVietnamWest IndiesWestern AfricaWestern AsiaWestern EuropeYemenZaireZimbabwe
Income
Income (Families)
Income (Households)
Poverty
Poverty (Families)
Unemployment
Employment Occupations
Employment Industries
Employer Class
Commute Time
Commute Means
School Enrollment
Education by Degree Field
Occupancy
Finances
Physical Characteristics
Minnesota
Compare Cities
Comparison Subject

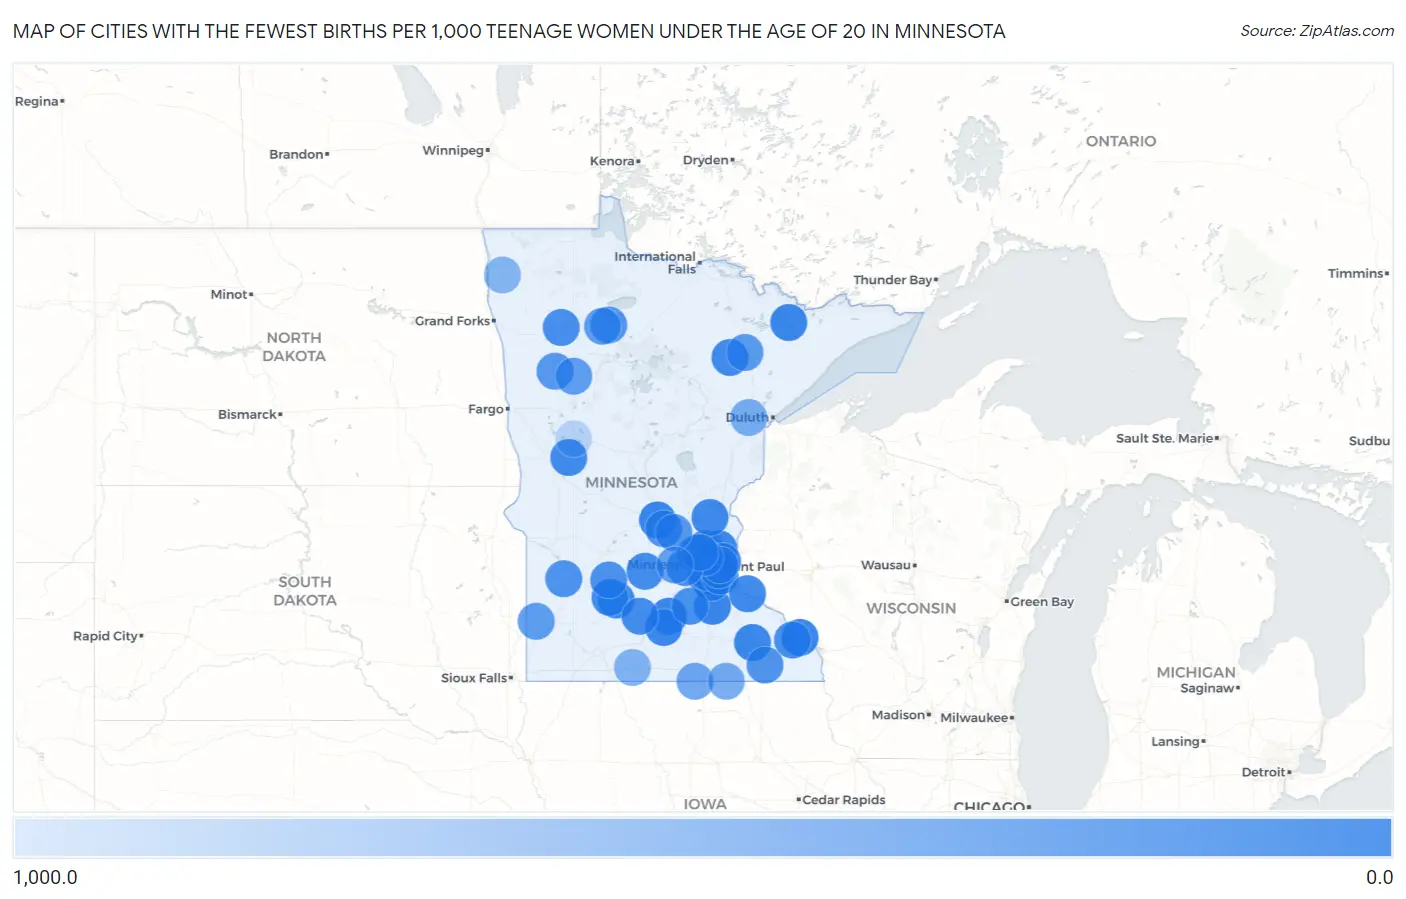
Map of Cities with the Fewest Births per 1,000 Teenage Women Under the Age of 20 in Minnesota

1,000.0
0.0
Cities with the Fewest Births per 1,000 Teenage Women Under the Age of 20 in Minnesota Map

Cities with the Fewest Births per 1,000 Teenage Women Under the Age of 20 in Minnesota

City Births / 1,000 Women vs State vs National
1.Northfield2.07.0(-5.00)#110.0(-8.00)#53
2.St Cloud4.07.0(-3.00)#210.0(-6.00)#123
3.Winona5.07.0(-2.00)#310.0(-5.00)#173
4.Minneapolis7.07.0(=0.000)#410.0(-3.00)#220
5.Bloomington7.07.0(=0.000)#510.0(-3.00)#235
6.St Paul9.07.0(+2.00)#610.0(-1.000)#304
7.Maple Grove9.07.0(+2.00)#710.0(-1.000)#320
8.Apple Valley11.07.0(+4.00)#810.0(+1.000)#395
9.Ely13.07.0(+6.00)#910.0(+3.00)#484
10.Richfield16.07.0(+9.00)#1010.0(+6.00)#578
11.Rochester18.07.0(+11.0)#1110.0(+8.00)#620
12.Inver Grove Heights18.07.0(+11.0)#1210.0(+8.00)#635
13.West St Paul23.07.0(+16.0)#1310.0(+13.0)#761
14.St Peter23.07.0(+16.0)#1410.0(+13.0)#769
15.Coon Rapids31.07.0(+24.0)#1510.0(+21.0)#932
16.Lino Lakes35.07.0(+28.0)#1610.0(+25.0)#1,008
17.North Mankato42.07.0(+35.0)#1710.0(+32.0)#1,105
18.Cambridge44.07.0(+37.0)#1810.0(+34.0)#1,136
19.Franklin56.07.0(+49.0)#1910.0(+46.0)#1,272
20.Red Wing59.07.0(+52.0)#2010.0(+49.0)#1,292
21.North St Paul59.07.0(+52.0)#2110.0(+49.0)#1,293
22.Chisholm61.07.0(+54.0)#2210.0(+51.0)#1,313
23.Battle Lake69.07.0(+62.0)#2310.0(+59.0)#1,393
24.Maplewood72.07.0(+65.0)#2410.0(+62.0)#1,410
25.Morton83.07.0(+76.0)#2510.0(+73.0)#1,492
26.Hutchinson85.07.0(+78.0)#2610.0(+75.0)#1,502
27.New Ulm87.07.0(+80.0)#2710.0(+77.0)#1,517
28.Brooklyn Center98.07.0(+91.0)#2810.0(+88.0)#1,582
29.Stockton111.07.0(+104)#2910.0(+101)#1,666
30.Oklee111.07.0(+104)#3010.0(+101)#1,670
31.Mound135.07.0(+128)#3110.0(+125)#1,775
32.Montgomery146.07.0(+139)#3210.0(+136)#1,821
33.Olivia156.07.0(+149)#3310.0(+146)#1,859
34.Osseo158.07.0(+151)#3410.0(+148)#1,868
35.Clearwater161.07.0(+154)#3510.0(+151)#1,883
36.Clarkfield167.07.0(+160)#3610.0(+157)#1,903
37.Wykoff182.07.0(+175)#3710.0(+172)#1,947
38.Red Lake222.07.0(+215)#3810.0(+212)#2,039
39.Riverland231.07.0(+224)#3910.0(+221)#2,063
40.Becker242.07.0(+235)#4010.0(+232)#2,075
41.Mountain Iron270.07.0(+263)#4110.0(+260)#2,113
42.Lake Benton278.07.0(+271)#4210.0(+268)#2,129
43.Naytahwaush292.07.0(+285)#4310.0(+282)#2,145
44.Little Rock308.07.0(+301)#4410.0(+298)#2,159
45.Watertown352.07.0(+345)#4510.0(+342)#2,205
46.Emmons400.07.0(+393)#4610.0(+390)#2,239
47.Lyle444.07.0(+437)#4710.0(+434)#2,267
48.Mahnomen500.07.0(+493)#4810.0(+490)#2,296
49.Welcome571.07.0(+564)#4910.0(+561)#2,318
50.Stephen615.07.0(+608)#5010.0(+605)#2,330
51.Richville1,000.07.0(+993)#5110.0(+990)#2,423

Common Questions

What are the Top 10 Cities with the Fewest Births per 1,000 Teenage Women Under the Age of 20 in Minnesota?
Top 10 Cities with the Fewest Births per 1,000 Teenage Women Under the Age of 20 in Minnesota are:
What city has the Fewest Births per 1,000 Teenage Women Under the Age of 20 in Minnesota?
Northfield has the Fewest Births per 1,000 Teenage Women Under the Age of 20 in Minnesota with 2.0.
What is the Number of Births per 1,000 Teenage Women Under the Age of 20 in the State of Minnesota?
Number of Births per 1,000 Teenage Women Under the Age of 20 in Minnesota is 7.0.
What is the Number of Births per 1,000 Teenage Women Under the Age of 20 in the United States?
Number of Births per 1,000 Teenage Women Under the Age of 20 in the United States is 10.0.