Cities with the Fewest Births per 1,000 Teenage Women Under the Age of 20 in South Carolina

RELATED REPORTS & OPTIONS

Lowest Birth Rate | Women 15-19
Population
Families and Households
Female Fertility
Female Fertility (Unmarried)
Race (Community Size)
Race (Percentage)
Ancestry (Community Size)
AfghanAfricanAlaska NativeAlaskan AthabascanAlbanianAleutAlsatianAmericanApacheArabArapahoArgentineanArmenianAssyrian / Chaldean / SyriacAustralianAustrianBahamianBangladeshiBarbadianBasqueBelgianBelizeanBermudanBhutaneseBlackfeetBolivianBrazilianBritishBritish West IndianBulgarianBurmeseCajunCambodianCanadianCape VerdeanCarpatho RusynCelticCentral AmericanCentral American IndianCherokeeCheyenneChickasawChileanChineseChippewaChoctawColombianColvilleComancheCosta RicanCreeCreekCroatianCrowCubanCypriotCzechCzechoslovakianDanishDelawareDominicanDutchDutch West IndianEastern EuropeanEcuadorianEgyptianEnglishEstonianEthiopianEuropeanFijianFilipinoFinnishFrenchFrench American IndianFrench CanadianGermanGerman RussianGhanaianGreekGuamanian / ChamorroGuatemalanGuyaneseHaitianHmongHonduranHopiHoumaHungarianIcelanderIndian (Asian)IndonesianInupiatIranianIraqiIrishIroquoisIsraeliItalianJamaicanJapaneseJordanianKenyanKiowaKoreanLaotianLatvianLebaneseLiberianLithuanianLumbeeLuxembourgerMacedonianMalaysianMalteseMarshalleseMenomineeMexicanMexican American IndianMongolianMoroccanNative HawaiianNavajoNepaleseNew ZealanderNicaraguanNigerianNorthern EuropeanNorwegianOkinawanOsageOttawaPaiutePakistaniPalestinianPanamanianParaguayanPennsylvania GermanPeruvianPimaPolishPortuguesePotawatomiPuebloPuerto RicanPuget Sound SalishRomanianRussianSalvadoranSamoanScandinavianScotch-IrishScottishSeminoleSenegaleseSerbianShoshoneSierra LeoneanSiouxSlavicSlovakSloveneSomaliSouth AfricanSouth AmericanSouth American IndianSoviet UnionSpaniardSpanishSpanish AmericanSpanish American IndianSri LankanSubsaharan AfricanSudaneseSwedishSwissSyrianTaiwaneseThaiTlingit-HaidaTohono O'OdhamTonganTrinidadian and TobagonianTsimshianTurkishU.S. Virgin IslanderUgandanUkrainianUruguayanUteVenezuelanVietnameseWelshWest IndianYakamaYaquiYugoslavianYumanYup'ikZimbabwean
Ancestry (Percentage)
AfghanAfricanAlaska NativeAlaskan AthabascanAlbanianAleutAlsatianAmericanApacheArabArapahoArgentineanArmenianAssyrian / Chaldean / SyriacAustralianAustrianBahamianBangladeshiBarbadianBasqueBelgianBelizeanBermudanBhutaneseBlackfeetBolivianBrazilianBritishBritish West IndianBulgarianBurmeseCajunCambodianCanadianCape VerdeanCarpatho RusynCelticCentral AmericanCentral American IndianCherokeeCheyenneChickasawChileanChineseChippewaChoctawColombianColvilleComancheCosta RicanCreeCreekCroatianCrowCubanCypriotCzechCzechoslovakianDanishDelawareDominicanDutchDutch West IndianEastern EuropeanEcuadorianEgyptianEnglishEstonianEthiopianEuropeanFijianFilipinoFinnishFrenchFrench American IndianFrench CanadianGermanGerman RussianGhanaianGreekGuamanian / ChamorroGuatemalanGuyaneseHaitianHmongHonduranHopiHoumaHungarianIcelanderIndian (Asian)IndonesianInupiatIranianIraqiIrishIroquoisIsraeliItalianJamaicanJapaneseJordanianKenyanKiowaKoreanLaotianLatvianLebaneseLiberianLithuanianLumbeeLuxembourgerMacedonianMalaysianMalteseMarshalleseMenomineeMexicanMexican American IndianMongolianMoroccanNative HawaiianNavajoNepaleseNew ZealanderNicaraguanNigerianNorthern EuropeanNorwegianOkinawanOsageOttawaPaiutePakistaniPalestinianPanamanianParaguayanPennsylvania GermanPeruvianPimaPolishPortuguesePotawatomiPuebloPuerto RicanPuget Sound SalishRomanianRussianSalvadoranSamoanScandinavianScotch-IrishScottishSeminoleSenegaleseSerbianShoshoneSierra LeoneanSiouxSlavicSlovakSloveneSomaliSouth AfricanSouth AmericanSouth American IndianSoviet UnionSpaniardSpanishSpanish AmericanSpanish American IndianSri LankanSubsaharan AfricanSudaneseSwedishSwissSyrianTaiwaneseThaiTlingit-HaidaTohono O'OdhamTonganTrinidadian and TobagonianTsimshianTurkishU.S. Virgin IslanderUgandanUkrainianUruguayanUteVenezuelanVietnameseWelshWest IndianYakamaYaquiYugoslavianYumanYup'ikZimbabwean
Immigrant Origin (Total)
AfghanistanAfricaAlbaniaArgentinaArmeniaAsiaAustraliaAustriaAzoresBahamasBangladeshBarbadosBelarusBelgiumBelizeBoliviaBosnia and HerzegovinaBrazilBulgariaBurma / MyanmarCabo VerdeCambodiaCameroonCanadaCaribbeanCentral AmericaChileChinaColombiaCongoCosta RicaCroatiaCubaCzechoslovakiaDenmarkDominicaDominican RepublicEastern AfricaEastern AsiaEastern EuropeEcuadorEgyptEl SalvadorEnglandEritreaEthiopiaEuropeFijiFranceGermanyGhanaGreeceGrenadaGuatemalaGuyanaHaitiHondurasHong KongHungaryIndiaIndonesiaIranIraqIrelandIsraelItalyJamaicaJapanJordanKazakhstanKenyaKoreaKuwaitLaosLatin AmericaLatviaLebanonLiberiaLithuaniaMalaysiaMexicoMicronesiaMiddle AfricaMoldovaMoroccoNepalNetherlandsNicaraguaNigeriaNorth MacedoniaNorthern AfricaNorthern EuropeNorwayOceaniaPakistanPanamaPeruPhilippinesPolandPortugalRomaniaRussiaSaudi ArabiaScotlandSenegalSerbiaSierra LeoneSingaporeSomaliaSouth AfricaSouth AmericaSouth Central AsiaSouth Eastern AsiaSouthern EuropeSpainSri LankaSt. Vincent and the GrenadinesSudanSwedenSwitzerlandSyriaTaiwanThailandTrinidad and TobagoTurkeyUgandaUkraineUruguayUzbekistanVenezuelaVietnamWest IndiesWestern AfricaWestern AsiaWestern EuropeYemenZaireZimbabwe
Immigrant Origin (Percentage)
AfghanistanAfricaAlbaniaArgentinaArmeniaAsiaAustraliaAustriaAzoresBahamasBangladeshBarbadosBelarusBelgiumBelizeBoliviaBosnia and HerzegovinaBrazilBulgariaBurma / MyanmarCabo VerdeCambodiaCameroonCanadaCaribbeanCentral AmericaChileChinaColombiaCongoCosta RicaCroatiaCubaCzechoslovakiaDenmarkDominicaDominican RepublicEastern AfricaEastern AsiaEastern EuropeEcuadorEgyptEl SalvadorEnglandEritreaEthiopiaEuropeFijiFranceGermanyGhanaGreeceGrenadaGuatemalaGuyanaHaitiHondurasHong KongHungaryIndiaIndonesiaIranIraqIrelandIsraelItalyJamaicaJapanJordanKazakhstanKenyaKoreaKuwaitLaosLatin AmericaLatviaLebanonLiberiaLithuaniaMalaysiaMexicoMicronesiaMiddle AfricaMoldovaMoroccoNepalNetherlandsNicaraguaNigeriaNorth MacedoniaNorthern AfricaNorthern EuropeNorwayOceaniaPakistanPanamaPeruPhilippinesPolandPortugalRomaniaRussiaSaudi ArabiaScotlandSenegalSerbiaSierra LeoneSingaporeSomaliaSouth AfricaSouth AmericaSouth Central AsiaSouth Eastern AsiaSouthern EuropeSpainSri LankaSt. Vincent and the GrenadinesSudanSwedenSwitzerlandSyriaTaiwanThailandTrinidad and TobagoTurkeyUgandaUkraineUruguayUzbekistanVenezuelaVietnamWest IndiesWestern AfricaWestern AsiaWestern EuropeYemenZaireZimbabwe
Income
Income (Families)
Income (Households)
Poverty
Poverty (Families)
Unemployment
Employment Occupations
Employment Industries
Employer Class
Commute Time
Commute Means
School Enrollment
Education by Degree Field
Occupancy
Finances
Physical Characteristics
South Carolina
Compare Cities
Comparison Subject

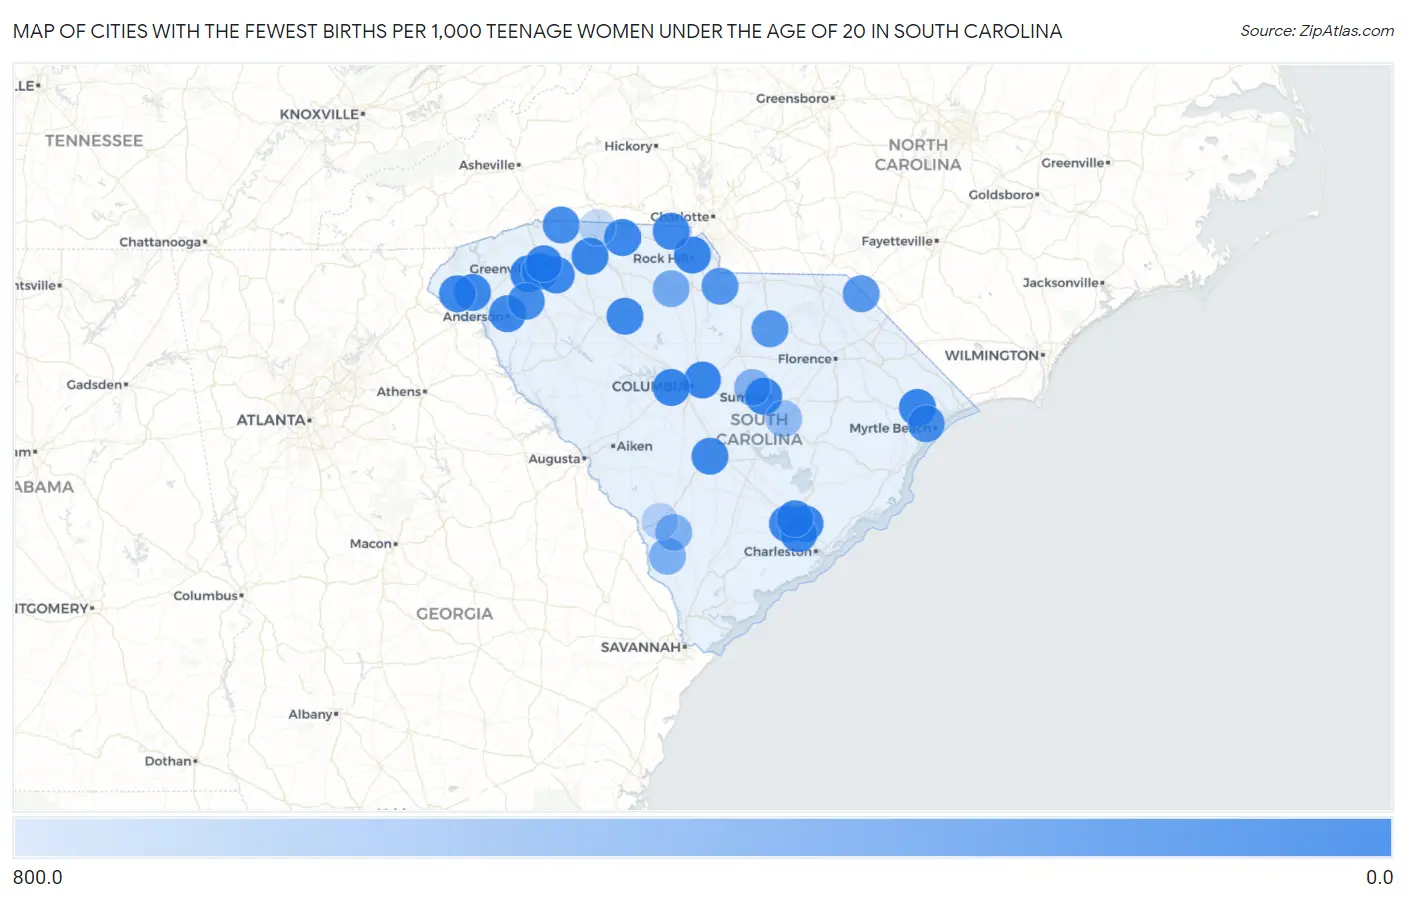
Map of Cities with the Fewest Births per 1,000 Teenage Women Under the Age of 20 in South Carolina

800.0
0.0
Cities with the Fewest Births per 1,000 Teenage Women Under the Age of 20 in South Carolina Map

Cities with the Fewest Births per 1,000 Teenage Women Under the Age of 20 in South Carolina

City Births / 1,000 Women vs State vs National
1.Rock Hill6.011.0(-5.00)#110.0(-4.00)#198
2.Welcome6.011.0(-5.00)#210.0(-4.00)#216
3.Carolina Forest7.011.0(-4.00)#310.0(-3.00)#253
4.Sumter8.011.0(-3.00)#410.0(-2.00)#290
5.Columbia10.011.0(-1.000)#510.0(=0.000)#344
6.Goose Creek11.011.0(=0.000)#610.0(+1.000)#397
7.Spartanburg11.011.0(=0.000)#710.0(+1.000)#400
8.Conway11.011.0(=0.000)#810.0(+1.000)#406
9.Lexington11.011.0(=0.000)#910.0(+1.000)#408
10.Greenville20.011.0(+9.00)#1010.0(+10.00)#681
11.Gaffney24.011.0(+13.0)#1110.0(+14.0)#791
12.Summerville25.011.0(+14.0)#1210.0(+15.0)#804
13.Five Forks30.011.0(+19.0)#1310.0(+20.0)#919
14.Seneca32.011.0(+21.0)#1410.0(+22.0)#958
15.North Charleston35.011.0(+24.0)#1510.0(+25.0)#993
16.Anderson35.011.0(+24.0)#1610.0(+25.0)#1,002
17.Wade Hampton35.011.0(+24.0)#1710.0(+25.0)#1,009
18.Orangeburg35.011.0(+24.0)#1810.0(+25.0)#1,013
19.Whitmire37.011.0(+26.0)#1910.0(+27.0)#1,049
20.Westminster38.011.0(+27.0)#2010.0(+28.0)#1,062
21.Clover45.011.0(+34.0)#2110.0(+35.0)#1,148
22.Sangaree48.011.0(+37.0)#2210.0(+38.0)#1,186
23.Landrum78.011.0(+67.0)#2310.0(+68.0)#1,453
24.Williamston85.011.0(+74.0)#2410.0(+75.0)#1,505
25.Forestbrook99.011.0(+88.0)#2510.0(+89.0)#1,587
26.Lancaster158.011.0(+147)#2610.0(+148)#1,867
27.Bethune182.011.0(+171)#2710.0(+172)#1,946
28.Mccoll185.011.0(+174)#2810.0(+175)#1,954
29.East Camden324.011.0(+313)#2910.0(+314)#2,169
30.Chester333.011.0(+322)#3010.0(+323)#2,173
31.Estill375.011.0(+364)#3110.0(+365)#2,217
32.Brunson400.011.0(+389)#3210.0(+390)#2,235
33.Oakland411.011.0(+400)#3310.0(+401)#2,246
34.La France470.011.0(+459)#3410.0(+460)#2,280
35.Alcolu500.011.0(+489)#3510.0(+490)#2,289
36.Allendale677.011.0(+666)#3610.0(+667)#2,350
37.Chesnee700.011.0(+689)#3710.0(+690)#2,353

Common Questions

What are the Top 10 Cities with the Fewest Births per 1,000 Teenage Women Under the Age of 20 in South Carolina?
Top 10 Cities with the Fewest Births per 1,000 Teenage Women Under the Age of 20 in South Carolina are:
What city has the Fewest Births per 1,000 Teenage Women Under the Age of 20 in South Carolina?
Rock Hill has the Fewest Births per 1,000 Teenage Women Under the Age of 20 in South Carolina with 6.0.
What is the Number of Births per 1,000 Teenage Women Under the Age of 20 in the State of South Carolina?
Number of Births per 1,000 Teenage Women Under the Age of 20 in South Carolina is 11.0.
What is the Number of Births per 1,000 Teenage Women Under the Age of 20 in the United States?
Number of Births per 1,000 Teenage Women Under the Age of 20 in the United States is 10.0.