Cities with the Fewest Births per 1,000 Teenage Women Under the Age of 20 in New York

RELATED REPORTS & OPTIONS

Lowest Birth Rate | Women 15-19
Population
Families and Households
Female Fertility
Female Fertility (Unmarried)
Race (Community Size)
Race (Percentage)
Ancestry (Community Size)
AfghanAfricanAlaska NativeAlaskan AthabascanAlbanianAleutAlsatianAmericanApacheArabArapahoArgentineanArmenianAssyrian / Chaldean / SyriacAustralianAustrianBahamianBangladeshiBarbadianBasqueBelgianBelizeanBermudanBhutaneseBlackfeetBolivianBrazilianBritishBritish West IndianBulgarianBurmeseCajunCambodianCanadianCape VerdeanCarpatho RusynCelticCentral AmericanCentral American IndianCherokeeCheyenneChickasawChileanChineseChippewaChoctawColombianColvilleComancheCosta RicanCreeCreekCroatianCrowCubanCypriotCzechCzechoslovakianDanishDelawareDominicanDutchDutch West IndianEastern EuropeanEcuadorianEgyptianEnglishEstonianEthiopianEuropeanFijianFilipinoFinnishFrenchFrench American IndianFrench CanadianGermanGerman RussianGhanaianGreekGuamanian / ChamorroGuatemalanGuyaneseHaitianHmongHonduranHopiHoumaHungarianIcelanderIndian (Asian)IndonesianInupiatIranianIraqiIrishIroquoisIsraeliItalianJamaicanJapaneseJordanianKenyanKiowaKoreanLaotianLatvianLebaneseLiberianLithuanianLumbeeLuxembourgerMacedonianMalaysianMalteseMarshalleseMenomineeMexicanMexican American IndianMongolianMoroccanNative HawaiianNavajoNepaleseNew ZealanderNicaraguanNigerianNorthern EuropeanNorwegianOkinawanOsageOttawaPaiutePakistaniPalestinianPanamanianParaguayanPennsylvania GermanPeruvianPimaPolishPortuguesePotawatomiPuebloPuerto RicanPuget Sound SalishRomanianRussianSalvadoranSamoanScandinavianScotch-IrishScottishSeminoleSenegaleseSerbianShoshoneSierra LeoneanSiouxSlavicSlovakSloveneSomaliSouth AfricanSouth AmericanSouth American IndianSoviet UnionSpaniardSpanishSpanish AmericanSpanish American IndianSri LankanSubsaharan AfricanSudaneseSwedishSwissSyrianTaiwaneseThaiTlingit-HaidaTohono O'OdhamTonganTrinidadian and TobagonianTsimshianTurkishU.S. Virgin IslanderUgandanUkrainianUruguayanUteVenezuelanVietnameseWelshWest IndianYakamaYaquiYugoslavianYumanYup'ikZimbabwean
Ancestry (Percentage)
AfghanAfricanAlaska NativeAlaskan AthabascanAlbanianAleutAlsatianAmericanApacheArabArapahoArgentineanArmenianAssyrian / Chaldean / SyriacAustralianAustrianBahamianBangladeshiBarbadianBasqueBelgianBelizeanBermudanBhutaneseBlackfeetBolivianBrazilianBritishBritish West IndianBulgarianBurmeseCajunCambodianCanadianCape VerdeanCarpatho RusynCelticCentral AmericanCentral American IndianCherokeeCheyenneChickasawChileanChineseChippewaChoctawColombianColvilleComancheCosta RicanCreeCreekCroatianCrowCubanCypriotCzechCzechoslovakianDanishDelawareDominicanDutchDutch West IndianEastern EuropeanEcuadorianEgyptianEnglishEstonianEthiopianEuropeanFijianFilipinoFinnishFrenchFrench American IndianFrench CanadianGermanGerman RussianGhanaianGreekGuamanian / ChamorroGuatemalanGuyaneseHaitianHmongHonduranHopiHoumaHungarianIcelanderIndian (Asian)IndonesianInupiatIranianIraqiIrishIroquoisIsraeliItalianJamaicanJapaneseJordanianKenyanKiowaKoreanLaotianLatvianLebaneseLiberianLithuanianLumbeeLuxembourgerMacedonianMalaysianMalteseMarshalleseMenomineeMexicanMexican American IndianMongolianMoroccanNative HawaiianNavajoNepaleseNew ZealanderNicaraguanNigerianNorthern EuropeanNorwegianOkinawanOsageOttawaPaiutePakistaniPalestinianPanamanianParaguayanPennsylvania GermanPeruvianPimaPolishPortuguesePotawatomiPuebloPuerto RicanPuget Sound SalishRomanianRussianSalvadoranSamoanScandinavianScotch-IrishScottishSeminoleSenegaleseSerbianShoshoneSierra LeoneanSiouxSlavicSlovakSloveneSomaliSouth AfricanSouth AmericanSouth American IndianSoviet UnionSpaniardSpanishSpanish AmericanSpanish American IndianSri LankanSubsaharan AfricanSudaneseSwedishSwissSyrianTaiwaneseThaiTlingit-HaidaTohono O'OdhamTonganTrinidadian and TobagonianTsimshianTurkishU.S. Virgin IslanderUgandanUkrainianUruguayanUteVenezuelanVietnameseWelshWest IndianYakamaYaquiYugoslavianYumanYup'ikZimbabwean
Immigrant Origin (Total)
AfghanistanAfricaAlbaniaArgentinaArmeniaAsiaAustraliaAustriaAzoresBahamasBangladeshBarbadosBelarusBelgiumBelizeBoliviaBosnia and HerzegovinaBrazilBulgariaBurma / MyanmarCabo VerdeCambodiaCameroonCanadaCaribbeanCentral AmericaChileChinaColombiaCongoCosta RicaCroatiaCubaCzechoslovakiaDenmarkDominicaDominican RepublicEastern AfricaEastern AsiaEastern EuropeEcuadorEgyptEl SalvadorEnglandEritreaEthiopiaEuropeFijiFranceGermanyGhanaGreeceGrenadaGuatemalaGuyanaHaitiHondurasHong KongHungaryIndiaIndonesiaIranIraqIrelandIsraelItalyJamaicaJapanJordanKazakhstanKenyaKoreaKuwaitLaosLatin AmericaLatviaLebanonLiberiaLithuaniaMalaysiaMexicoMicronesiaMiddle AfricaMoldovaMoroccoNepalNetherlandsNicaraguaNigeriaNorth MacedoniaNorthern AfricaNorthern EuropeNorwayOceaniaPakistanPanamaPeruPhilippinesPolandPortugalRomaniaRussiaSaudi ArabiaScotlandSenegalSerbiaSierra LeoneSingaporeSomaliaSouth AfricaSouth AmericaSouth Central AsiaSouth Eastern AsiaSouthern EuropeSpainSri LankaSt. Vincent and the GrenadinesSudanSwedenSwitzerlandSyriaTaiwanThailandTrinidad and TobagoTurkeyUgandaUkraineUruguayUzbekistanVenezuelaVietnamWest IndiesWestern AfricaWestern AsiaWestern EuropeYemenZaireZimbabwe
Immigrant Origin (Percentage)
AfghanistanAfricaAlbaniaArgentinaArmeniaAsiaAustraliaAustriaAzoresBahamasBangladeshBarbadosBelarusBelgiumBelizeBoliviaBosnia and HerzegovinaBrazilBulgariaBurma / MyanmarCabo VerdeCambodiaCameroonCanadaCaribbeanCentral AmericaChileChinaColombiaCongoCosta RicaCroatiaCubaCzechoslovakiaDenmarkDominicaDominican RepublicEastern AfricaEastern AsiaEastern EuropeEcuadorEgyptEl SalvadorEnglandEritreaEthiopiaEuropeFijiFranceGermanyGhanaGreeceGrenadaGuatemalaGuyanaHaitiHondurasHong KongHungaryIndiaIndonesiaIranIraqIrelandIsraelItalyJamaicaJapanJordanKazakhstanKenyaKoreaKuwaitLaosLatin AmericaLatviaLebanonLiberiaLithuaniaMalaysiaMexicoMicronesiaMiddle AfricaMoldovaMoroccoNepalNetherlandsNicaraguaNigeriaNorth MacedoniaNorthern AfricaNorthern EuropeNorwayOceaniaPakistanPanamaPeruPhilippinesPolandPortugalRomaniaRussiaSaudi ArabiaScotlandSenegalSerbiaSierra LeoneSingaporeSomaliaSouth AfricaSouth AmericaSouth Central AsiaSouth Eastern AsiaSouthern EuropeSpainSri LankaSt. Vincent and the GrenadinesSudanSwedenSwitzerlandSyriaTaiwanThailandTrinidad and TobagoTurkeyUgandaUkraineUruguayUzbekistanVenezuelaVietnamWest IndiesWestern AfricaWestern AsiaWestern EuropeYemenZaireZimbabwe
Income
Income (Families)
Income (Households)
Poverty
Poverty (Families)
Unemployment
Employment Occupations
Employment Industries
Employer Class
Commute Time
Commute Means
School Enrollment
Education by Degree Field
Occupancy
Finances
Physical Characteristics
New York
Compare Cities
Comparison Subject

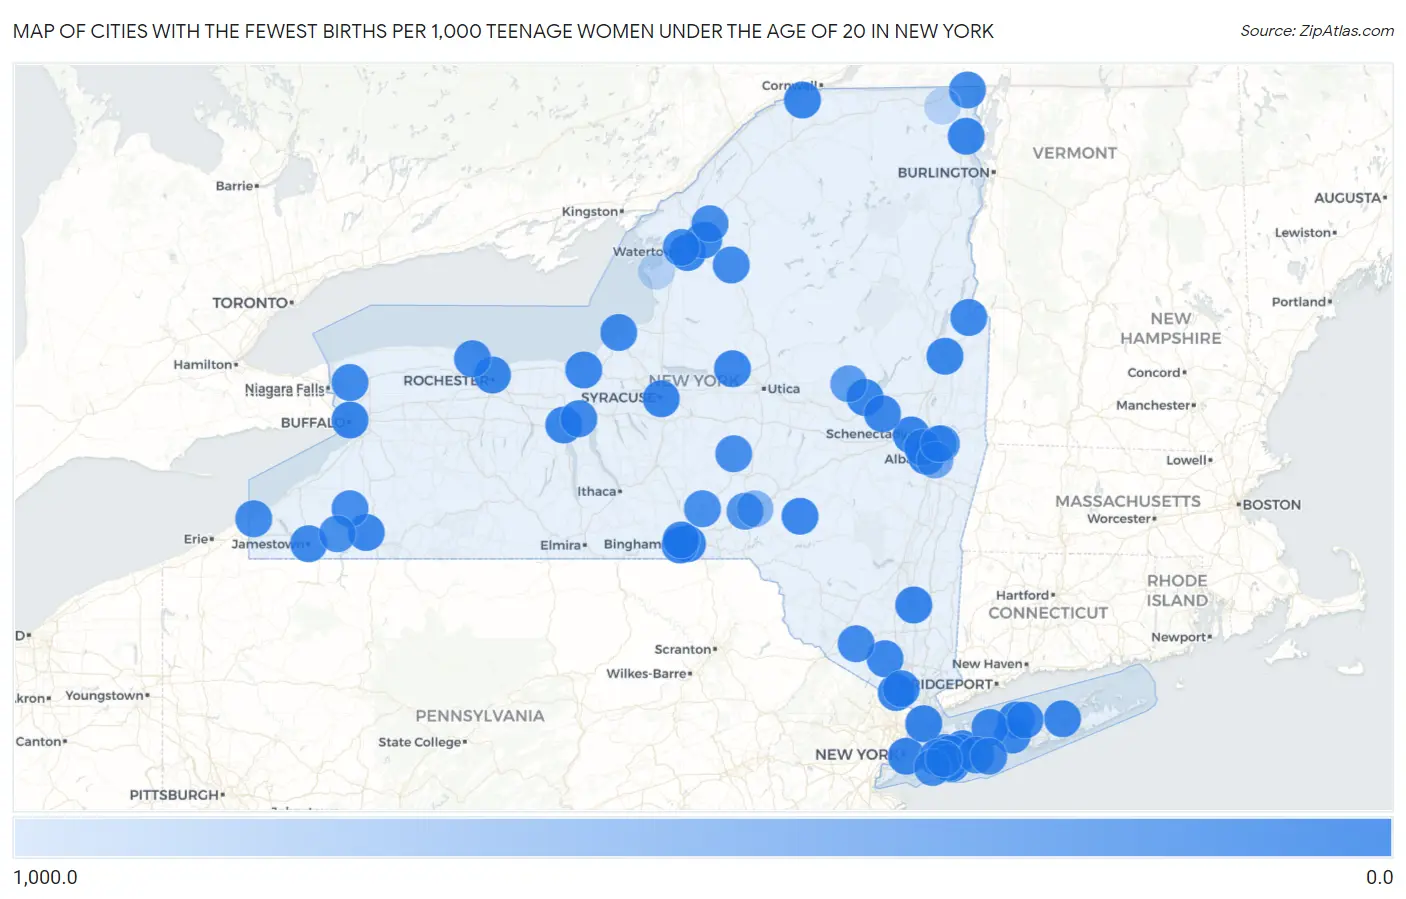
Map of Cities with the Fewest Births per 1,000 Teenage Women Under the Age of 20 in New York

1,000.0
0.0
Cities with the Fewest Births per 1,000 Teenage Women Under the Age of 20 in New York Map

Cities with the Fewest Births per 1,000 Teenage Women Under the Age of 20 in New York

City Births / 1,000 Women vs State vs National
1.Syracuse4.07.0(-3.00)#110.0(-6.00)#102
2.Buffalo5.07.0(-2.00)#210.0(-5.00)#142
3.Garden City5.07.0(-2.00)#310.0(-5.00)#175
4.Freeport7.07.0(=0.000)#410.0(-3.00)#246
5.Bethpage7.07.0(=0.000)#510.0(-3.00)#257
6.New York8.07.0(+1.000)#610.0(-2.00)#260
7.Mount Vernon9.07.0(+2.00)#710.0(-1.000)#318
8.Levittown9.07.0(+2.00)#810.0(-1.000)#325
9.Schenectady10.07.0(+3.00)#910.0(=0.000)#354
10.Poughkeepsie10.07.0(+3.00)#1010.0(=0.000)#364
11.Plattsburgh14.07.0(+7.00)#1110.0(+4.00)#517
12.Gloversville14.07.0(+7.00)#1210.0(+4.00)#521
13.Albany16.07.0(+9.00)#1310.0(+6.00)#570
14.Monsey16.07.0(+9.00)#1410.0(+6.00)#582
15.Glens Falls19.07.0(+12.0)#1510.0(+9.00)#667
16.Rochester23.07.0(+16.0)#1610.0(+13.0)#748
17.Troy23.07.0(+16.0)#1710.0(+13.0)#753
18.Geneva23.07.0(+16.0)#1810.0(+13.0)#768
19.Watertown24.07.0(+17.0)#1910.0(+14.0)#788
20.Mount Sinai25.07.0(+18.0)#2010.0(+15.0)#815
21.Massena25.07.0(+18.0)#2110.0(+15.0)#816
22.Binghamton26.07.0(+19.0)#2210.0(+16.0)#829
23.Uniondale29.07.0(+22.0)#2310.0(+19.0)#893
24.Binghamton University31.07.0(+24.0)#2410.0(+21.0)#942
25.Rome32.07.0(+25.0)#2510.0(+22.0)#949
26.Farmingville33.07.0(+26.0)#2610.0(+23.0)#972
27.Amsterdam34.07.0(+27.0)#2710.0(+24.0)#987
28.Kiryas Joel35.07.0(+28.0)#2810.0(+25.0)#1,000
29.Delhi37.07.0(+30.0)#2910.0(+27.0)#1,047
30.Salamanca38.07.0(+31.0)#3010.0(+28.0)#1,060
31.Aquebogue41.07.0(+34.0)#3110.0(+31.0)#1,100
32.New Square42.07.0(+35.0)#3210.0(+32.0)#1,106
33.Kings Park43.07.0(+36.0)#3310.0(+33.0)#1,116
34.Wolcott45.07.0(+38.0)#3410.0(+35.0)#1,159
35.Fort Drum49.07.0(+42.0)#3510.0(+39.0)#1,196
36.Hilton53.07.0(+46.0)#3610.0(+43.0)#1,241
37.North Valley Stream54.07.0(+47.0)#3710.0(+44.0)#1,252
38.Rocky Point54.07.0(+47.0)#3810.0(+44.0)#1,254
39.Colonie57.07.0(+50.0)#3910.0(+47.0)#1,278
40.Waterloo64.07.0(+57.0)#4010.0(+54.0)#1,344
41.Whitehall65.07.0(+58.0)#4110.0(+55.0)#1,360
42.Johnson City66.07.0(+59.0)#4210.0(+56.0)#1,366
43.Sanborn72.07.0(+65.0)#4310.0(+62.0)#1,417
44.Jamestown75.07.0(+68.0)#4410.0(+65.0)#1,427
45.Oswego78.07.0(+71.0)#4510.0(+68.0)#1,448
46.Baldwin83.07.0(+76.0)#4610.0(+73.0)#1,486
47.Castorland83.07.0(+76.0)#4710.0(+73.0)#1,491
48.Middletown85.07.0(+78.0)#4810.0(+75.0)#1,499
49.Ripley94.07.0(+87.0)#4910.0(+84.0)#1,566
50.Champlain95.07.0(+88.0)#5010.0(+85.0)#1,572
51.West Babylon110.07.0(+103)#5110.0(+100.0)#1,651
52.Philadelphia115.07.0(+108)#5210.0(+105)#1,696
53.West Bay Shore120.07.0(+113)#5310.0(+110)#1,711
54.Cattaraugus120.07.0(+113)#5410.0(+110)#1,715
55.Sherburne121.07.0(+114)#5510.0(+111)#1,719
56.Glen Park125.07.0(+118)#5610.0(+115)#1,736
57.Inwood129.07.0(+122)#5710.0(+119)#1,751
58.Greene132.07.0(+125)#5810.0(+122)#1,763
59.Randolph158.07.0(+151)#5910.0(+148)#1,872
60.Sidney192.07.0(+185)#6010.0(+182)#1,973
61.Caroga Lake280.07.0(+273)#6110.0(+270)#2,135
62.Lakeview417.07.0(+410)#6210.0(+407)#2,250
63.Rensselaer452.07.0(+445)#6310.0(+442)#2,274
64.Unadilla625.07.0(+618)#6410.0(+615)#2,333
65.Green Island694.07.0(+687)#6510.0(+684)#2,352
66.Altona1,000.07.0(+993)#6610.0(+990)#2,391
67.Henderson1,000.07.0(+993)#6710.0(+990)#2,409

Common Questions

What are the Top 10 Cities with the Fewest Births per 1,000 Teenage Women Under the Age of 20 in New York?
Top 10 Cities with the Fewest Births per 1,000 Teenage Women Under the Age of 20 in New York are:
What city has the Fewest Births per 1,000 Teenage Women Under the Age of 20 in New York?
Syracuse has the Fewest Births per 1,000 Teenage Women Under the Age of 20 in New York with 4.0.
What is the Number of Births per 1,000 Teenage Women Under the Age of 20 in the State of New York?
Number of Births per 1,000 Teenage Women Under the Age of 20 in New York is 7.0.
What is the Number of Births per 1,000 Teenage Women Under the Age of 20 in the United States?
Number of Births per 1,000 Teenage Women Under the Age of 20 in the United States is 10.0.