Cities with the Fewest Births per 1,000 Teenage Women Under the Age of 20 in Missouri
RELATED REPORTS & OPTIONS
Lowest Birth Rate | Women 15-19
Missouri
Compare Cities
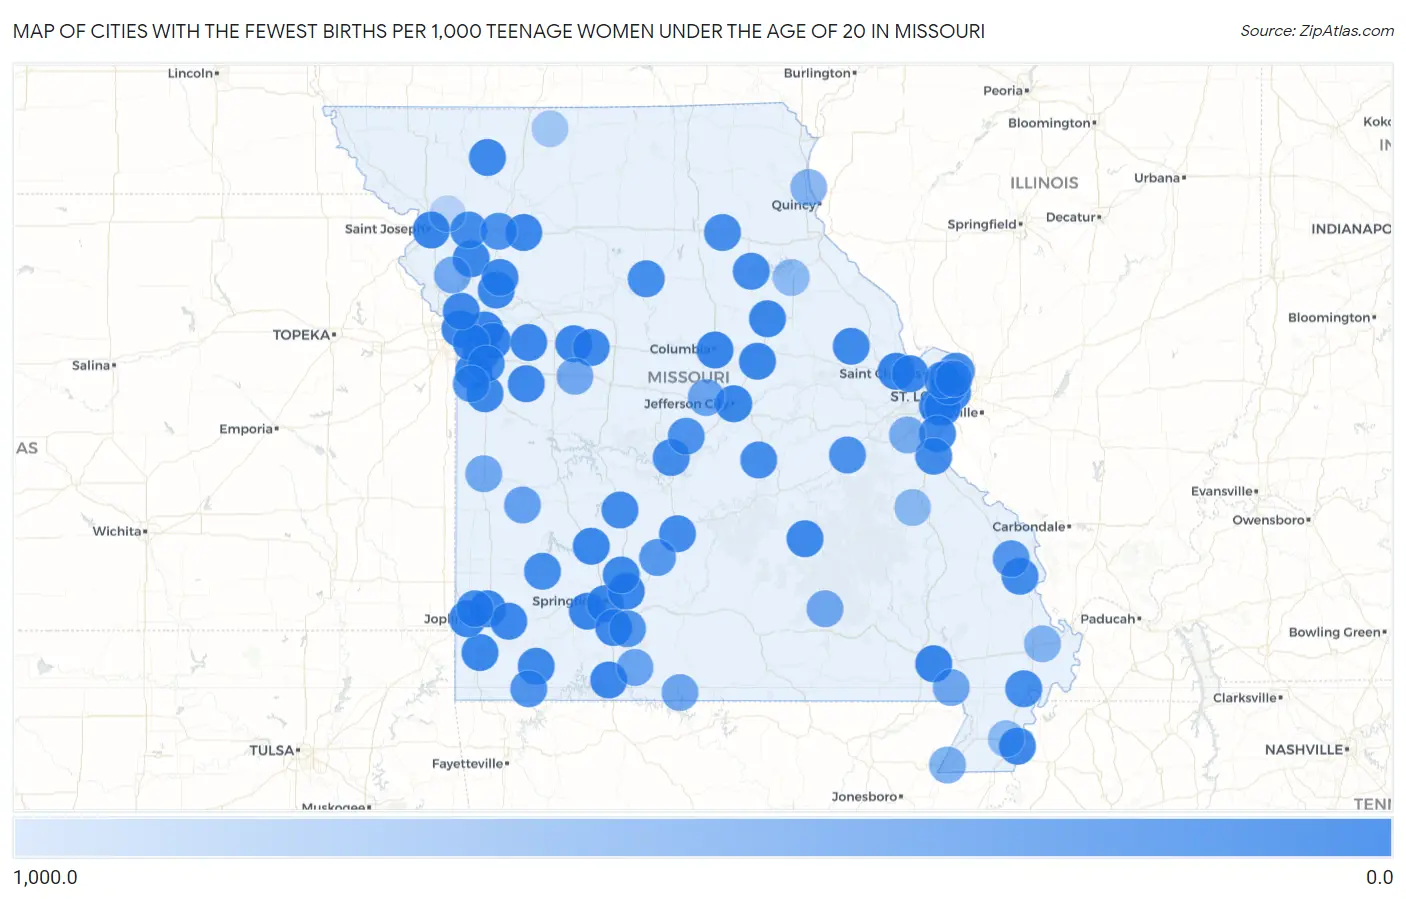
Map of Cities with the Fewest Births per 1,000 Teenage Women Under the Age of 20 in Missouri
1,000.0
0.0
Cities with the Fewest Births per 1,000 Teenage Women Under the Age of 20 in Missouri
| City | Births / 1,000 Women | vs State | vs National | |
| 1. | Lee S Summit | 1.0 | 11.0(-10.00)#1 | 10.0(-9.00)#11 |
| 2. | Independence | 2.0 | 11.0(-9.00)#2 | 10.0(-8.00)#35 |
| 3. | Republic | 2.0 | 11.0(-9.00)#3 | 10.0(-8.00)#54 |
| 4. | Columbia | 3.0 | 11.0(-8.00)#4 | 10.0(-7.00)#64 |
| 5. | Springfield | 5.0 | 11.0(-6.00)#5 | 10.0(-5.00)#146 |
| 6. | O Fallon | 5.0 | 11.0(-6.00)#6 | 10.0(-5.00)#157 |
| 7. | Poplar Bluff | 5.0 | 11.0(-6.00)#7 | 10.0(-5.00)#177 |
| 8. | Crestwood | 6.0 | 11.0(-5.00)#8 | 10.0(-4.00)#215 |
| 9. | Kansas City | 7.0 | 11.0(-4.00)#9 | 10.0(-3.00)#219 |
| 10. | St Louis | 7.0 | 11.0(-4.00)#10 | 10.0(-3.00)#222 |
| 11. | St Joseph | 8.0 | 11.0(-3.00)#11 | 10.0(-2.00)#276 |
| 12. | Blue Springs | 8.0 | 11.0(-3.00)#12 | 10.0(-2.00)#281 |
| 13. | Fulton | 11.0 | 11.0(=0.000)#13 | 10.0(+1.000)#416 |
| 14. | Bolivar | 11.0 | 11.0(=0.000)#14 | 10.0(+1.000)#418 |
| 15. | Raymore | 14.0 | 11.0(+3.00)#15 | 10.0(+4.00)#513 |
| 16. | Jefferson City | 15.0 | 11.0(+4.00)#16 | 10.0(+5.00)#544 |
| 17. | Mexico | 16.0 | 11.0(+5.00)#17 | 10.0(+6.00)#584 |
| 18. | Plattsburg | 18.0 | 11.0(+7.00)#18 | 10.0(+8.00)#647 |
| 19. | Neosho | 19.0 | 11.0(+8.00)#19 | 10.0(+9.00)#669 |
| 20. | Excelsior Springs | 22.0 | 11.0(+11.0)#20 | 10.0(+12.0)#743 |
| 21. | Joplin | 24.0 | 11.0(+13.0)#21 | 10.0(+14.0)#781 |
| 22. | Odessa | 26.0 | 11.0(+15.0)#22 | 10.0(+16.0)#844 |
| 23. | Strafford | 26.0 | 11.0(+15.0)#23 | 10.0(+16.0)#846 |
| 24. | Concordia | 26.0 | 11.0(+15.0)#24 | 10.0(+16.0)#847 |
| 25. | St Peters | 29.0 | 11.0(+18.0)#25 | 10.0(+19.0)#890 |
| 26. | Hamilton | 29.0 | 11.0(+18.0)#26 | 10.0(+19.0)#904 |
| 27. | Raytown | 30.0 | 11.0(+19.0)#27 | 10.0(+20.0)#916 |
| 28. | Affton | 31.0 | 11.0(+20.0)#28 | 10.0(+21.0)#940 |
| 29. | Holden | 31.0 | 11.0(+20.0)#29 | 10.0(+21.0)#946 |
| 30. | Carthage | 32.0 | 11.0(+21.0)#30 | 10.0(+22.0)#953 |
| 31. | Branson | 32.0 | 11.0(+21.0)#31 | 10.0(+22.0)#956 |
| 32. | Ozark | 36.0 | 11.0(+25.0)#32 | 10.0(+26.0)#1,025 |
| 33. | Sarcoxie | 38.0 | 11.0(+27.0)#33 | 10.0(+28.0)#1,064 |
| 34. | Salem | 44.0 | 11.0(+33.0)#34 | 10.0(+34.0)#1,138 |
| 35. | Imperial | 47.0 | 11.0(+36.0)#35 | 10.0(+37.0)#1,172 |
| 36. | Pine Lawn | 47.0 | 11.0(+36.0)#36 | 10.0(+37.0)#1,173 |
| 37. | Harrisonville | 48.0 | 11.0(+37.0)#37 | 10.0(+38.0)#1,183 |
| 38. | Albany | 48.0 | 11.0(+37.0)#38 | 10.0(+38.0)#1,191 |
| 39. | Fair Grove | 49.0 | 11.0(+38.0)#39 | 10.0(+39.0)#1,202 |
| 40. | Gladstone | 52.0 | 11.0(+41.0)#40 | 10.0(+42.0)#1,223 |
| 41. | Butterfield | 53.0 | 11.0(+42.0)#41 | 10.0(+43.0)#1,249 |
| 42. | Lawson | 54.0 | 11.0(+43.0)#42 | 10.0(+44.0)#1,256 |
| 43. | Caruthersville | 55.0 | 11.0(+44.0)#43 | 10.0(+45.0)#1,260 |
| 44. | Hawk Point | 69.0 | 11.0(+58.0)#44 | 10.0(+59.0)#1,394 |
| 45. | Sweet Springs | 73.0 | 11.0(+62.0)#45 | 10.0(+63.0)#1,422 |
| 46. | Stewartsville | 80.0 | 11.0(+69.0)#46 | 10.0(+70.0)#1,469 |
| 47. | Greenwood | 82.0 | 11.0(+71.0)#47 | 10.0(+72.0)#1,481 |
| 48. | Festus | 89.0 | 11.0(+78.0)#48 | 10.0(+79.0)#1,531 |
| 49. | Paris | 91.0 | 11.0(+80.0)#49 | 10.0(+81.0)#1,544 |
| 50. | Urbana | 91.0 | 11.0(+80.0)#50 | 10.0(+81.0)#1,546 |
| 51. | Jackson | 92.0 | 11.0(+81.0)#51 | 10.0(+82.0)#1,551 |
| 52. | Lebanon | 92.0 | 11.0(+81.0)#52 | 10.0(+82.0)#1,552 |
| 53. | Greenfield | 100.0 | 11.0(+89.0)#53 | 10.0(+90.0)#1,594 |
| 54. | Keytesville | 100.0 | 11.0(+89.0)#54 | 10.0(+90.0)#1,597 |
| 55. | Carterville | 102.0 | 11.0(+91.0)#55 | 10.0(+92.0)#1,607 |
| 56. | Village Of Four Seasons | 102.0 | 11.0(+91.0)#56 | 10.0(+92.0)#1,608 |
| 57. | Vienna | 107.0 | 11.0(+96.0)#57 | 10.0(+97.0)#1,636 |
| 58. | Lilbourn | 108.0 | 11.0(+97.0)#58 | 10.0(+98.0)#1,644 |
| 59. | Clarence | 111.0 | 11.0(+100.0)#59 | 10.0(+101)#1,665 |
| 60. | Spanish Lake | 119.0 | 11.0(+108)#60 | 10.0(+109)#1,710 |
| 61. | Ferguson | 142.0 | 11.0(+131)#61 | 10.0(+132)#1,796 |
| 62. | Sullivan | 160.0 | 11.0(+149)#62 | 10.0(+150)#1,879 |
| 63. | Eldon | 163.0 | 11.0(+152)#63 | 10.0(+153)#1,888 |
| 64. | Cameron | 170.0 | 11.0(+159)#64 | 10.0(+160)#1,914 |
| 65. | Washburn | 190.0 | 11.0(+179)#65 | 10.0(+180)#1,968 |
| 66. | Kinloch | 200.0 | 11.0(+189)#66 | 10.0(+190)#2,004 |
| 67. | Sparta | 214.0 | 11.0(+203)#67 | 10.0(+204)#2,024 |
| 68. | Peculiar | 221.0 | 11.0(+210)#68 | 10.0(+211)#2,038 |
| 69. | Oak Ridge | 231.0 | 11.0(+220)#69 | 10.0(+221)#2,064 |
| 70. | Conway | 250.0 | 11.0(+239)#70 | 10.0(+240)#2,086 |
| 71. | Bellefontaine Neighbors | 272.0 | 11.0(+261)#71 | 10.0(+262)#2,116 |
| 72. | El Dorado Springs | 343.0 | 11.0(+332)#72 | 10.0(+333)#2,198 |
| 73. | Centertown | 400.0 | 11.0(+389)#73 | 10.0(+390)#2,238 |
| 74. | Taneyville | 400.0 | 11.0(+389)#74 | 10.0(+390)#2,240 |
| 75. | Qulin | 429.0 | 11.0(+418)#75 | 10.0(+419)#2,258 |
| 76. | Sundown | 433.0 | 11.0(+422)#76 | 10.0(+423)#2,263 |
| 77. | Eminence | 436.0 | 11.0(+425)#77 | 10.0(+426)#2,264 |
| 78. | Knob Noster | 449.0 | 11.0(+438)#78 | 10.0(+439)#2,271 |
| 79. | Rich Hill | 451.0 | 11.0(+440)#79 | 10.0(+441)#2,273 |
| 80. | Ridgely | 455.0 | 11.0(+444)#80 | 10.0(+445)#2,277 |
| 81. | Cedar Hill | 493.0 | 11.0(+482)#81 | 10.0(+483)#2,287 |
| 82. | Cardwell | 524.0 | 11.0(+513)#82 | 10.0(+514)#2,303 |
| 83. | La Grange | 583.0 | 11.0(+572)#83 | 10.0(+573)#2,321 |
| 84. | Bertrand | 600.0 | 11.0(+589)#84 | 10.0(+590)#2,325 |
| 85. | Leadwood | 644.0 | 11.0(+633)#85 | 10.0(+634)#2,339 |
| 86. | Perry | 667.0 | 11.0(+656)#86 | 10.0(+657)#2,344 |
| 87. | Hayti Heights | 667.0 | 11.0(+656)#87 | 10.0(+657)#2,345 |
| 88. | Cainsville | 857.0 | 11.0(+846)#88 | 10.0(+847)#2,371 |
| 89. | Cosby | 1,000.0 | 11.0(+989)#89 | 10.0(+990)#2,413 |
Common Questions
What are the Top 10 Cities with the Fewest Births per 1,000 Teenage Women Under the Age of 20 in Missouri?
Top 10 Cities with the Fewest Births per 1,000 Teenage Women Under the Age of 20 in Missouri are:
#1
0.0
#2
0.0
#3
0.0
#4
0.0
#5
0.0
#6
0.0
#7
0.0
#8
0.0
#9
0.0
#10
0.0
What city has the Fewest Births per 1,000 Teenage Women Under the Age of 20 in Missouri?
Lee s Summit has the Fewest Births per 1,000 Teenage Women Under the Age of 20 in Missouri with 1.0.
What is the Number of Births per 1,000 Teenage Women Under the Age of 20 in the State of Missouri?
Number of Births per 1,000 Teenage Women Under the Age of 20 in Missouri is 11.0.
What is the Number of Births per 1,000 Teenage Women Under the Age of 20 in the United States?
Number of Births per 1,000 Teenage Women Under the Age of 20 in the United States is 10.0.