Zip Codes with the Highest Percentage of Population with a Degree in Liberal Arts and History in Camden, NJ
RELATED REPORTS & OPTIONS
Liberal Arts and History
Camden
Compare Zip Codes
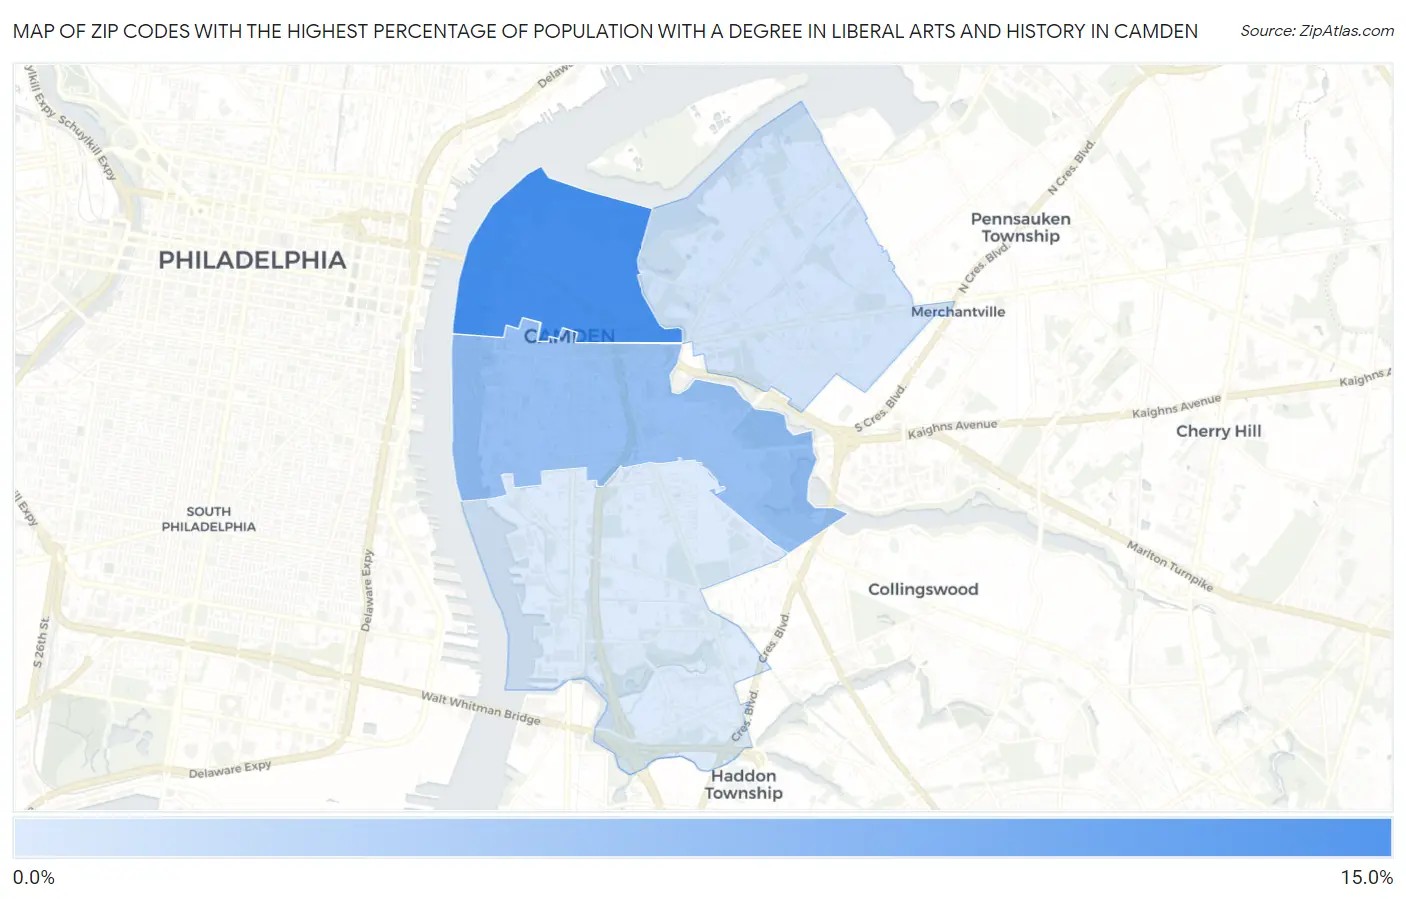
Map of Zip Codes with the Highest Percentage of Population with a Degree in Liberal Arts and History in Camden
0.073%
12.9%
Zip Codes with the Highest Percentage of Population with a Degree in Liberal Arts and History in Camden, NJ
| Zip Code | % Graduates | vs State | vs National | |
| 1. | 08102 | 12.9% | 4.6%(+8.33)#15 | 4.9%(+8.03)#1,937 |
| 2. | 08103 | 5.8% | 4.6%(+1.27)#141 | 4.9%(+0.968)#8,936 |
| 3. | 08105 | 0.95% | 4.6%(-3.62)#535 | 4.9%(-3.92)#23,469 |
| 4. | 08104 | 0.073% | 4.6%(-4.50)#542 | 4.9%(-4.80)#24,219 |
1
Common Questions
What are the Top 3 Zip Codes with the Highest Percentage of Population with a Degree in Liberal Arts and History in Camden, NJ?
Top 3 Zip Codes with the Highest Percentage of Population with a Degree in Liberal Arts and History in Camden, NJ are:
What zip code has the Highest Percentage of Population with a Degree in Liberal Arts and History in Camden, NJ?
08102 has the Highest Percentage of Population with a Degree in Liberal Arts and History in Camden, NJ with 12.9%.
What is the Percentage of Population with a Degree in Liberal Arts and History in Camden, NJ?
Percentage of Population with a Degree in Liberal Arts and History in Camden is 4.0%.
What is the Percentage of Population with a Degree in Liberal Arts and History in New Jersey?
Percentage of Population with a Degree in Liberal Arts and History in New Jersey is 4.6%.
What is the Percentage of Population with a Degree in Liberal Arts and History in the United States?
Percentage of Population with a Degree in Liberal Arts and History in the United States is 4.9%.