Zip Codes with the Highest Percentage of Population with a Degree in Liberal Arts and History in New Jersey
RELATED REPORTS & OPTIONS
Liberal Arts and History
New Jersey
Compare Zip Codes
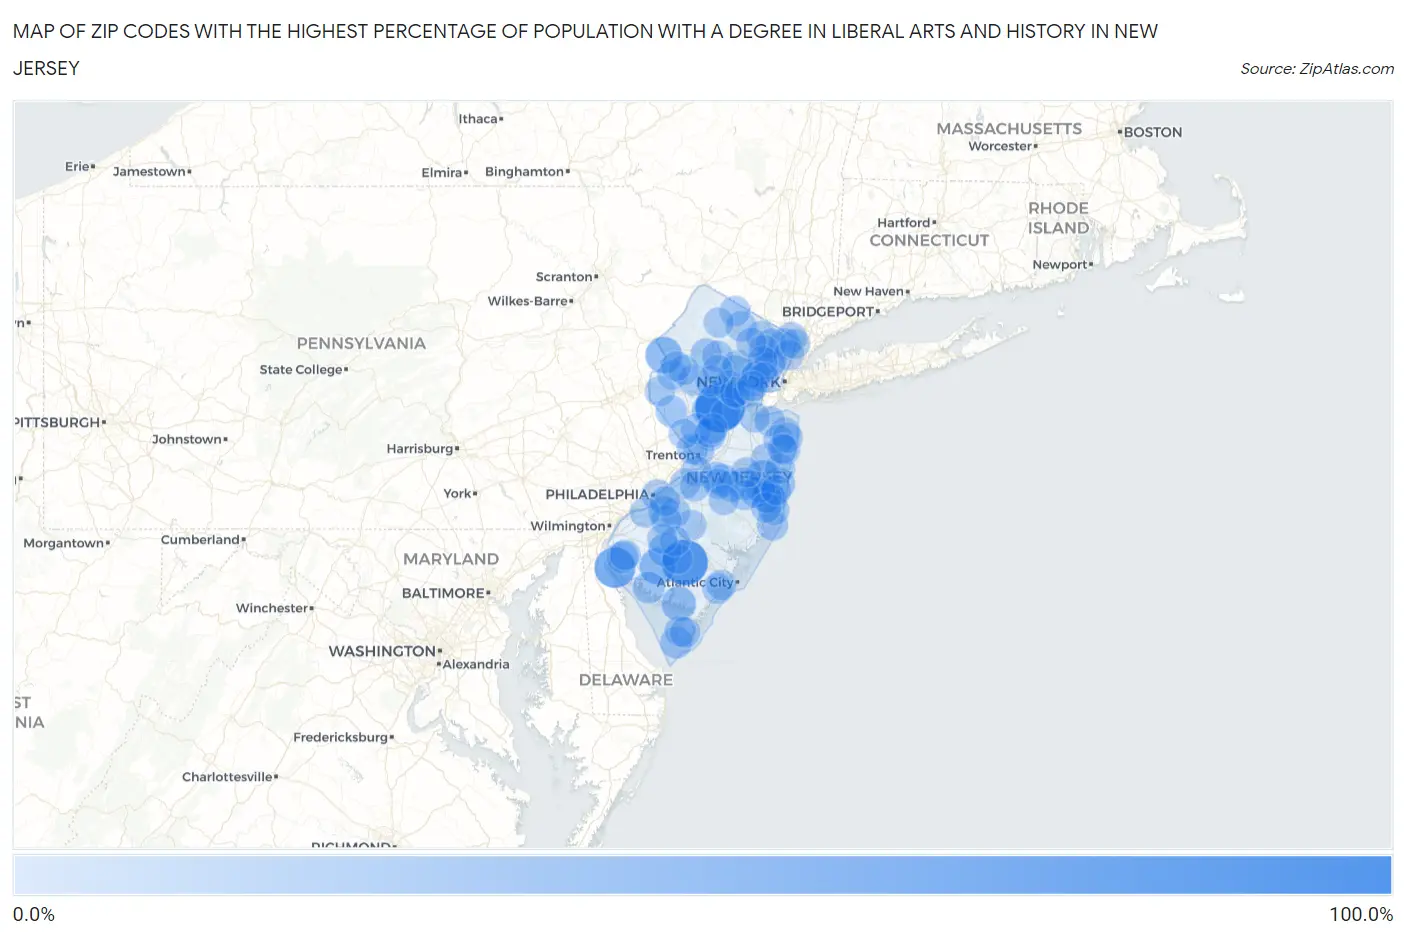
Map of Zip Codes with the Highest Percentage of Population with a Degree in Liberal Arts and History in New Jersey
0.0%
100.0%
Zip Codes with the Highest Percentage of Population with a Degree in Liberal Arts and History in New Jersey
| Zip Code | % Graduates | vs State | vs National | |
| 1. | 08890 | 100.0% | 4.6%(+95.4)#1 | 4.9%(+95.1)#42 |
| 2. | 08350 | 81.4% | 4.6%(+76.8)#2 | 4.9%(+76.5)#56 |
| 3. | 08038 | 57.1% | 4.6%(+52.6)#3 | 4.9%(+52.3)#111 |
| 4. | 07833 | 36.4% | 4.6%(+31.8)#4 | 4.9%(+31.5)#291 |
| 5. | 08352 | 36.2% | 4.6%(+31.6)#5 | 4.9%(+31.3)#294 |
| 6. | 08701 | 27.3% | 4.6%(+22.8)#6 | 4.9%(+22.4)#488 |
| 7. | 08314 | 27.1% | 4.6%(+22.5)#7 | 4.9%(+22.2)#494 |
| 8. | 08328 | 21.6% | 4.6%(+17.0)#8 | 4.9%(+16.7)#764 |
| 9. | 08738 | 18.0% | 4.6%(+13.4)#9 | 4.9%(+13.1)#1,039 |
| 10. | 08511 | 16.4% | 4.6%(+11.8)#10 | 4.9%(+11.5)#1,209 |
| 11. | 08212 | 15.4% | 4.6%(+10.9)#11 | 4.9%(+10.6)#1,335 |
| 12. | 08311 | 15.0% | 4.6%(+10.5)#12 | 4.9%(+10.2)#1,412 |
| 13. | 08733 | 14.8% | 4.6%(+10.3)#13 | 4.9%(+9.95)#1,453 |
| 14. | 07961 | 14.3% | 4.6%(+9.72)#14 | 4.9%(+9.41)#1,580 |
| 15. | 08102 | 12.9% | 4.6%(+8.33)#15 | 4.9%(+8.03)#1,937 |
| 16. | 08079 | 12.6% | 4.6%(+8.03)#16 | 4.9%(+7.72)#2,014 |
| 17. | 07980 | 12.4% | 4.6%(+7.83)#17 | 4.9%(+7.53)#2,078 |
| 18. | 08821 | 12.2% | 4.6%(+7.63)#18 | 4.9%(+7.32)#2,139 |
| 19. | 08732 | 12.1% | 4.6%(+7.57)#19 | 4.9%(+7.27)#2,159 |
| 20. | 08825 | 12.0% | 4.6%(+7.48)#20 | 4.9%(+7.18)#2,193 |
| 21. | 08542 | 12.0% | 4.6%(+7.41)#21 | 4.9%(+7.11)#2,212 |
| 22. | 08562 | 11.3% | 4.6%(+6.68)#22 | 4.9%(+6.38)#2,454 |
| 23. | 07641 | 11.0% | 4.6%(+6.39)#23 | 4.9%(+6.08)#2,579 |
| 24. | 08638 | 11.0% | 4.6%(+6.38)#24 | 4.9%(+6.08)#2,582 |
| 25. | 08628 | 10.9% | 4.6%(+6.35)#25 | 4.9%(+6.05)#2,598 |
| 26. | 08006 | 10.9% | 4.6%(+6.29)#26 | 4.9%(+5.99)#2,618 |
| 27. | 07857 | 10.8% | 4.6%(+6.22)#27 | 4.9%(+5.91)#2,653 |
| 28. | 08533 | 10.6% | 4.6%(+6.04)#28 | 4.9%(+5.74)#2,757 |
| 29. | 08740 | 10.4% | 4.6%(+5.85)#29 | 4.9%(+5.55)#2,850 |
| 30. | 07803 | 10.2% | 4.6%(+5.59)#30 | 4.9%(+5.29)#3,021 |
| 31. | 07055 | 9.9% | 4.6%(+5.29)#31 | 4.9%(+4.99)#3,185 |
| 32. | 07028 | 9.8% | 4.6%(+5.20)#32 | 4.9%(+4.90)#3,252 |
| 33. | 08029 | 9.8% | 4.6%(+5.19)#33 | 4.9%(+4.89)#3,263 |
| 34. | 08251 | 9.7% | 4.6%(+5.17)#34 | 4.9%(+4.86)#3,282 |
| 35. | 08525 | 9.6% | 4.6%(+5.06)#35 | 4.9%(+4.75)#3,352 |
| 36. | 08752 | 9.6% | 4.6%(+5.05)#36 | 4.9%(+4.75)#3,355 |
| 37. | 07647 | 9.4% | 4.6%(+4.85)#37 | 4.9%(+4.55)#3,512 |
| 38. | 08741 | 9.3% | 4.6%(+4.76)#38 | 4.9%(+4.46)#3,579 |
| 39. | 07931 | 9.3% | 4.6%(+4.68)#39 | 4.9%(+4.38)#3,644 |
| 40. | 07727 | 9.1% | 4.6%(+4.56)#40 | 4.9%(+4.26)#3,724 |
| 41. | 07480 | 9.1% | 4.6%(+4.56)#41 | 4.9%(+4.25)#3,730 |
| 42. | 08242 | 9.0% | 4.6%(+4.48)#42 | 4.9%(+4.18)#3,804 |
| 43. | 07422 | 9.0% | 4.6%(+4.45)#43 | 4.9%(+4.15)#3,827 |
| 44. | 07417 | 9.0% | 4.6%(+4.39)#44 | 4.9%(+4.09)#3,897 |
| 45. | 07014 | 8.8% | 4.6%(+4.21)#45 | 4.9%(+3.90)#4,054 |
| 46. | 08554 | 8.8% | 4.6%(+4.19)#46 | 4.9%(+3.88)#4,073 |
| 47. | 07452 | 8.8% | 4.6%(+4.18)#47 | 4.9%(+3.88)#4,074 |
| 48. | 07088 | 8.7% | 4.6%(+4.13)#48 | 4.9%(+3.82)#4,128 |
| 49. | 08072 | 8.5% | 4.6%(+3.91)#49 | 4.9%(+3.60)#4,362 |
| 50. | 07502 | 8.5% | 4.6%(+3.89)#50 | 4.9%(+3.59)#4,374 |
| 51. | 07760 | 8.2% | 4.6%(+3.63)#51 | 4.9%(+3.33)#4,655 |
| 52. | 07830 | 8.1% | 4.6%(+3.53)#52 | 4.9%(+3.22)#4,781 |
| 53. | 08004 | 8.1% | 4.6%(+3.51)#53 | 4.9%(+3.21)#4,801 |
| 54. | 08341 | 8.0% | 4.6%(+3.46)#54 | 4.9%(+3.16)#4,860 |
| 55. | 07062 | 8.0% | 4.6%(+3.40)#55 | 4.9%(+3.09)#4,941 |
| 56. | 07631 | 8.0% | 4.6%(+3.39)#56 | 4.9%(+3.09)#4,950 |
| 57. | 08757 | 7.8% | 4.6%(+3.27)#57 | 4.9%(+2.97)#5,109 |
| 58. | 08026 | 7.8% | 4.6%(+3.26)#58 | 4.9%(+2.95)#5,127 |
| 59. | 07027 | 7.8% | 4.6%(+3.23)#59 | 4.9%(+2.93)#5,173 |
| 60. | 07734 | 7.8% | 4.6%(+3.19)#60 | 4.9%(+2.88)#5,227 |
| 61. | 07043 | 7.7% | 4.6%(+3.18)#61 | 4.9%(+2.87)#5,236 |
| 62. | 08755 | 7.7% | 4.6%(+3.16)#62 | 4.9%(+2.86)#5,258 |
| 63. | 08641 | 7.7% | 4.6%(+3.14)#63 | 4.9%(+2.84)#5,287 |
| 64. | 07702 | 7.7% | 4.6%(+3.12)#64 | 4.9%(+2.82)#5,308 |
| 65. | 08244 | 7.7% | 4.6%(+3.11)#65 | 4.9%(+2.81)#5,338 |
| 66. | 08540 | 7.6% | 4.6%(+3.07)#66 | 4.9%(+2.77)#5,385 |
| 67. | 08759 | 7.5% | 4.6%(+2.94)#67 | 4.9%(+2.63)#5,574 |
| 68. | 08046 | 7.5% | 4.6%(+2.90)#68 | 4.9%(+2.59)#5,637 |
| 69. | 07981 | 7.4% | 4.6%(+2.86)#69 | 4.9%(+2.56)#5,697 |
| 70. | 08734 | 7.4% | 4.6%(+2.84)#70 | 4.9%(+2.54)#5,718 |
| 71. | 07723 | 7.4% | 4.6%(+2.79)#71 | 4.9%(+2.49)#5,785 |
| 72. | 08015 | 7.4% | 4.6%(+2.78)#72 | 4.9%(+2.48)#5,797 |
| 73. | 08221 | 7.3% | 4.6%(+2.76)#73 | 4.9%(+2.46)#5,834 |
| 74. | 08060 | 7.3% | 4.6%(+2.73)#74 | 4.9%(+2.43)#5,883 |
| 75. | 08873 | 7.2% | 4.6%(+2.64)#75 | 4.9%(+2.34)#6,035 |
| 76. | 08527 | 7.2% | 4.6%(+2.62)#76 | 4.9%(+2.32)#6,059 |
| 77. | 07069 | 7.2% | 4.6%(+2.59)#77 | 4.9%(+2.29)#6,119 |
| 78. | 08012 | 7.1% | 4.6%(+2.58)#78 | 4.9%(+2.27)#6,139 |
| 79. | 08750 | 7.1% | 4.6%(+2.58)#79 | 4.9%(+2.27)#6,140 |
| 80. | 07620 | 7.1% | 4.6%(+2.54)#80 | 4.9%(+2.24)#6,228 |
| 81. | 07750 | 7.1% | 4.6%(+2.51)#81 | 4.9%(+2.21)#6,265 |
| 82. | 08804 | 7.1% | 4.6%(+2.50)#82 | 4.9%(+2.19)#6,286 |
| 83. | 07416 | 7.1% | 4.6%(+2.49)#83 | 4.9%(+2.19)#6,288 |
| 84. | 08553 | 7.0% | 4.6%(+2.46)#84 | 4.9%(+2.16)#6,336 |
| 85. | 07079 | 7.0% | 4.6%(+2.44)#85 | 4.9%(+2.14)#6,369 |
| 86. | 07882 | 7.0% | 4.6%(+2.43)#86 | 4.9%(+2.13)#6,386 |
| 87. | 07755 | 6.9% | 4.6%(+2.38)#87 | 4.9%(+2.07)#6,474 |
| 88. | 07444 | 6.9% | 4.6%(+2.37)#88 | 4.9%(+2.07)#6,491 |
| 89. | 07865 | 6.9% | 4.6%(+2.30)#89 | 4.9%(+2.00)#6,599 |
| 90. | 07863 | 6.8% | 4.6%(+2.27)#90 | 4.9%(+1.96)#6,659 |
| 91. | 08108 | 6.8% | 4.6%(+2.25)#91 | 4.9%(+1.95)#6,694 |
| 92. | 08530 | 6.8% | 4.6%(+2.24)#92 | 4.9%(+1.94)#6,717 |
| 93. | 08094 | 6.8% | 4.6%(+2.23)#93 | 4.9%(+1.93)#6,743 |
| 94. | 07945 | 6.7% | 4.6%(+2.16)#94 | 4.9%(+1.86)#6,870 |
| 95. | 08735 | 6.7% | 4.6%(+2.15)#95 | 4.9%(+1.85)#6,892 |
| 96. | 07103 | 6.7% | 4.6%(+2.13)#96 | 4.9%(+1.82)#6,948 |
| 97. | 08879 | 6.7% | 4.6%(+2.08)#97 | 4.9%(+1.78)#7,048 |
| 98. | 08312 | 6.6% | 4.6%(+2.05)#98 | 4.9%(+1.74)#7,112 |
| 99. | 08066 | 6.6% | 4.6%(+2.04)#99 | 4.9%(+1.73)#7,131 |
| 100. | 07033 | 6.6% | 4.6%(+2.03)#100 | 4.9%(+1.72)#7,153 |
Common Questions
What are the Top 10 Zip Codes with the Highest Percentage of Population with a Degree in Liberal Arts and History in New Jersey?
Top 10 Zip Codes with the Highest Percentage of Population with a Degree in Liberal Arts and History in New Jersey are:
What zip code has the Highest Percentage of Population with a Degree in Liberal Arts and History in New Jersey?
08890 has the Highest Percentage of Population with a Degree in Liberal Arts and History in New Jersey with 100.0%.
What is the Percentage of Population with a Degree in Liberal Arts and History in the State of New Jersey?
Percentage of Population with a Degree in Liberal Arts and History in New Jersey is 4.6%.
What is the Percentage of Population with a Degree in Liberal Arts and History in the United States?
Percentage of Population with a Degree in Liberal Arts and History in the United States is 4.9%.