Cedar Glen West, NJ Map & Demographics
Cedar Glen West Map
Cedar Glen West Overview
$44,159
PER CAPITA INCOME
$70,924
AVG FAMILY INCOME
$50,365
AVG HOUSEHOLD INCOME
0.56
INEQUALITY / GINI INDEX
1,990
TOTAL POPULATION
925
MALE POPULATION
1,065
FEMALE POPULATION
86.85
MALES / 100 FEMALES
115.14
FEMALES / 100 MALES
59.6
MEDIAN AGE
2.6
AVG FAMILY SIZE
2.1
AVG HOUSEHOLD SIZE
899
LABOR FORCE [ PEOPLE ]
48.8%
PERCENT IN LABOR FORCE
4.8%
UNEMPLOYMENT RATE
Income in Cedar Glen West
Income Overview in Cedar Glen West
Per Capita Income in Cedar Glen West is $44,159, while median incomes of families and households are $70,924 and $50,365 respectively.
| Characteristic | Number | Measure |
| Per Capita Income | 1,990 | $44,159 |
| Median Family Income | 616 | $70,924 |
| Mean Family Income | 616 | $115,227 |
| Median Household Income | 927 | $50,365 |
| Mean Household Income | 927 | $92,256 |
| Income Deficit | 616 | $0 |
| Wage / Income Gap (%) | 1,990 | 0.00% |
| Wage / Income Gap ($) | 1,990 | 100.00¢ per $1 |
| Gini / Inequality Index | 1,990 | 0.56 |
Earnings by Sex in Cedar Glen West
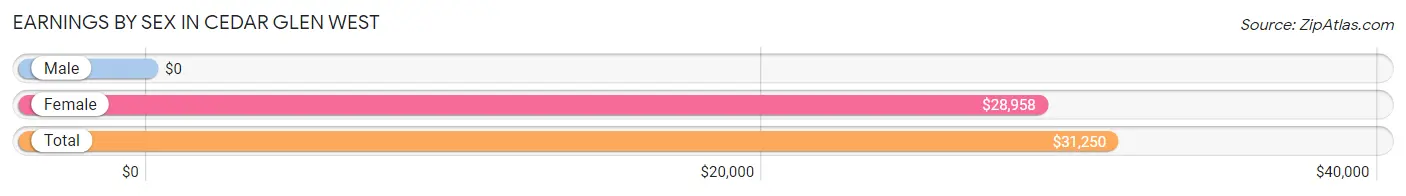
| Sex | Number | Average Earnings |
| Male | 464 (50.7%) | $0 |
| Female | 451 (49.3%) | $28,958 |
| Total | 915 (100.0%) | $31,250 |
Earnings by Sex by Income Bracket in Cedar Glen West
The most common earnings brackets in Cedar Glen West are $75,000 to $99,999 for men (138 | 29.7%) and $25,000 to $29,999 for women (152 | 33.7%).
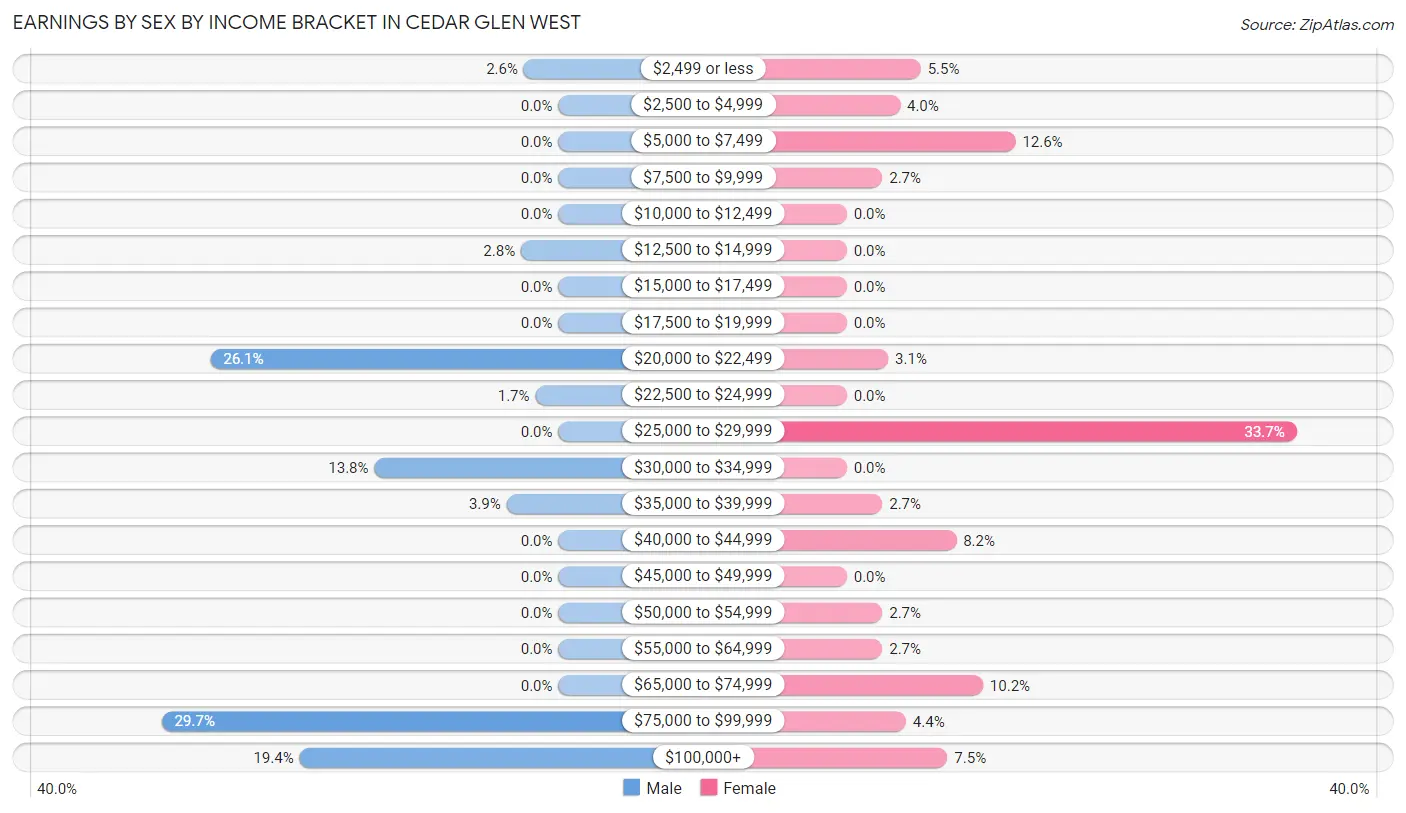
| Income | Male | Female |
| $2,499 or less | 12 (2.6%) | 25 (5.5%) |
| $2,500 to $4,999 | 0 (0.0%) | 18 (4.0%) |
| $5,000 to $7,499 | 0 (0.0%) | 57 (12.6%) |
| $7,500 to $9,999 | 0 (0.0%) | 12 (2.7%) |
| $10,000 to $12,499 | 0 (0.0%) | 0 (0.0%) |
| $12,500 to $14,999 | 13 (2.8%) | 0 (0.0%) |
| $15,000 to $17,499 | 0 (0.0%) | 0 (0.0%) |
| $17,500 to $19,999 | 0 (0.0%) | 0 (0.0%) |
| $20,000 to $22,499 | 121 (26.1%) | 14 (3.1%) |
| $22,500 to $24,999 | 8 (1.7%) | 0 (0.0%) |
| $25,000 to $29,999 | 0 (0.0%) | 152 (33.7%) |
| $30,000 to $34,999 | 64 (13.8%) | 0 (0.0%) |
| $35,000 to $39,999 | 18 (3.9%) | 12 (2.7%) |
| $40,000 to $44,999 | 0 (0.0%) | 37 (8.2%) |
| $45,000 to $49,999 | 0 (0.0%) | 0 (0.0%) |
| $50,000 to $54,999 | 0 (0.0%) | 12 (2.7%) |
| $55,000 to $64,999 | 0 (0.0%) | 12 (2.7%) |
| $65,000 to $74,999 | 0 (0.0%) | 46 (10.2%) |
| $75,000 to $99,999 | 138 (29.7%) | 20 (4.4%) |
| $100,000+ | 90 (19.4%) | 34 (7.5%) |
| Total | 464 (100.0%) | 451 (100.0%) |
Earnings by Sex by Educational Attainment in Cedar Glen West
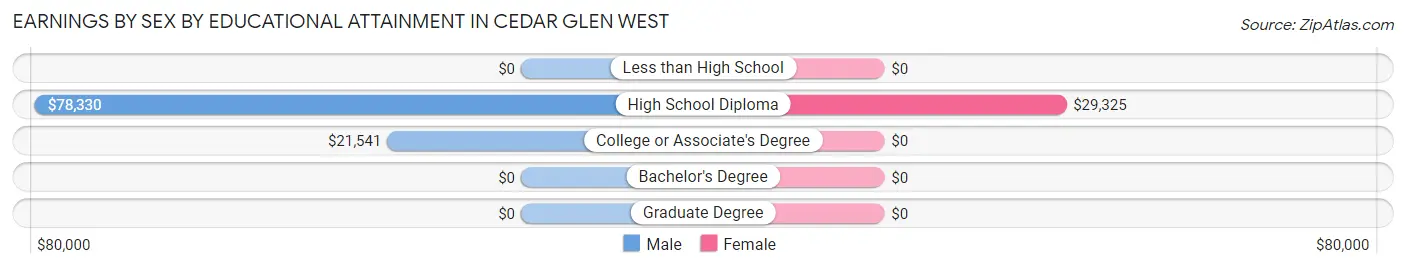
| Educational Attainment | Male Income | Female Income |
| Less than High School | - | - |
| High School Diploma | $78,330 | $29,325 |
| College or Associate's Degree | $21,541 | $0 |
| Bachelor's Degree | - | - |
| Graduate Degree | - | - |
| Total | - | - |
Family Income in Cedar Glen West
Family Income Brackets in Cedar Glen West
According to the Cedar Glen West family income data, there are 165 families falling into the $25,000 to $34,999 income range, which is the most common income bracket and makes up 26.8% of all families.
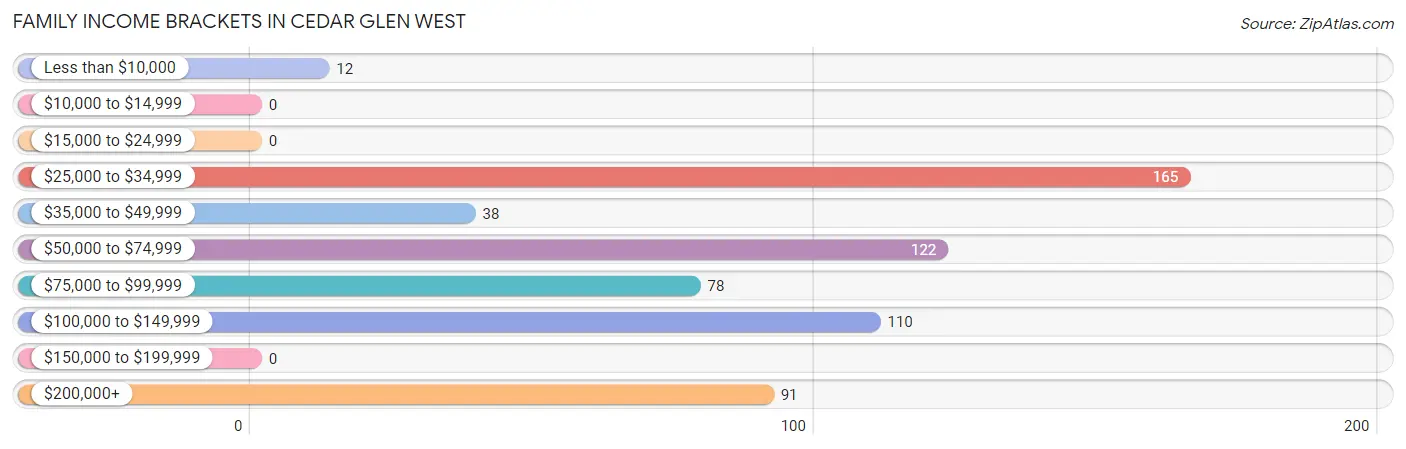
| Income Bracket | # Families | % Families |
| Less than $10,000 | 12 | 1.9% |
| $10,000 to $14,999 | 0 | 0.0% |
| $15,000 to $24,999 | 0 | 0.0% |
| $25,000 to $34,999 | 165 | 26.8% |
| $35,000 to $49,999 | 38 | 6.2% |
| $50,000 to $74,999 | 122 | 19.8% |
| $75,000 to $99,999 | 78 | 12.7% |
| $100,000 to $149,999 | 110 | 17.9% |
| $150,000 to $199,999 | 0 | 0.0% |
| $200,000+ | 91 | 14.8% |
Family Income by Famaliy Size in Cedar Glen West
3-person families (191 | 31.0%) account for the highest median family income in Cedar Glen West with $130,076 per family, while 3-person families (191 | 31.0%) have the highest median income of $43,359 per family member.
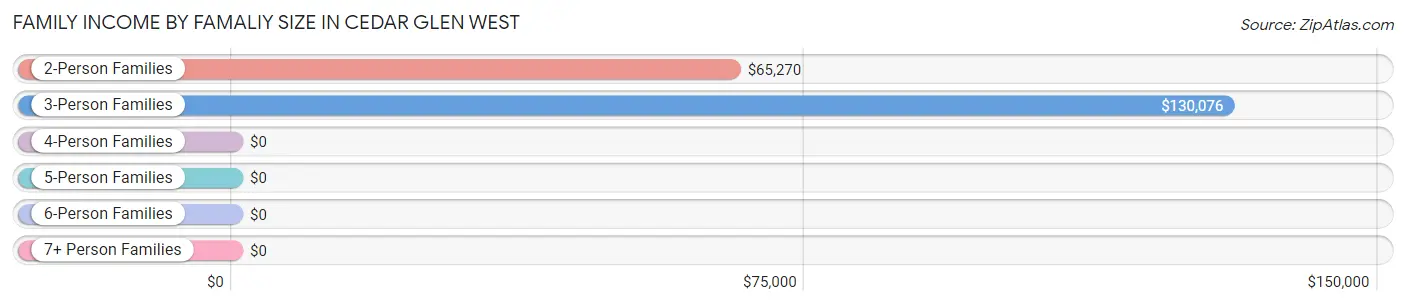
| Income Bracket | # Families | Median Income |
| 2-Person Families | 406 (65.9%) | $65,270 |
| 3-Person Families | 191 (31.0%) | $130,076 |
| 4-Person Families | 0 (0.0%) | $0 |
| 5-Person Families | 0 (0.0%) | $0 |
| 6-Person Families | 19 (3.1%) | $0 |
| 7+ Person Families | 0 (0.0%) | $0 |
| Total | 616 (100.0%) | $70,924 |
Family Income by Number of Earners in Cedar Glen West
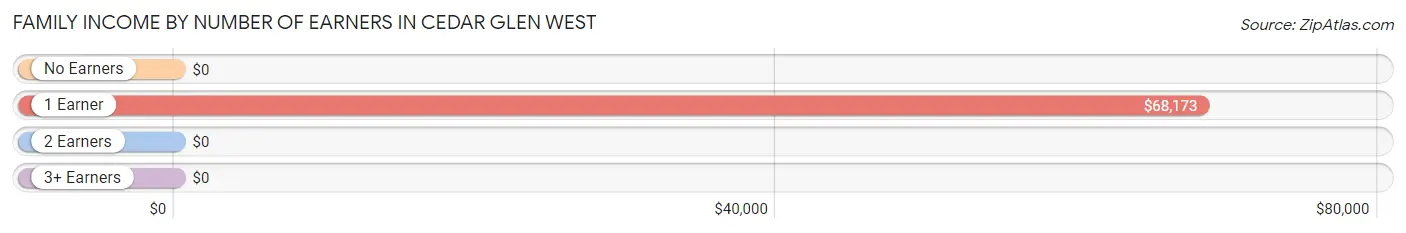
| Number of Earners | # Families | Median Income |
| No Earners | 183 (29.7%) | $0 |
| 1 Earner | 217 (35.2%) | $68,173 |
| 2 Earners | 115 (18.7%) | $0 |
| 3+ Earners | 101 (16.4%) | $0 |
| Total | 616 (100.0%) | $70,924 |
Household Income in Cedar Glen West
Household Income Brackets in Cedar Glen West
With 226 households falling in the category, the $25,000 to $34,999 income range is the most frequent in Cedar Glen West, accounting for 24.4% of all households.
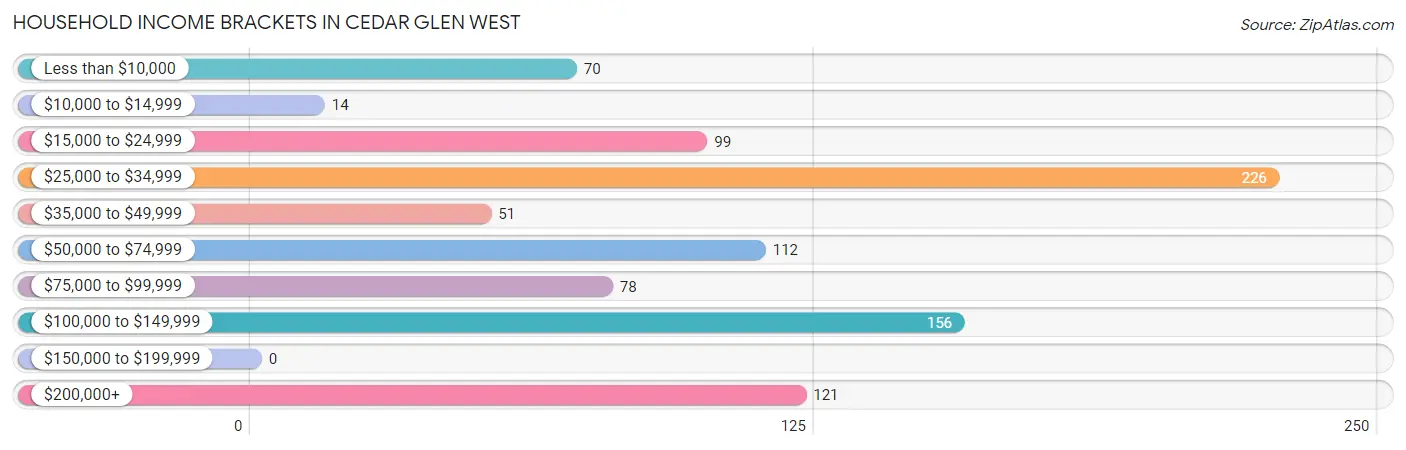
| Income Bracket | # Households | % Households |
| Less than $10,000 | 70 | 7.6% |
| $10,000 to $14,999 | 14 | 1.5% |
| $15,000 to $24,999 | 99 | 10.7% |
| $25,000 to $34,999 | 226 | 24.4% |
| $35,000 to $49,999 | 51 | 5.5% |
| $50,000 to $74,999 | 112 | 12.1% |
| $75,000 to $99,999 | 78 | 8.4% |
| $100,000 to $149,999 | 156 | 16.8% |
| $150,000 to $199,999 | 0 | 0.0% |
| $200,000+ | 121 | 13.1% |
Household Income by Householder Age in Cedar Glen West
The median household income in Cedar Glen West is $50,365, with the highest median household income of $28,148 found in the 65+ years age bracket for the primary householder. A total of 526 households (56.7%) fall into this category.
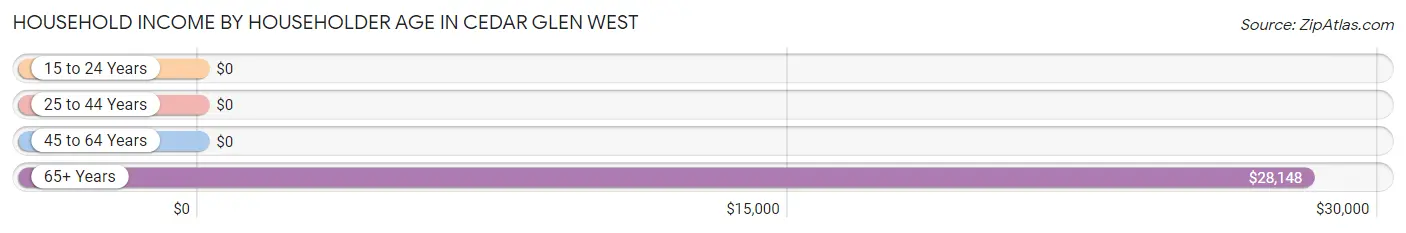
| Income Bracket | # Households | Median Income |
| 15 to 24 Years | 0 (0.0%) | $0 |
| 25 to 44 Years | 58 (6.3%) | $0 |
| 45 to 64 Years | 343 (37.0%) | $0 |
| 65+ Years | 526 (56.7%) | $28,148 |
| Total | 927 (100.0%) | $50,365 |
Poverty in Cedar Glen West
Income Below Poverty by Sex and Age in Cedar Glen West
With 2.6% poverty level for males and 11.0% for females among the residents of Cedar Glen West, 75 year old and over males and 55 to 64 year old females are the most vulnerable to poverty, with 24 males (8.8%) and 58 females (27.6%) in their respective age groups living below the poverty level.
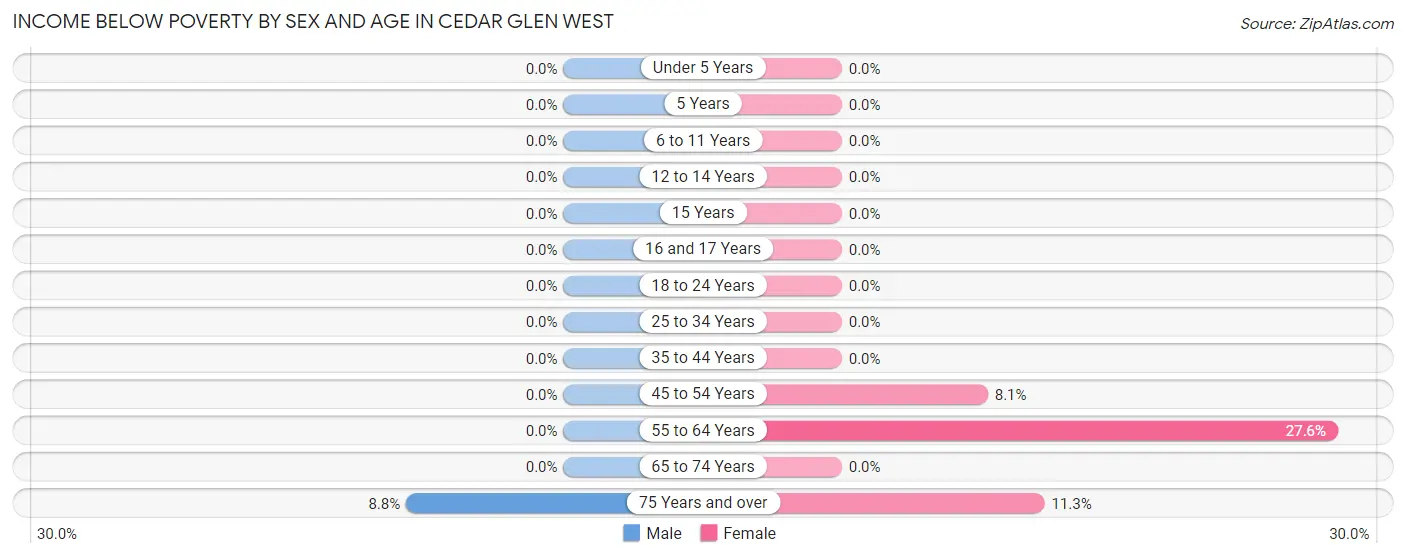
| Age Bracket | Male | Female |
| Under 5 Years | 0 (0.0%) | 0 (0.0%) |
| 5 Years | 0 (0.0%) | 0 (0.0%) |
| 6 to 11 Years | 0 (0.0%) | 0 (0.0%) |
| 12 to 14 Years | 0 (0.0%) | 0 (0.0%) |
| 15 Years | 0 (0.0%) | 0 (0.0%) |
| 16 and 17 Years | 0 (0.0%) | 0 (0.0%) |
| 18 to 24 Years | 0 (0.0%) | 0 (0.0%) |
| 25 to 34 Years | 0 (0.0%) | 0 (0.0%) |
| 35 to 44 Years | 0 (0.0%) | 0 (0.0%) |
| 45 to 54 Years | 0 (0.0%) | 17 (8.1%) |
| 55 to 64 Years | 0 (0.0%) | 58 (27.6%) |
| 65 to 74 Years | 0 (0.0%) | 0 (0.0%) |
| 75 Years and over | 24 (8.8%) | 42 (11.3%) |
| Total | 24 (2.6%) | 117 (11.0%) |
Income Above Poverty by Sex and Age in Cedar Glen West
According to the poverty statistics in Cedar Glen West, males aged under 5 years and females aged 6 to 11 years are the age groups that are most secure financially, with 100.0% of males and 100.0% of females in these age groups living above the poverty line.
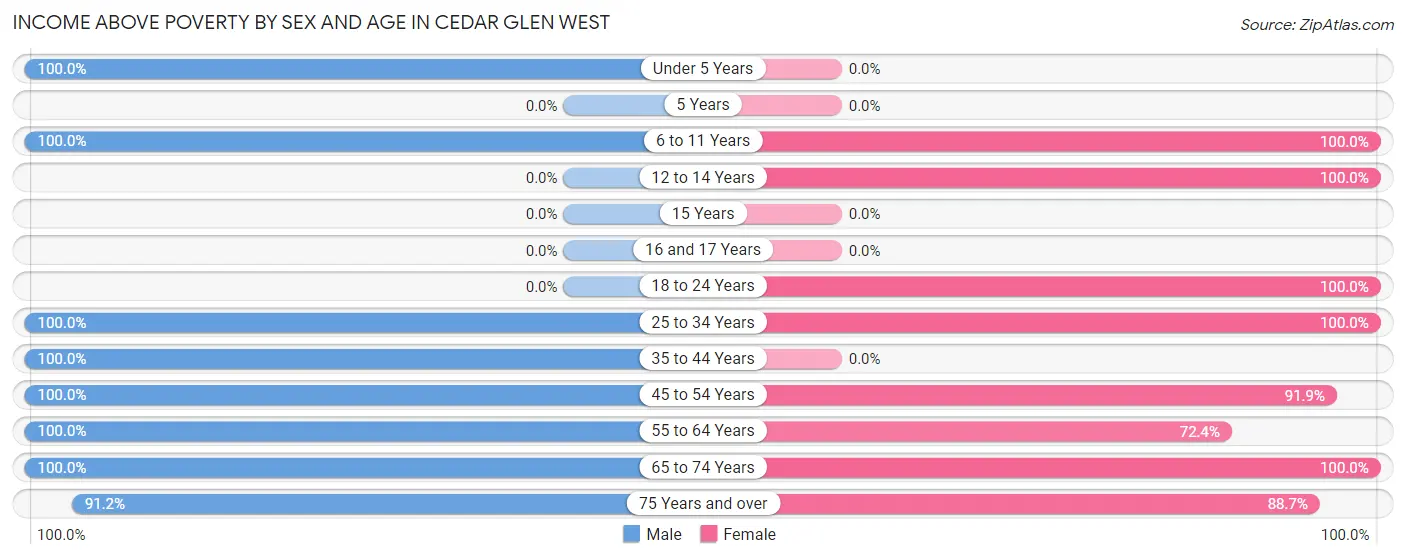
| Age Bracket | Male | Female |
| Under 5 Years | 45 (100.0%) | 0 (0.0%) |
| 5 Years | 0 (0.0%) | 0 (0.0%) |
| 6 to 11 Years | 48 (100.0%) | 37 (100.0%) |
| 12 to 14 Years | 0 (0.0%) | 18 (100.0%) |
| 15 Years | 0 (0.0%) | 0 (0.0%) |
| 16 and 17 Years | 0 (0.0%) | 0 (0.0%) |
| 18 to 24 Years | 0 (0.0%) | 80 (100.0%) |
| 25 to 34 Years | 103 (100.0%) | 78 (100.0%) |
| 35 to 44 Years | 92 (100.0%) | 0 (0.0%) |
| 45 to 54 Years | 18 (100.0%) | 192 (91.9%) |
| 55 to 64 Years | 226 (100.0%) | 152 (72.4%) |
| 65 to 74 Years | 119 (100.0%) | 61 (100.0%) |
| 75 Years and over | 250 (91.2%) | 330 (88.7%) |
| Total | 901 (97.4%) | 948 (89.0%) |
Income Below Poverty Among Married-Couple Families in Cedar Glen West
The poverty statistics for married-couple families in Cedar Glen West show that 3.1% or 12 of the total 391 families live below the poverty line. Families with no children have the highest poverty rate of 3.1%, comprising of 12 families. On the other hand, families with no children have the lowest poverty rate of 3.1%, which includes 12 families.
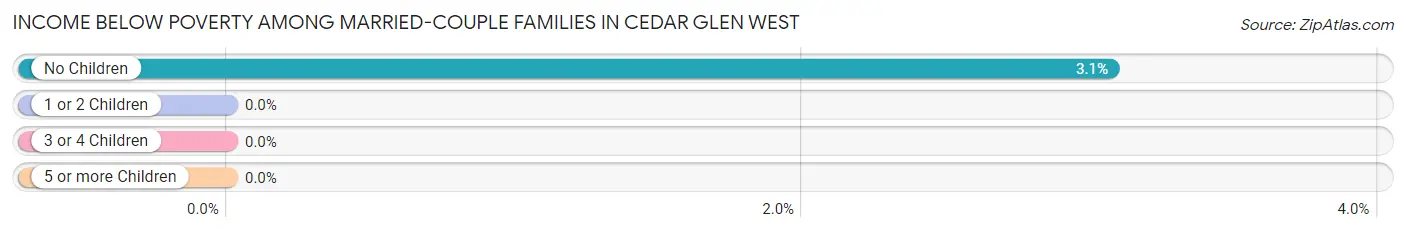
| Children | Above Poverty | Below Poverty |
| No Children | 379 (96.9%) | 12 (3.1%) |
| 1 or 2 Children | 0 (0.0%) | 0 (0.0%) |
| 3 or 4 Children | 0 (0.0%) | 0 (0.0%) |
| 5 or more Children | 0 (0.0%) | 0 (0.0%) |
| Total | 379 (96.9%) | 12 (3.1%) |
Income Below Poverty Among Single-Parent Households in Cedar Glen West
| Children | Single Father | Single Mother |
| No Children | 0 (0.0%) | 0 (0.0%) |
| 1 or 2 Children | 0 (0.0%) | 0 (0.0%) |
| 3 or 4 Children | 0 (0.0%) | 0 (0.0%) |
| 5 or more Children | 0 (0.0%) | 0 (0.0%) |
| Total | 0 (0.0%) | 0 (0.0%) |
Income Below Poverty Among Married-Couple vs Single-Parent Households in Cedar Glen West
| Children | Married-Couple Families | Single-Parent Households |
| No Children | 12 (3.1%) | 0 (0.0%) |
| 1 or 2 Children | 0 (0.0%) | 0 (0.0%) |
| 3 or 4 Children | 0 (0.0%) | 0 (0.0%) |
| 5 or more Children | 0 (0.0%) | 0 (0.0%) |
| Total | 12 (3.1%) | 0 (0.0%) |
Race in Cedar Glen West
The most populous races in Cedar Glen West are White / Caucasian (1,773 | 89.1%), Black / African American (115 | 5.8%), and Two or more Races (89 | 4.5%).
| Race | # Population | % Population |
| Asian | 13 | 0.6% |
| Black / African American | 115 | 5.8% |
| Hawaiian / Pacific | 0 | 0.0% |
| Hispanic or Latino | 0 | 0.0% |
| Native / Alaskan | 0 | 0.0% |
| White / Caucasian | 1,773 | 89.1% |
| Two or more Races | 89 | 4.5% |
| Some other Race | 0 | 0.0% |
| Total | 1,990 | 100.0% |
Ancestry in Cedar Glen West
The most populous ancestries reported in Cedar Glen West are Italian (436 | 21.9%), Latvian (285 | 14.3%), Irish (267 | 13.4%), Polish (193 | 9.7%), and Romanian (185 | 9.3%), together accounting for 68.6% of all Cedar Glen West residents.
| Ancestry | # Population | % Population |
| American | 70 | 3.5% |
| Apache | 32 | 1.6% |
| Armenian | 11 | 0.5% |
| Cree | 45 | 2.3% |
| English | 98 | 4.9% |
| European | 12 | 0.6% |
| Finnish | 35 | 1.8% |
| French Canadian | 16 | 0.8% |
| German | 181 | 9.1% |
| Greek | 131 | 6.6% |
| Indian (Asian) | 12 | 0.6% |
| Irish | 267 | 13.4% |
| Italian | 436 | 21.9% |
| Korean | 13 | 0.6% |
| Latvian | 285 | 14.3% |
| Polish | 193 | 9.7% |
| Portuguese | 12 | 0.6% |
| Romanian | 185 | 9.3% |
| Russian | 146 | 7.3% |
| Scottish | 12 | 0.6% |
| Slovak | 58 | 2.9% |
| Swedish | 13 | 0.6% | View All 22 Rows |
Immigrants in Cedar Glen West
The most numerous immigrant groups reported in Cedar Glen West came from Europe (658 | 33.1%), Eastern Europe (640 | 32.2%), Latvia (285 | 14.3%), Moldova (185 | 9.3%), and Russia (130 | 6.5%), together accounting for 95.4% of all Cedar Glen West residents.
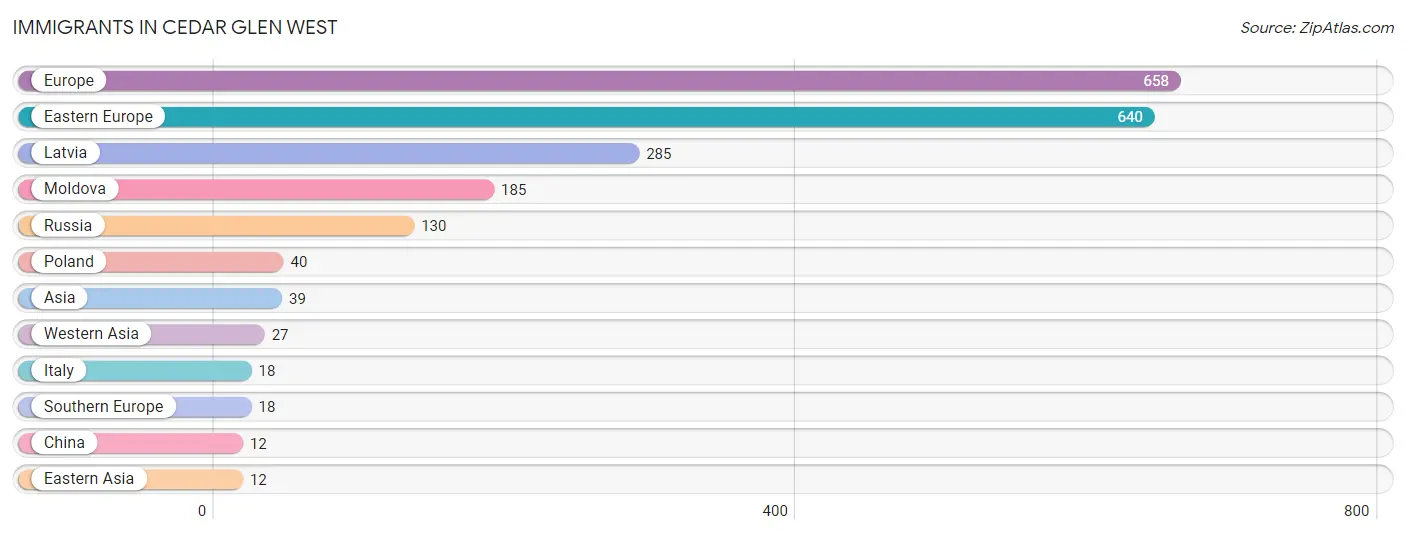
| Immigration Origin | # Population | % Population |
| Asia | 39 | 2.0% |
| China | 12 | 0.6% |
| Eastern Asia | 12 | 0.6% |
| Eastern Europe | 640 | 32.2% |
| Europe | 658 | 33.1% |
| Italy | 18 | 0.9% |
| Latvia | 285 | 14.3% |
| Moldova | 185 | 9.3% |
| Poland | 40 | 2.0% |
| Russia | 130 | 6.5% |
| Southern Europe | 18 | 0.9% |
| Western Asia | 27 | 1.4% | View All 12 Rows |
Sex and Age in Cedar Glen West
Sex and Age in Cedar Glen West
The most populous age groups in Cedar Glen West are 85 Years and over (168 | 18.2%) for men and 75 to 79 Years (266 | 25.0%) for women.
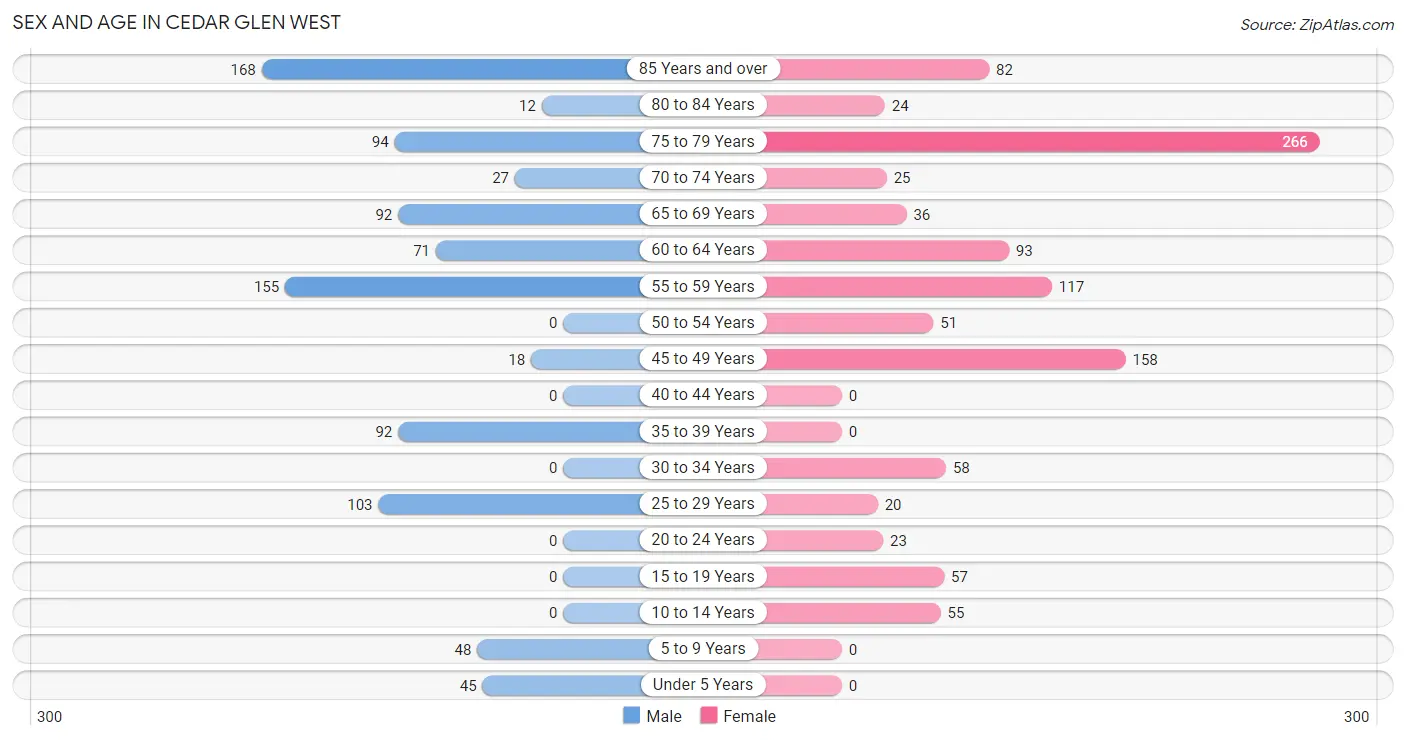
| Age Bracket | Male | Female |
| Under 5 Years | 45 (4.9%) | 0 (0.0%) |
| 5 to 9 Years | 48 (5.2%) | 0 (0.0%) |
| 10 to 14 Years | 0 (0.0%) | 55 (5.2%) |
| 15 to 19 Years | 0 (0.0%) | 57 (5.3%) |
| 20 to 24 Years | 0 (0.0%) | 23 (2.2%) |
| 25 to 29 Years | 103 (11.1%) | 20 (1.9%) |
| 30 to 34 Years | 0 (0.0%) | 58 (5.4%) |
| 35 to 39 Years | 92 (10.0%) | 0 (0.0%) |
| 40 to 44 Years | 0 (0.0%) | 0 (0.0%) |
| 45 to 49 Years | 18 (1.9%) | 158 (14.8%) |
| 50 to 54 Years | 0 (0.0%) | 51 (4.8%) |
| 55 to 59 Years | 155 (16.8%) | 117 (11.0%) |
| 60 to 64 Years | 71 (7.7%) | 93 (8.7%) |
| 65 to 69 Years | 92 (10.0%) | 36 (3.4%) |
| 70 to 74 Years | 27 (2.9%) | 25 (2.4%) |
| 75 to 79 Years | 94 (10.2%) | 266 (25.0%) |
| 80 to 84 Years | 12 (1.3%) | 24 (2.2%) |
| 85 Years and over | 168 (18.2%) | 82 (7.7%) |
| Total | 925 (100.0%) | 1,065 (100.0%) |
Families and Households in Cedar Glen West
Median Family Size in Cedar Glen West
The median family size in Cedar Glen West is 2.57 persons per family, with single female/mother families (170 | 27.6%) accounting for the largest median family size of 2.72 persons per family. On the other hand, single male/father families (55 | 8.9%) represent the smallest median family size with 2.33 persons per family.
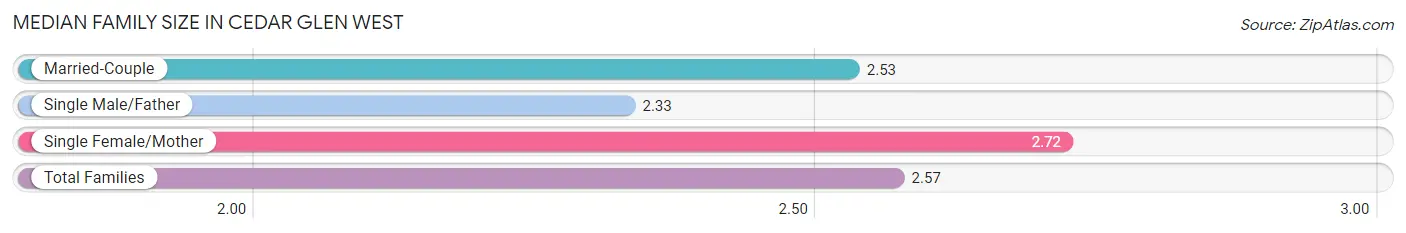
| Family Type | # Families | Family Size |
| Married-Couple | 391 (63.5%) | 2.53 |
| Single Male/Father | 55 (8.9%) | 2.33 |
| Single Female/Mother | 170 (27.6%) | 2.72 |
| Total Families | 616 (100.0%) | 2.57 |
Median Household Size in Cedar Glen West
The median household size in Cedar Glen West is 2.15 persons per household, with single female/mother households (170 | 18.3%) accounting for the largest median household size of 3.02 persons per household. non-family households (311 | 33.6%) represent the smallest median household size with 1.09 persons per household.
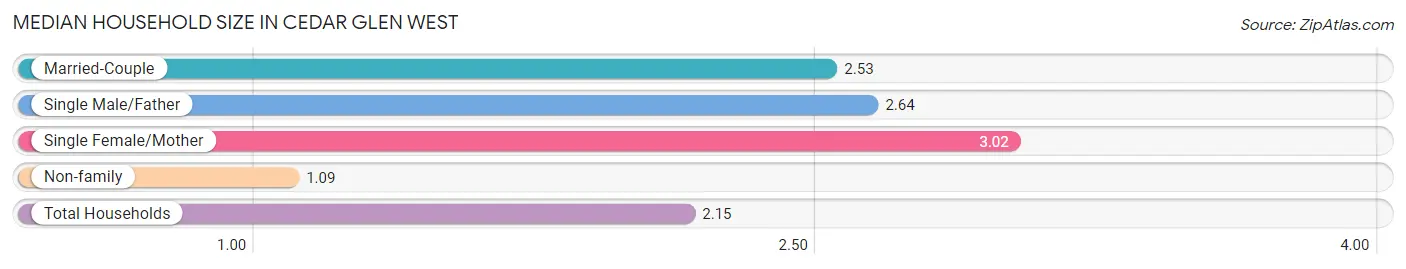
| Household Type | # Households | Household Size |
| Married-Couple | 391 (42.2%) | 2.53 |
| Single Male/Father | 55 (5.9%) | 2.64 |
| Single Female/Mother | 170 (18.3%) | 3.02 |
| Non-family | 311 (33.6%) | 1.09 |
| Total Households | 927 (100.0%) | 2.15 |
Household Size by Marriage Status in Cedar Glen West
Out of a total of 927 households in Cedar Glen West, 616 (66.4%) are family households, while 311 (33.6%) are nonfamily households. The most numerous type of family households are 2-person households, comprising 406, and the most common type of nonfamily households are 1-person households, comprising 282.
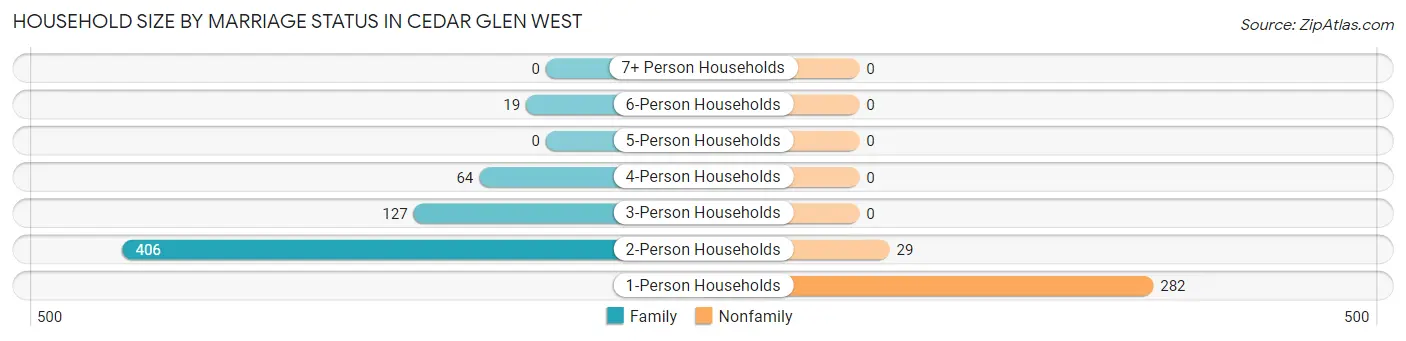
| Household Size | Family Households | Nonfamily Households |
| 1-Person Households | - | 282 (30.4%) |
| 2-Person Households | 406 (43.8%) | 29 (3.1%) |
| 3-Person Households | 127 (13.7%) | 0 (0.0%) |
| 4-Person Households | 64 (6.9%) | 0 (0.0%) |
| 5-Person Households | 0 (0.0%) | 0 (0.0%) |
| 6-Person Households | 19 (2.1%) | 0 (0.0%) |
| 7+ Person Households | 0 (0.0%) | 0 (0.0%) |
| Total | 616 (66.4%) | 311 (33.6%) |
Female Fertility in Cedar Glen West
Fertility by Age in Cedar Glen West
Average fertility rate in Cedar Glen West is 146.0 births per 1,000 women. Women in the age bracket of 20 to 34 years have the highest fertility rate with 455.0 births per 1,000 women. Women in the age bracket of 20 to 34 years acount for 100.0% of all women with births.
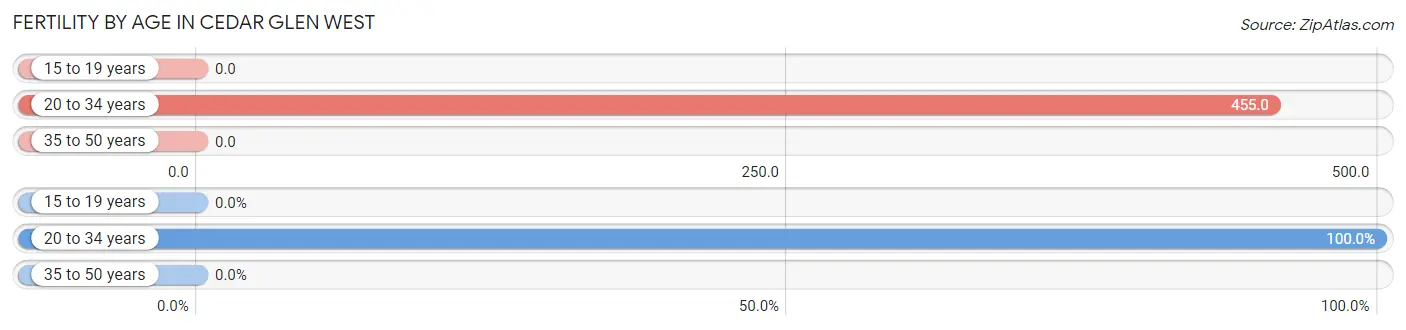
| Age Bracket | Women with Births | Births / 1,000 Women |
| 15 to 19 years | 0 (0.0%) | 0.0 |
| 20 to 34 years | 46 (100.0%) | 455.0 |
| 35 to 50 years | 0 (0.0%) | 0.0 |
| Total | 46 (100.0%) | 146.0 |
Fertility by Age by Marriage Status in Cedar Glen West
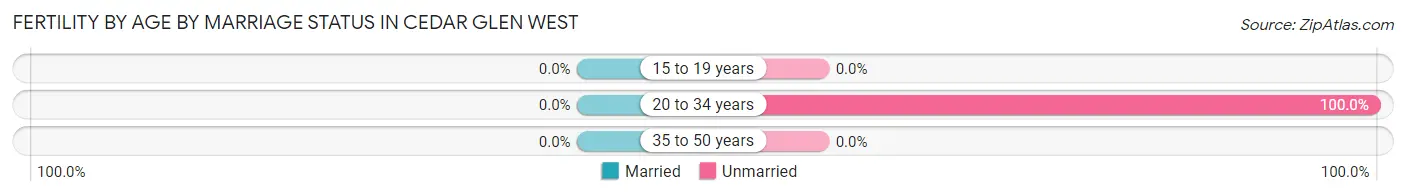
| Age Bracket | Married | Unmarried |
| 15 to 19 years | 0 (0.0%) | 0 (0.0%) |
| 20 to 34 years | 0 (0.0%) | 46 (100.0%) |
| 35 to 50 years | 0 (0.0%) | 0 (0.0%) |
| Total | 0 (0.0%) | 46 (100.0%) |
Fertility by Education in Cedar Glen West
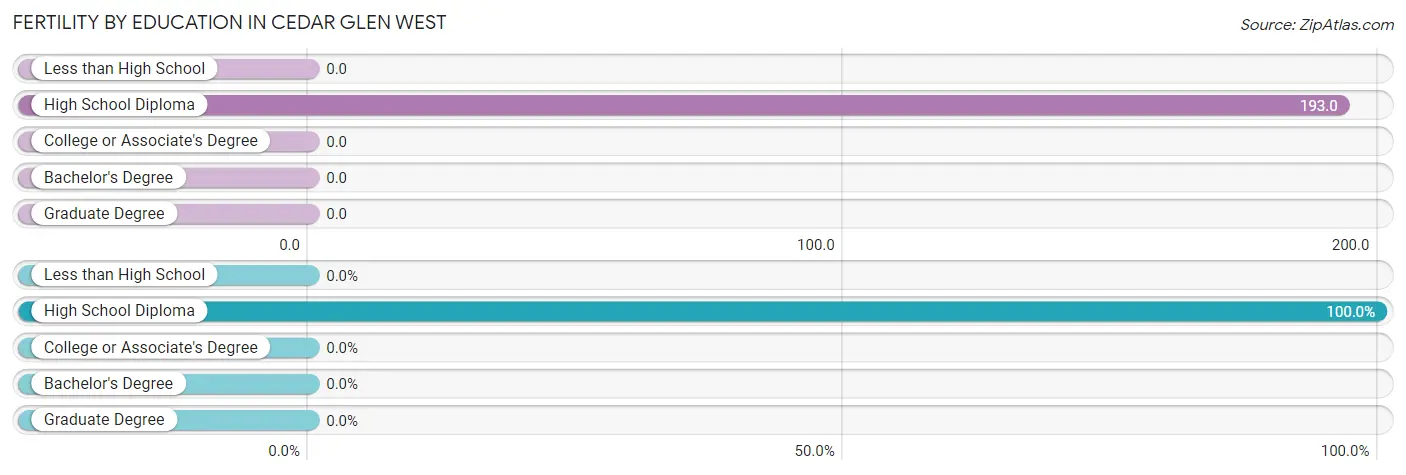
| Educational Attainment | Women with Births | Births / 1,000 Women |
| Less than High School | 0 (0.0%) | 0.0 |
| High School Diploma | 46 (100.0%) | 193.0 |
| College or Associate's Degree | 0 (0.0%) | 0.0 |
| Bachelor's Degree | 0 (0.0%) | 0.0 |
| Graduate Degree | 0 (0.0%) | 0.0 |
| Total | 46 (100.0%) | 146.0 |
Fertility by Education by Marriage Status in Cedar Glen West
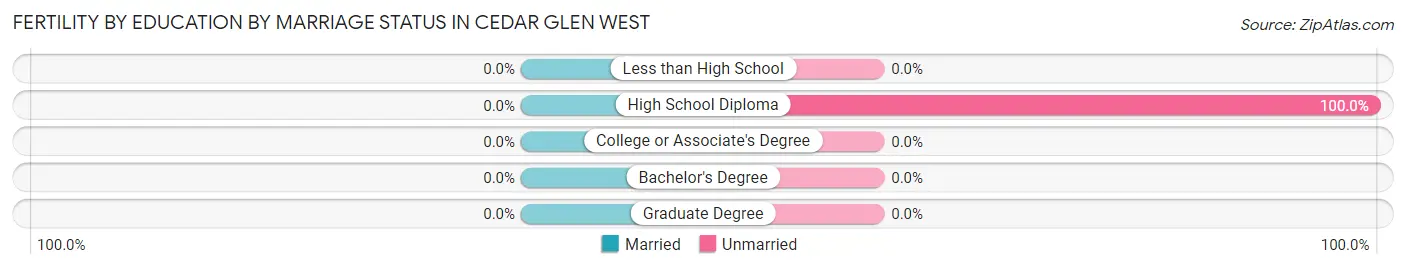
| Educational Attainment | Married | Unmarried |
| Less than High School | 0 (0.0%) | 0 (0.0%) |
| High School Diploma | 0 (0.0%) | 46 (100.0%) |
| College or Associate's Degree | 0 (0.0%) | 0 (0.0%) |
| Bachelor's Degree | 0 (0.0%) | 0 (0.0%) |
| Graduate Degree | 0 (0.0%) | 0 (0.0%) |
| Total | 0 (0.0%) | 46 (100.0%) |
Employment Characteristics in Cedar Glen West
Employment by Class of Employer in Cedar Glen West
Among the 774 employed individuals in Cedar Glen West, private company employees (644 | 83.2%), self-employed (incorporated) (98 | 12.7%), and state government employees (19 | 2.5%) make up the most common classes of employment.
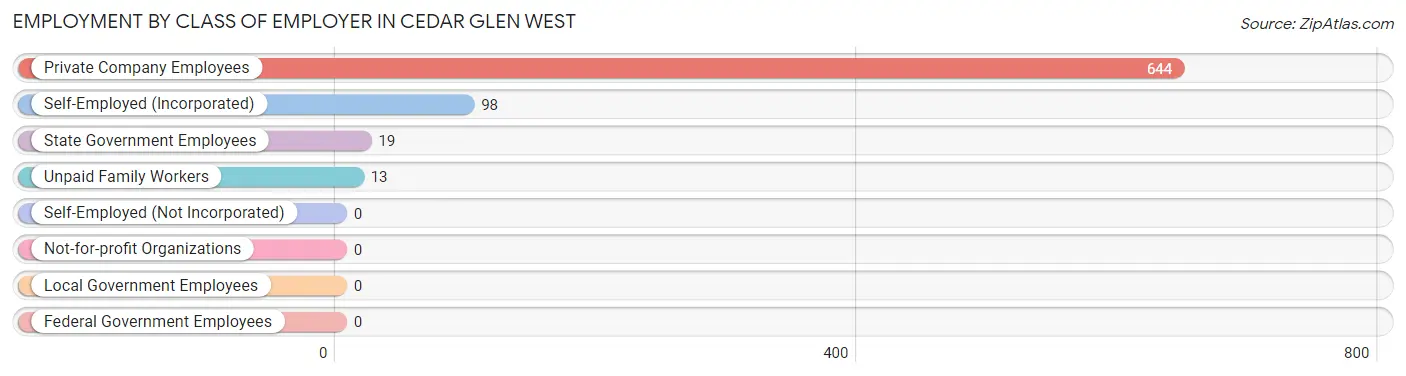
| Employer Class | # Employees | % Employees |
| Private Company Employees | 644 | 83.2% |
| Self-Employed (Incorporated) | 98 | 12.7% |
| Self-Employed (Not Incorporated) | 0 | 0.0% |
| Not-for-profit Organizations | 0 | 0.0% |
| Local Government Employees | 0 | 0.0% |
| State Government Employees | 19 | 2.5% |
| Federal Government Employees | 0 | 0.0% |
| Unpaid Family Workers | 13 | 1.7% |
| Total | 774 | 100.0% |
Employment Status by Age in Cedar Glen West
According to the labor force statistics for Cedar Glen West, out of the total population over 16 years of age (1,842), 48.8% or 899 individuals are in the labor force, with 4.8% or 43 of them unemployed. The age group with the highest labor force participation rate is 16 to 19 years, with 100.0% or 57 individuals in the labor force. Within the labor force, the 60 to 64 years age range has the highest percentage of unemployed individuals, with 11.7% or 12 of them being unemployed.
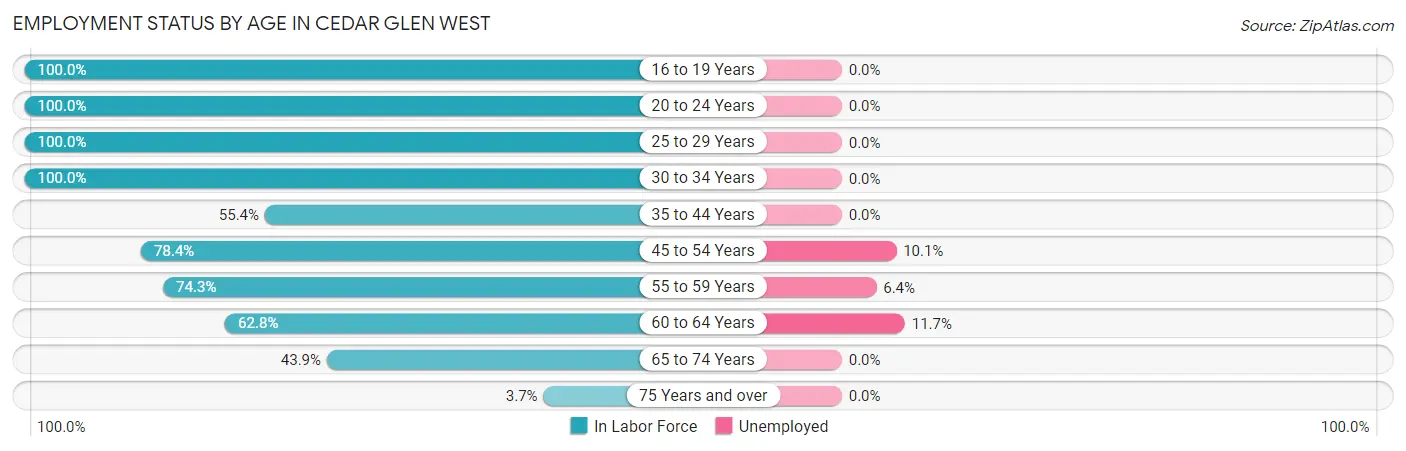
| Age Bracket | In Labor Force | Unemployed |
| 16 to 19 Years | 57 (100.0%) | 0 (0.0%) |
| 20 to 24 Years | 23 (100.0%) | 0 (0.0%) |
| 25 to 29 Years | 123 (100.0%) | 0 (0.0%) |
| 30 to 34 Years | 58 (100.0%) | 0 (0.0%) |
| 35 to 44 Years | 51 (55.4%) | 0 (0.0%) |
| 45 to 54 Years | 178 (78.4%) | 18 (10.1%) |
| 55 to 59 Years | 202 (74.3%) | 13 (6.4%) |
| 60 to 64 Years | 103 (62.8%) | 12 (11.7%) |
| 65 to 74 Years | 79 (43.9%) | 0 (0.0%) |
| 75 Years and over | 24 (3.7%) | 0 (0.0%) |
| Total | 899 (48.8%) | 43 (4.8%) |
Employment Status by Educational Attainment in Cedar Glen West
According to labor force statistics for Cedar Glen West, 76.4% of individuals (715) out of the total population between 25 and 64 years of age (936) are in the labor force, with 6.0% or 43 of them being unemployed. The group with the highest labor force participation rate are those with the educational attainment of high school diploma, with 90.9% or 439 individuals in the labor force. Within the labor force, individuals with bachelor's degree or higher education have the highest percentage of unemployment, with 20.5% or 25 of them being unemployed.
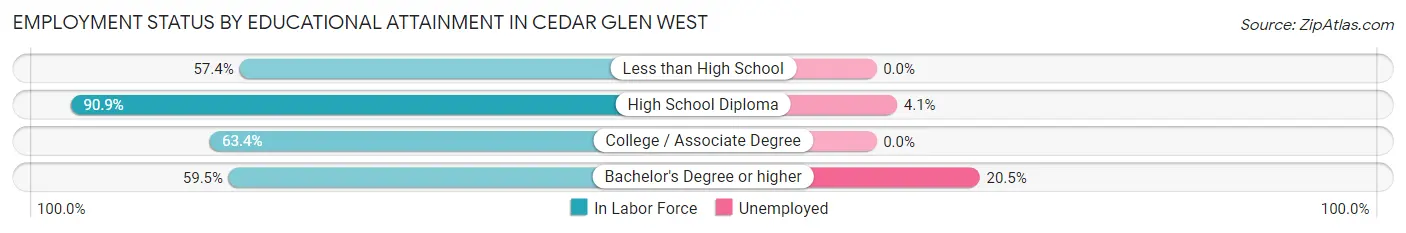
| Educational Attainment | In Labor Force | Unemployed |
| Less than High School | 31 (57.4%) | 0 (0.0%) |
| High School Diploma | 439 (90.9%) | 20 (4.1%) |
| College / Associate Degree | 123 (63.4%) | 0 (0.0%) |
| Bachelor's Degree or higher | 122 (59.5%) | 42 (20.5%) |
| Total | 715 (76.4%) | 56 (6.0%) |
Employment Occupations by Sex in Cedar Glen West
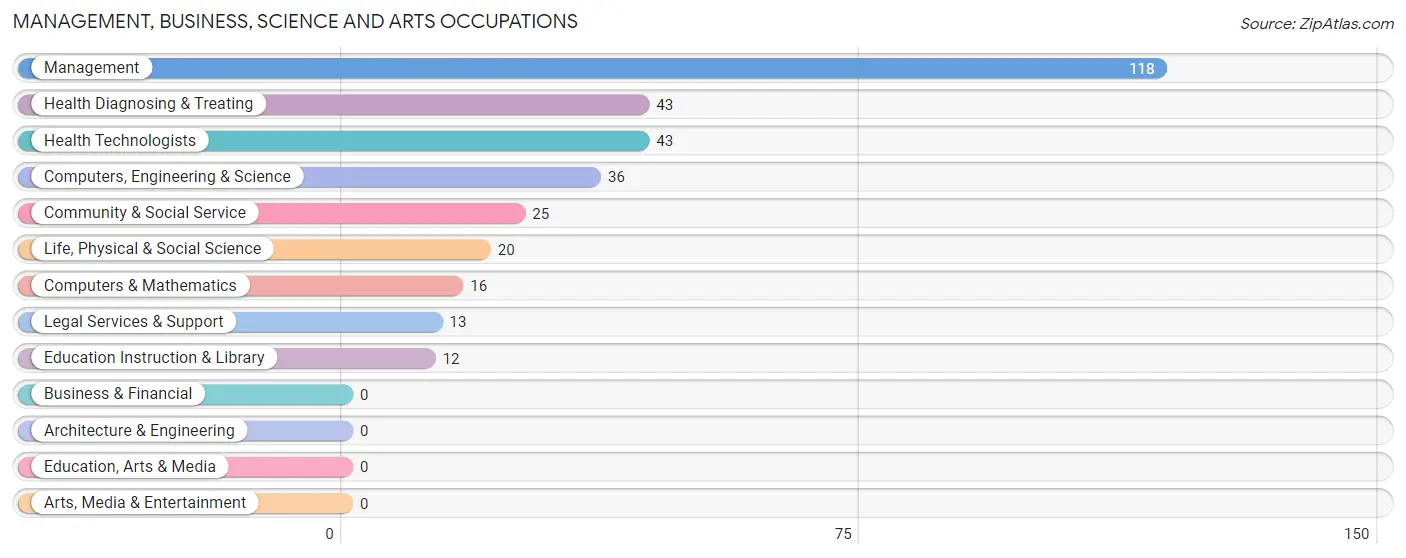
Management, Business, Science and Arts Occupations
The most common Management, Business, Science and Arts occupations in Cedar Glen West are Management (118 | 13.8%), Health Diagnosing & Treating (43 | 5.0%), Health Technologists (43 | 5.0%), Computers, Engineering & Science (36 | 4.2%), and Community & Social Service (25 | 2.9%).
Management, Business, Science and Arts Occupations by Sex
Within the Management, Business, Science and Arts occupations in Cedar Glen West, the most male-oriented occupations are Computers & Mathematics (100.0%), Community & Social Service (100.0%), and Legal Services & Support (100.0%), while the most female-oriented occupations are Life, Physical & Social Science (100.0%), Computers, Engineering & Science (55.6%), and Health Diagnosing & Treating (48.8%).
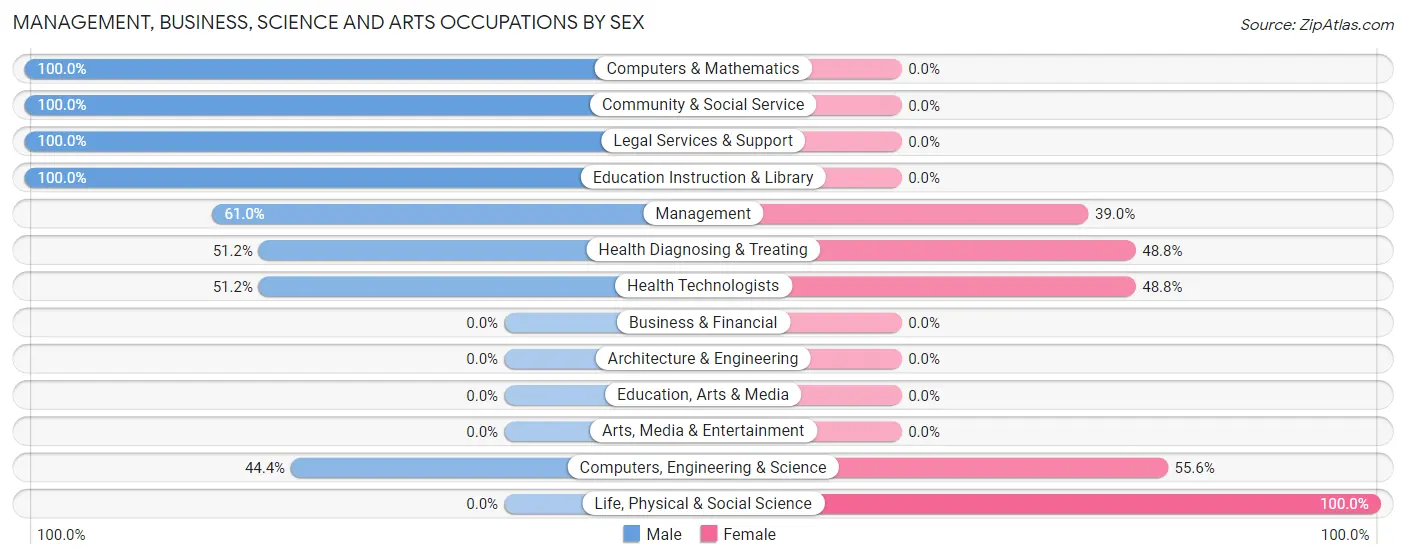
| Occupation | Male | Female |
| Management | 72 (61.0%) | 46 (39.0%) |
| Business & Financial | 0 (0.0%) | 0 (0.0%) |
| Computers, Engineering & Science | 16 (44.4%) | 20 (55.6%) |
| Computers & Mathematics | 16 (100.0%) | 0 (0.0%) |
| Architecture & Engineering | 0 (0.0%) | 0 (0.0%) |
| Life, Physical & Social Science | 0 (0.0%) | 20 (100.0%) |
| Community & Social Service | 25 (100.0%) | 0 (0.0%) |
| Education, Arts & Media | 0 (0.0%) | 0 (0.0%) |
| Legal Services & Support | 13 (100.0%) | 0 (0.0%) |
| Education Instruction & Library | 12 (100.0%) | 0 (0.0%) |
| Arts, Media & Entertainment | 0 (0.0%) | 0 (0.0%) |
| Health Diagnosing & Treating | 22 (51.2%) | 21 (48.8%) |
| Health Technologists | 22 (51.2%) | 21 (48.8%) |
| Total (Category) | 135 (60.8%) | 87 (39.2%) |
| Total (Overall) | 429 (50.2%) | 426 (49.8%) |
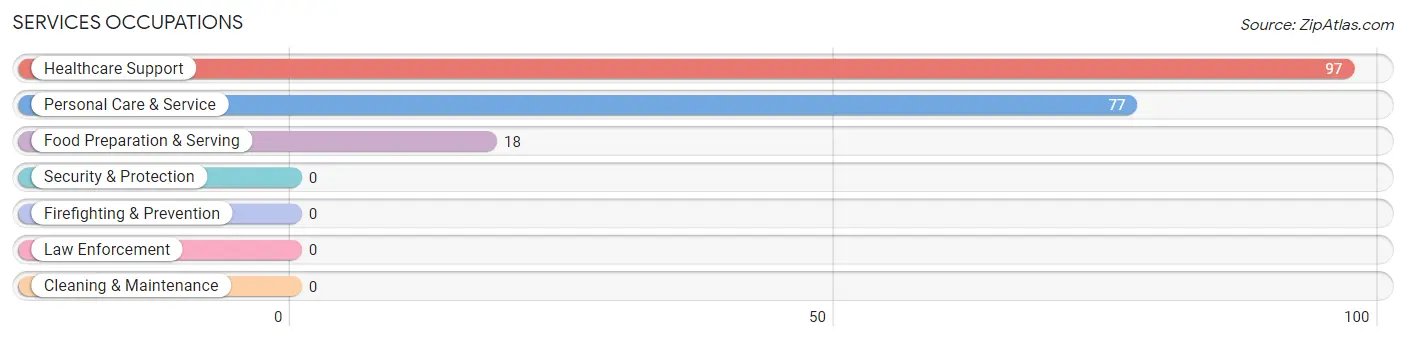
Services Occupations
The most common Services occupations in Cedar Glen West are Healthcare Support (97 | 11.4%), Personal Care & Service (77 | 9.0%), and Food Preparation & Serving (18 | 2.1%).
Services Occupations by Sex
Within the Services occupations in Cedar Glen West, the most male-oriented occupations are Food Preparation & Serving (100.0%), and Healthcare Support (13.4%), while the most female-oriented occupations are Personal Care & Service (100.0%), and Healthcare Support (86.6%).
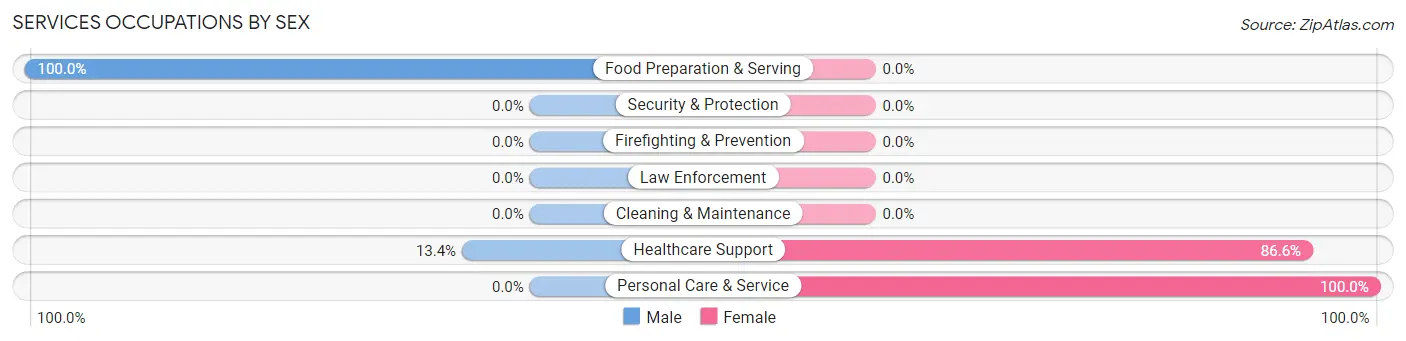
| Occupation | Male | Female |
| Healthcare Support | 13 (13.4%) | 84 (86.6%) |
| Security & Protection | 0 (0.0%) | 0 (0.0%) |
| Firefighting & Prevention | 0 (0.0%) | 0 (0.0%) |
| Law Enforcement | 0 (0.0%) | 0 (0.0%) |
| Food Preparation & Serving | 18 (100.0%) | 0 (0.0%) |
| Cleaning & Maintenance | 0 (0.0%) | 0 (0.0%) |
| Personal Care & Service | 0 (0.0%) | 77 (100.0%) |
| Total (Category) | 31 (16.2%) | 161 (83.9%) |
| Total (Overall) | 429 (50.2%) | 426 (49.8%) |
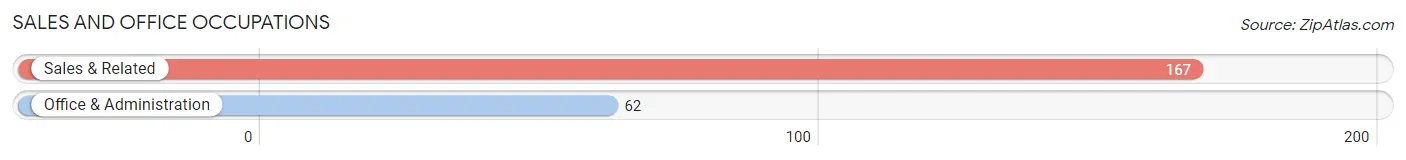
Sales and Office Occupations
The most common Sales and Office occupations in Cedar Glen West are Sales & Related (167 | 19.5%), and Office & Administration (62 | 7.2%).
Sales and Office Occupations by Sex
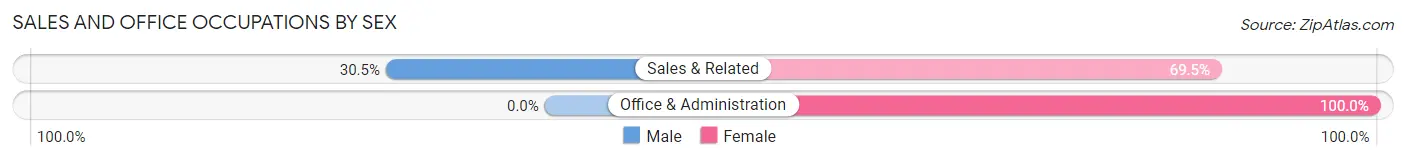
| Occupation | Male | Female |
| Sales & Related | 51 (30.5%) | 116 (69.5%) |
| Office & Administration | 0 (0.0%) | 62 (100.0%) |
| Total (Category) | 51 (22.3%) | 178 (77.7%) |
| Total (Overall) | 429 (50.2%) | 426 (49.8%) |
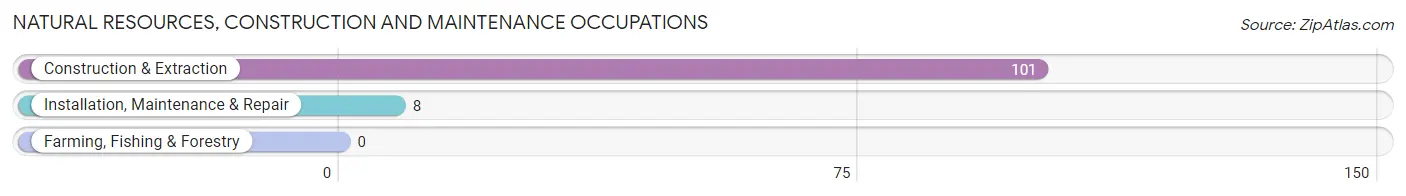
Natural Resources, Construction and Maintenance Occupations
The most common Natural Resources, Construction and Maintenance occupations in Cedar Glen West are Construction & Extraction (101 | 11.8%), and Installation, Maintenance & Repair (8 | 0.9%).
Natural Resources, Construction and Maintenance Occupations by Sex
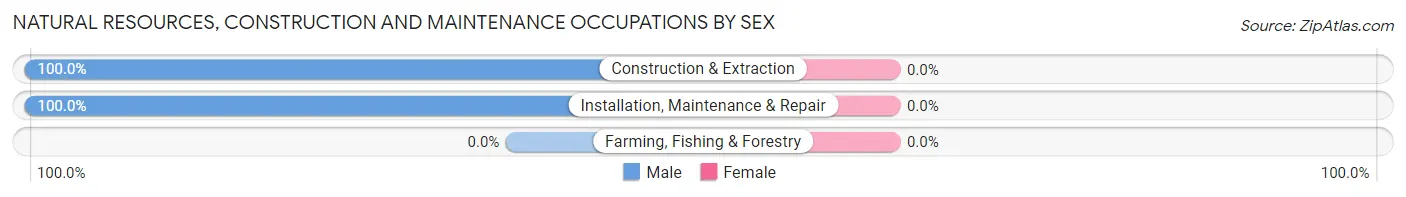
| Occupation | Male | Female |
| Farming, Fishing & Forestry | 0 (0.0%) | 0 (0.0%) |
| Construction & Extraction | 101 (100.0%) | 0 (0.0%) |
| Installation, Maintenance & Repair | 8 (100.0%) | 0 (0.0%) |
| Total (Category) | 109 (100.0%) | 0 (0.0%) |
| Total (Overall) | 429 (50.2%) | 426 (49.8%) |
Production, Transportation and Moving Occupations
The most common Production, Transportation and Moving occupations in Cedar Glen West are , and Transportation (103 | 12.0%).
Production, Transportation and Moving Occupations by Sex
| Occupation | Male | Female |
| Production | 0 (0.0%) | 0 (0.0%) |
| Transportation | 103 (100.0%) | 0 (0.0%) |
| Material Moving | 0 (0.0%) | 0 (0.0%) |
| Total (Category) | 103 (100.0%) | 0 (0.0%) |
| Total (Overall) | 429 (50.2%) | 426 (49.8%) |
Employment Industries by Sex in Cedar Glen West
Employment Industries in Cedar Glen West
The major employment industries in Cedar Glen West include Retail Trade (198 | 23.2%), Construction (188 | 22.0%), Health Care & Social Assistance (159 | 18.6%), Transportation & Warehousing (103 | 12.0%), and Accommodation & Food Services (45 | 5.3%).
Employment Industries by Sex in Cedar Glen West
The Cedar Glen West industries that see more men than women are Transportation & Warehousing (100.0%), Information (100.0%), and Professional & Scientific (100.0%), whereas the industries that tend to have a higher number of women are Wholesale Trade (100.0%), Real Estate, Rental & Leasing (100.0%), and Educational Services (100.0%).
| Industry | Male | Female |
| Agriculture, Fishing & Hunting | 0 (0.0%) | 0 (0.0%) |
| Mining, Quarrying, & Extraction | 0 (0.0%) | 0 (0.0%) |
| Construction | 154 (81.9%) | 34 (18.1%) |
| Manufacturing | 0 (0.0%) | 0 (0.0%) |
| Wholesale Trade | 0 (0.0%) | 12 (100.0%) |
| Retail Trade | 59 (29.8%) | 139 (70.2%) |
| Transportation & Warehousing | 103 (100.0%) | 0 (0.0%) |
| Utilities | 0 (0.0%) | 0 (0.0%) |
| Information | 28 (100.0%) | 0 (0.0%) |
| Finance & Insurance | 0 (0.0%) | 0 (0.0%) |
| Real Estate, Rental & Leasing | 0 (0.0%) | 12 (100.0%) |
| Professional & Scientific | 13 (100.0%) | 0 (0.0%) |
| Enterprise Management | 0 (0.0%) | 0 (0.0%) |
| Administrative & Support | 0 (0.0%) | 0 (0.0%) |
| Educational Services | 0 (0.0%) | 32 (100.0%) |
| Health Care & Social Assistance | 54 (34.0%) | 105 (66.0%) |
| Arts, Entertainment & Recreation | 0 (0.0%) | 0 (0.0%) |
| Accommodation & Food Services | 18 (40.0%) | 27 (60.0%) |
| Public Administration | 0 (0.0%) | 0 (0.0%) |
| Total | 429 (50.2%) | 426 (49.8%) |
Education in Cedar Glen West
School Enrollment in Cedar Glen West
The most common levels of schooling among the 142 students in Cedar Glen West are elementary school (85 | 59.9%), college / undergraduate (39 | 27.5%), and middle school (18 | 12.7%).
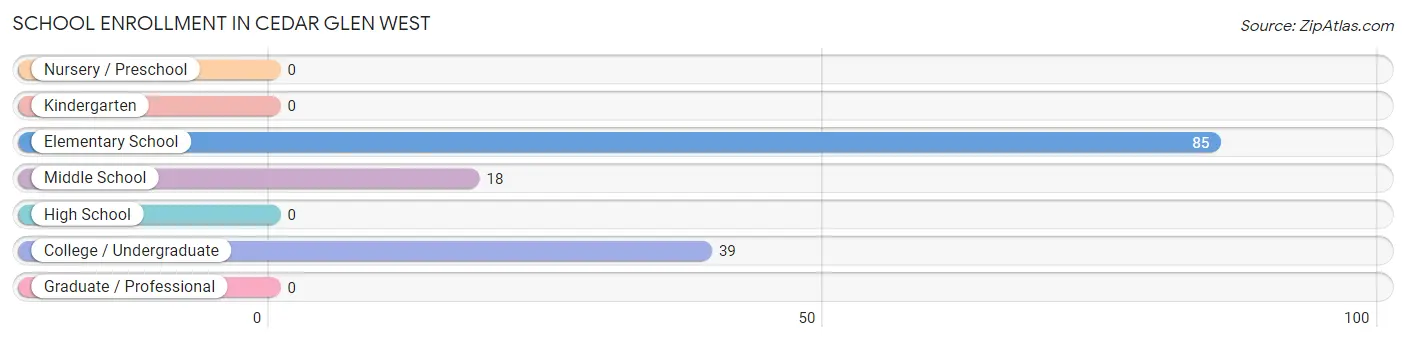
| School Level | # Students | % Students |
| Nursery / Preschool | 0 | 0.0% |
| Kindergarten | 0 | 0.0% |
| Elementary School | 85 | 59.9% |
| Middle School | 18 | 12.7% |
| High School | 0 | 0.0% |
| College / Undergraduate | 39 | 27.5% |
| Graduate / Professional | 0 | 0.0% |
| Total | 142 | 100.0% |
School Enrollment by Age by Funding Source in Cedar Glen West
Out of a total of 142 students who are enrolled in schools in Cedar Glen West, 25 (17.6%) attend a private institution, while the remaining 117 (82.4%) are enrolled in public schools. The age group of 18 to 19 year olds has the highest likelihood of being enrolled in private schools, with 25 (64.1% in the age bracket) enrolled. Conversely, the age group of 5 to 9 year old has the lowest likelihood of being enrolled in a private school, with 48 (100.0% in the age bracket) attending a public institution.
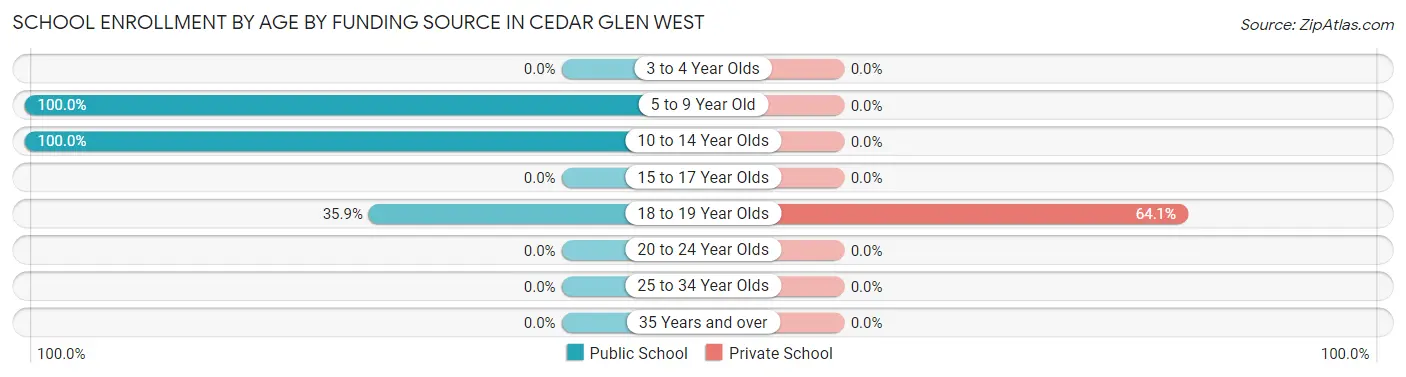
| Age Bracket | Public School | Private School |
| 3 to 4 Year Olds | 0 (0.0%) | 0 (0.0%) |
| 5 to 9 Year Old | 48 (100.0%) | 0 (0.0%) |
| 10 to 14 Year Olds | 55 (100.0%) | 0 (0.0%) |
| 15 to 17 Year Olds | 0 (0.0%) | 0 (0.0%) |
| 18 to 19 Year Olds | 14 (35.9%) | 25 (64.1%) |
| 20 to 24 Year Olds | 0 (0.0%) | 0 (0.0%) |
| 25 to 34 Year Olds | 0 (0.0%) | 0 (0.0%) |
| 35 Years and over | 0 (0.0%) | 0 (0.0%) |
| Total | 117 (82.4%) | 25 (17.6%) |
Educational Attainment by Field of Study in Cedar Glen West
Engineering (71 | 23.7%), business (70 | 23.3%), science & technology (53 | 17.7%), liberal arts & history (34 | 11.3%), and bio, nature & agricultural (22 | 7.3%) are the most common fields of study among 300 individuals in Cedar Glen West who have obtained a bachelor's degree or higher.
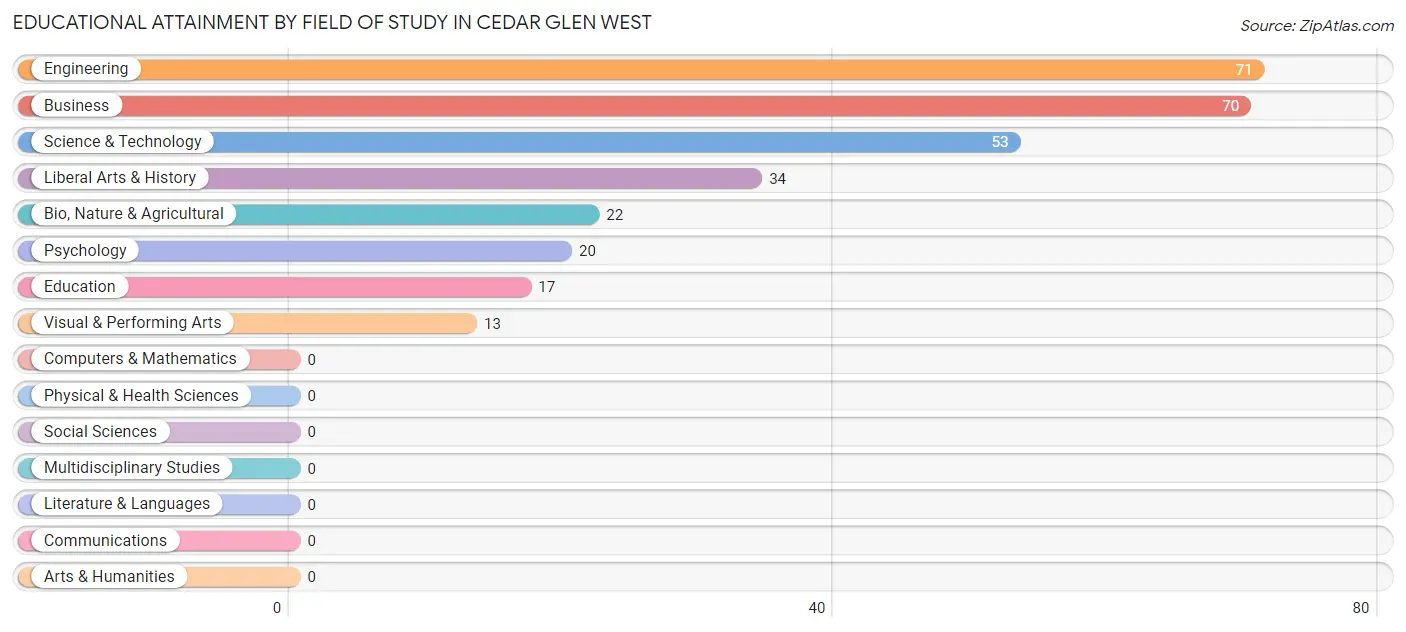
| Field of Study | # Graduates | % Graduates |
| Computers & Mathematics | 0 | 0.0% |
| Bio, Nature & Agricultural | 22 | 7.3% |
| Physical & Health Sciences | 0 | 0.0% |
| Psychology | 20 | 6.7% |
| Social Sciences | 0 | 0.0% |
| Engineering | 71 | 23.7% |
| Multidisciplinary Studies | 0 | 0.0% |
| Science & Technology | 53 | 17.7% |
| Business | 70 | 23.3% |
| Education | 17 | 5.7% |
| Literature & Languages | 0 | 0.0% |
| Liberal Arts & History | 34 | 11.3% |
| Visual & Performing Arts | 13 | 4.3% |
| Communications | 0 | 0.0% |
| Arts & Humanities | 0 | 0.0% |
| Total | 300 | 100.0% |
Transportation & Commute in Cedar Glen West
Vehicle Availability by Sex in Cedar Glen West
The most prevalent vehicle ownership categories in Cedar Glen West are males with 3 vehicles (225, accounting for 57.1%) and females with 3 vehicles (128, making up 59.2%).
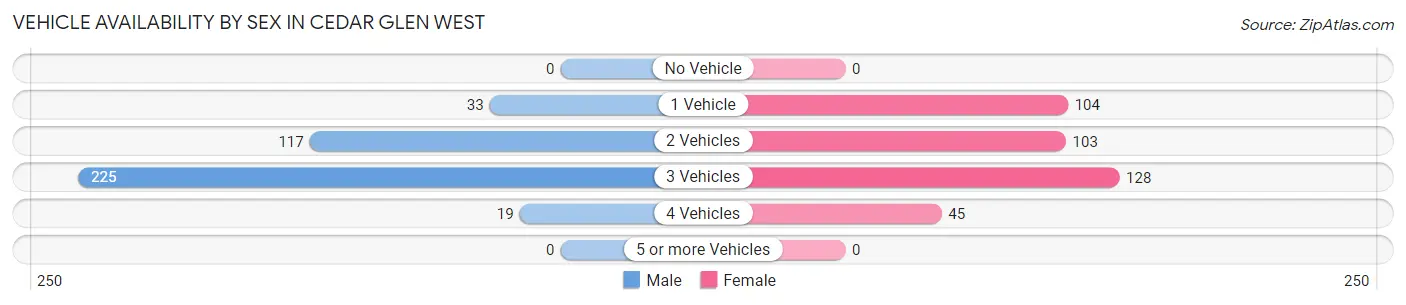
| Vehicles Available | Male | Female |
| No Vehicle | 0 (0.0%) | 0 (0.0%) |
| 1 Vehicle | 33 (8.4%) | 104 (27.4%) |
| 2 Vehicles | 117 (29.7%) | 103 (27.1%) |
| 3 Vehicles | 225 (57.1%) | 128 (33.7%) |
| 4 Vehicles | 19 (4.8%) | 45 (11.8%) |
| 5 or more Vehicles | 0 (0.0%) | 0 (0.0%) |
| Total | 394 (100.0%) | 380 (100.0%) |
Commute Time in Cedar Glen West
The most frequently occuring commute durations in Cedar Glen West are 30 to 34 minutes (202 commuters, 26.5%), 20 to 24 minutes (180 commuters, 23.6%), and 40 to 44 minutes (154 commuters, 20.2%).
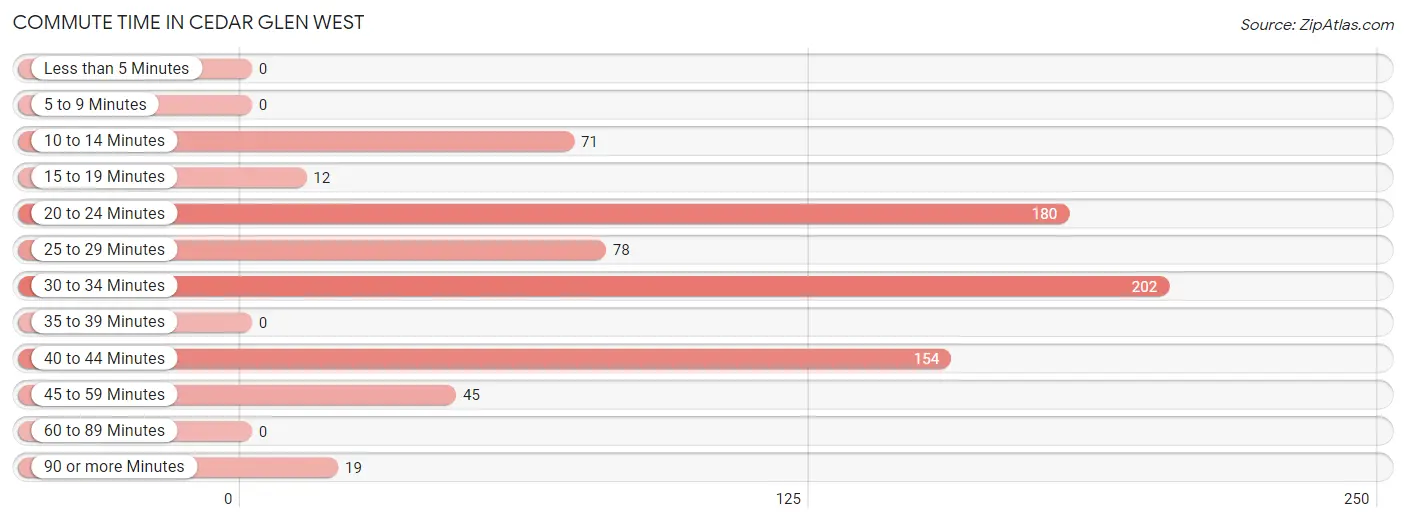
| Commute Time | # Commuters | % Commuters |
| Less than 5 Minutes | 0 | 0.0% |
| 5 to 9 Minutes | 0 | 0.0% |
| 10 to 14 Minutes | 71 | 9.3% |
| 15 to 19 Minutes | 12 | 1.6% |
| 20 to 24 Minutes | 180 | 23.6% |
| 25 to 29 Minutes | 78 | 10.2% |
| 30 to 34 Minutes | 202 | 26.5% |
| 35 to 39 Minutes | 0 | 0.0% |
| 40 to 44 Minutes | 154 | 20.2% |
| 45 to 59 Minutes | 45 | 5.9% |
| 60 to 89 Minutes | 0 | 0.0% |
| 90 or more Minutes | 19 | 2.5% |
Commute Time by Sex in Cedar Glen West
The most common commute times in Cedar Glen West are 40 to 44 minutes (154 commuters, 40.4%) for males and 20 to 24 minutes (121 commuters, 31.8%) for females.
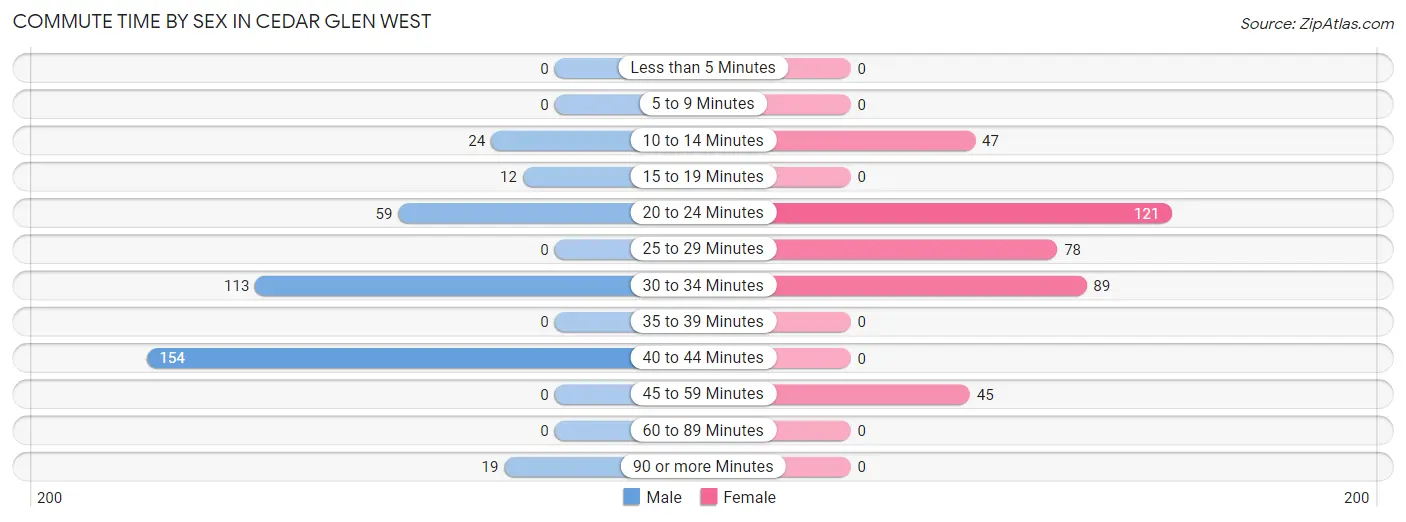
| Commute Time | Male | Female |
| Less than 5 Minutes | 0 (0.0%) | 0 (0.0%) |
| 5 to 9 Minutes | 0 (0.0%) | 0 (0.0%) |
| 10 to 14 Minutes | 24 (6.3%) | 47 (12.4%) |
| 15 to 19 Minutes | 12 (3.2%) | 0 (0.0%) |
| 20 to 24 Minutes | 59 (15.5%) | 121 (31.8%) |
| 25 to 29 Minutes | 0 (0.0%) | 78 (20.5%) |
| 30 to 34 Minutes | 113 (29.7%) | 89 (23.4%) |
| 35 to 39 Minutes | 0 (0.0%) | 0 (0.0%) |
| 40 to 44 Minutes | 154 (40.4%) | 0 (0.0%) |
| 45 to 59 Minutes | 0 (0.0%) | 45 (11.8%) |
| 60 to 89 Minutes | 0 (0.0%) | 0 (0.0%) |
| 90 or more Minutes | 19 (5.0%) | 0 (0.0%) |
Time of Departure to Work by Sex in Cedar Glen West
The most frequent times of departure to work in Cedar Glen West are 4:00 PM to 11:59 PM (103, 27.0%) for males and 6:00 AM to 6:29 AM (148, 39.0%) for females.
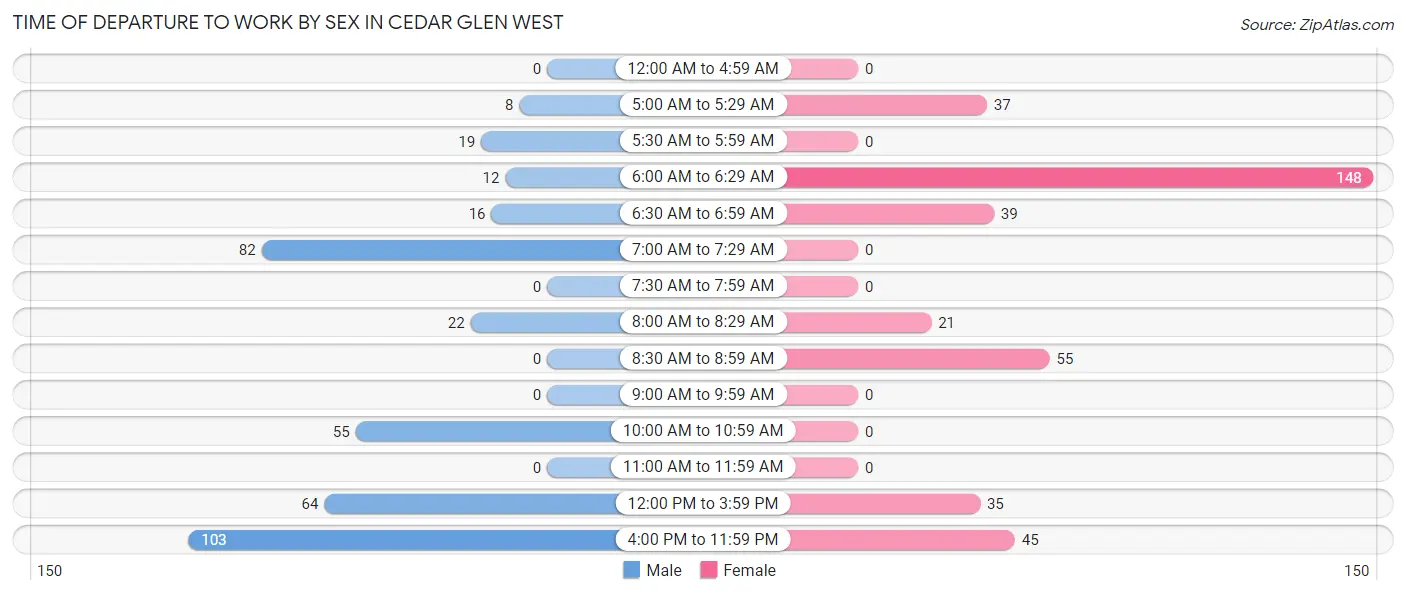
| Time of Departure | Male | Female |
| 12:00 AM to 4:59 AM | 0 (0.0%) | 0 (0.0%) |
| 5:00 AM to 5:29 AM | 8 (2.1%) | 37 (9.7%) |
| 5:30 AM to 5:59 AM | 19 (5.0%) | 0 (0.0%) |
| 6:00 AM to 6:29 AM | 12 (3.2%) | 148 (39.0%) |
| 6:30 AM to 6:59 AM | 16 (4.2%) | 39 (10.3%) |
| 7:00 AM to 7:29 AM | 82 (21.5%) | 0 (0.0%) |
| 7:30 AM to 7:59 AM | 0 (0.0%) | 0 (0.0%) |
| 8:00 AM to 8:29 AM | 22 (5.8%) | 21 (5.5%) |
| 8:30 AM to 8:59 AM | 0 (0.0%) | 55 (14.5%) |
| 9:00 AM to 9:59 AM | 0 (0.0%) | 0 (0.0%) |
| 10:00 AM to 10:59 AM | 55 (14.4%) | 0 (0.0%) |
| 11:00 AM to 11:59 AM | 0 (0.0%) | 0 (0.0%) |
| 12:00 PM to 3:59 PM | 64 (16.8%) | 35 (9.2%) |
| 4:00 PM to 11:59 PM | 103 (27.0%) | 45 (11.8%) |
| Total | 381 (100.0%) | 380 (100.0%) |
Housing Occupancy in Cedar Glen West
Occupancy by Ownership in Cedar Glen West
Of the total 927 dwellings in Cedar Glen West, owner-occupied units account for 861 (92.9%), while renter-occupied units make up 66 (7.1%).
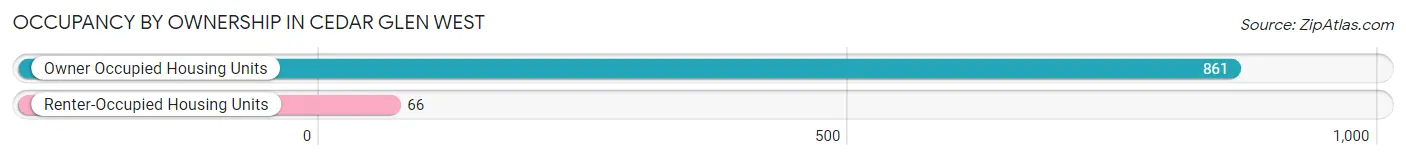
| Occupancy | # Housing Units | % Housing Units |
| Owner Occupied Housing Units | 861 | 92.9% |
| Renter-Occupied Housing Units | 66 | 7.1% |
| Total Occupied Housing Units | 927 | 100.0% |
Occupancy by Household Size in Cedar Glen West
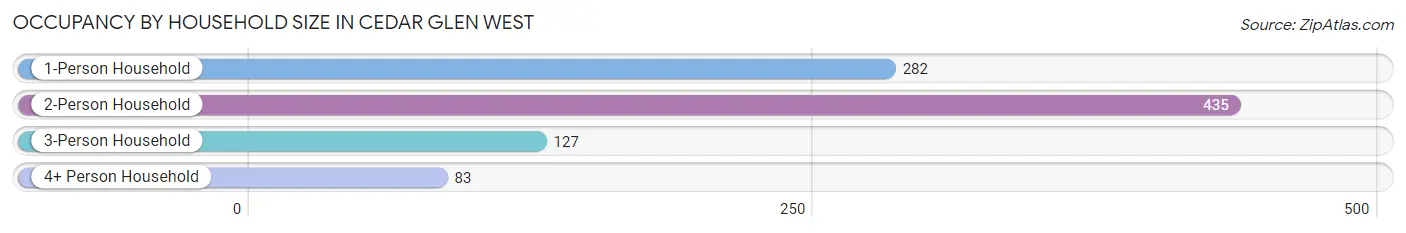
| Household Size | # Housing Units | % Housing Units |
| 1-Person Household | 282 | 30.4% |
| 2-Person Household | 435 | 46.9% |
| 3-Person Household | 127 | 13.7% |
| 4+ Person Household | 83 | 8.9% |
| Total Housing Units | 927 | 100.0% |
Occupancy by Ownership by Household Size in Cedar Glen West
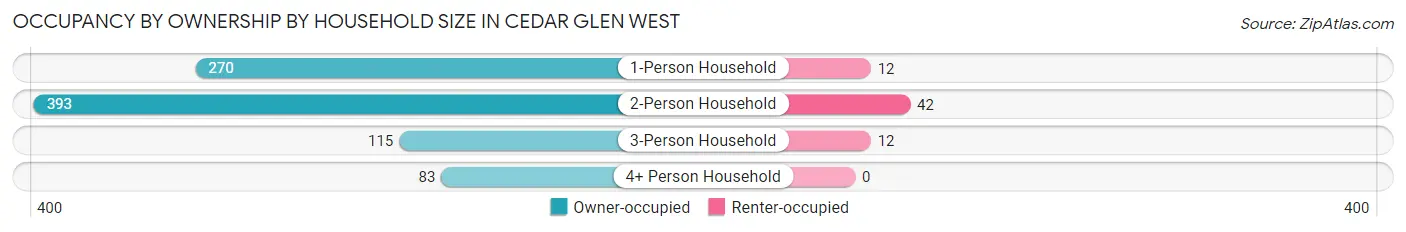
| Household Size | Owner-occupied | Renter-occupied |
| 1-Person Household | 270 (95.7%) | 12 (4.3%) |
| 2-Person Household | 393 (90.3%) | 42 (9.7%) |
| 3-Person Household | 115 (90.5%) | 12 (9.5%) |
| 4+ Person Household | 83 (100.0%) | 0 (0.0%) |
| Total Housing Units | 861 (92.9%) | 66 (7.1%) |
Occupancy by Educational Attainment in Cedar Glen West
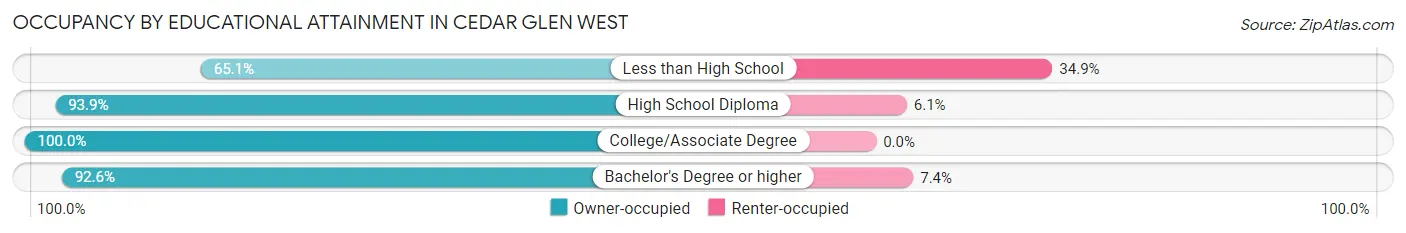
| Household Size | Owner-occupied | Renter-occupied |
| Less than High School | 54 (65.1%) | 29 (34.9%) |
| High School Diploma | 386 (93.9%) | 25 (6.1%) |
| College/Associate Degree | 270 (100.0%) | 0 (0.0%) |
| Bachelor's Degree or higher | 151 (92.6%) | 12 (7.4%) |
Occupancy by Age of Householder in Cedar Glen West
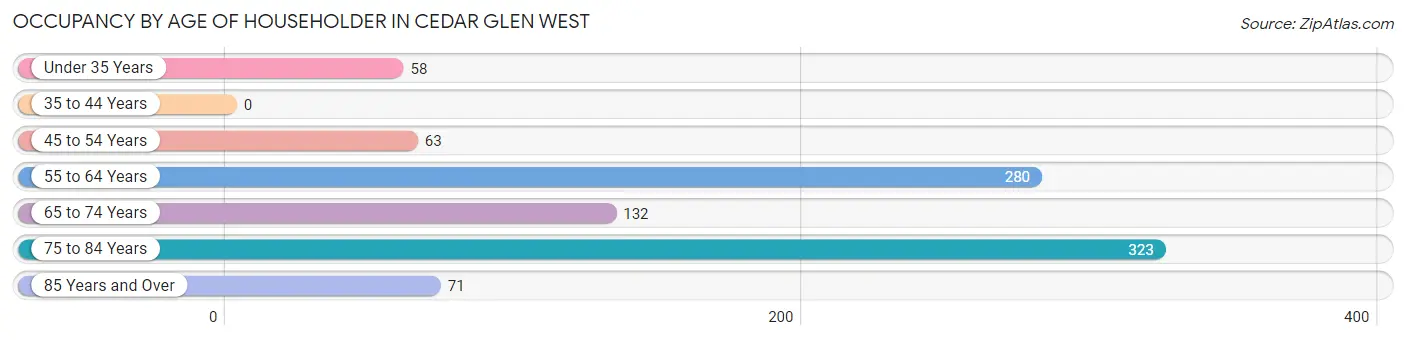
| Age Bracket | # Households | % Households |
| Under 35 Years | 58 | 6.3% |
| 35 to 44 Years | 0 | 0.0% |
| 45 to 54 Years | 63 | 6.8% |
| 55 to 64 Years | 280 | 30.2% |
| 65 to 74 Years | 132 | 14.2% |
| 75 to 84 Years | 323 | 34.8% |
| 85 Years and Over | 71 | 7.7% |
| Total | 927 | 100.0% |
Housing Finances in Cedar Glen West
Median Income by Occupancy in Cedar Glen West
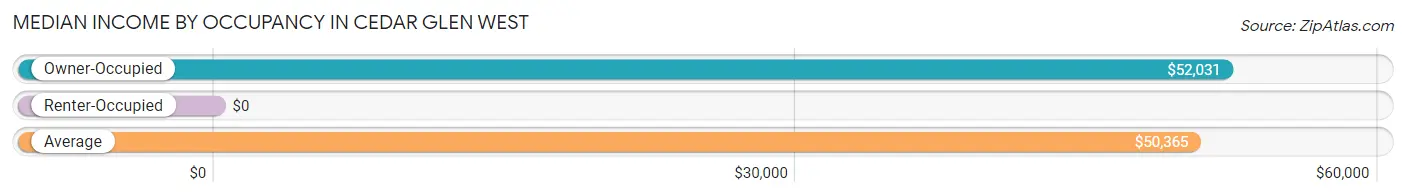
| Occupancy Type | # Households | Median Income |
| Owner-Occupied | 861 (92.9%) | $52,031 |
| Renter-Occupied | 66 (7.1%) | $0 |
| Average | 927 (100.0%) | $50,365 |
Occupancy by Householder Income Bracket in Cedar Glen West
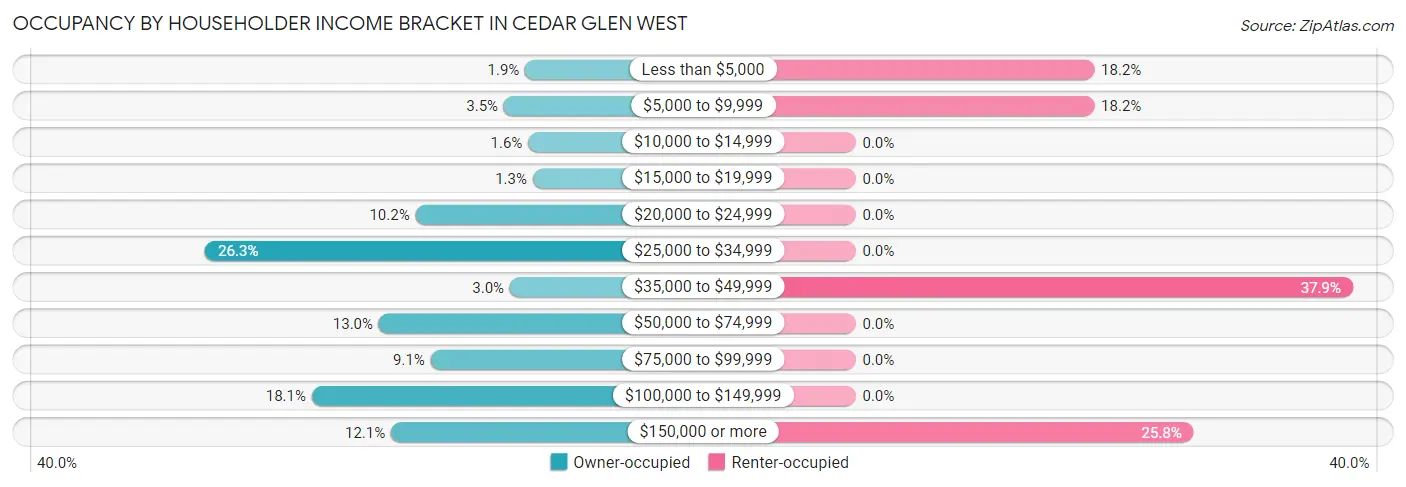
| Income Bracket | Owner-occupied | Renter-occupied |
| Less than $5,000 | 16 (1.9%) | 12 (18.2%) |
| $5,000 to $9,999 | 30 (3.5%) | 12 (18.2%) |
| $10,000 to $14,999 | 14 (1.6%) | 0 (0.0%) |
| $15,000 to $19,999 | 11 (1.3%) | 0 (0.0%) |
| $20,000 to $24,999 | 88 (10.2%) | 0 (0.0%) |
| $25,000 to $34,999 | 226 (26.3%) | 0 (0.0%) |
| $35,000 to $49,999 | 26 (3.0%) | 25 (37.9%) |
| $50,000 to $74,999 | 112 (13.0%) | 0 (0.0%) |
| $75,000 to $99,999 | 78 (9.1%) | 0 (0.0%) |
| $100,000 to $149,999 | 156 (18.1%) | 0 (0.0%) |
| $150,000 or more | 104 (12.1%) | 17 (25.8%) |
| Total | 861 (100.0%) | 66 (100.0%) |
Monthly Housing Cost Tiers in Cedar Glen West
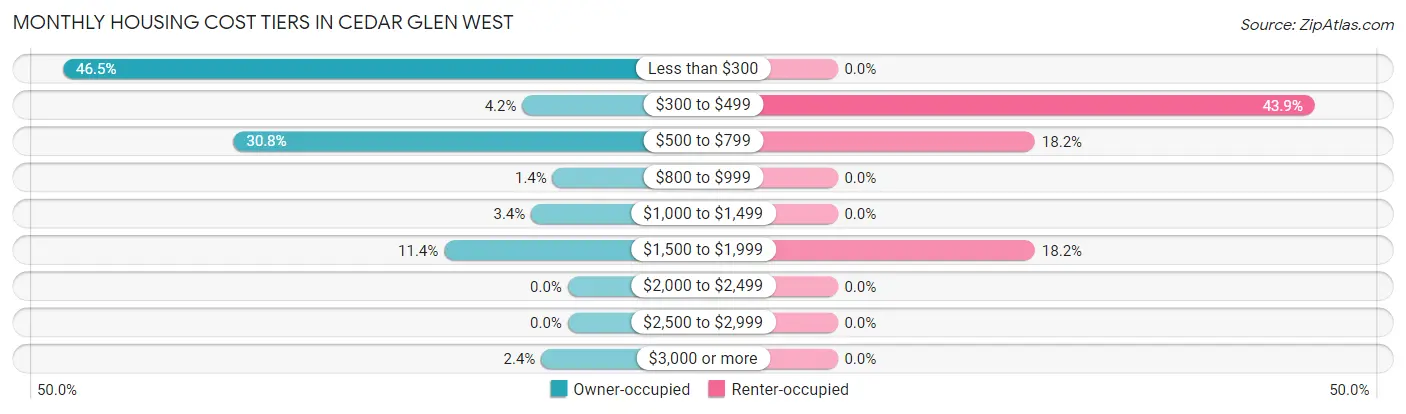
| Monthly Cost | Owner-occupied | Renter-occupied |
| Less than $300 | 400 (46.5%) | 0 (0.0%) |
| $300 to $499 | 36 (4.2%) | 29 (43.9%) |
| $500 to $799 | 265 (30.8%) | 12 (18.2%) |
| $800 to $999 | 12 (1.4%) | 0 (0.0%) |
| $1,000 to $1,499 | 29 (3.4%) | 0 (0.0%) |
| $1,500 to $1,999 | 98 (11.4%) | 12 (18.2%) |
| $2,000 to $2,499 | 0 (0.0%) | 0 (0.0%) |
| $2,500 to $2,999 | 0 (0.0%) | 0 (0.0%) |
| $3,000 or more | 21 (2.4%) | 0 (0.0%) |
| Total | 861 (100.0%) | 66 (100.0%) |
Physical Housing Characteristics in Cedar Glen West
Housing Structures in Cedar Glen West
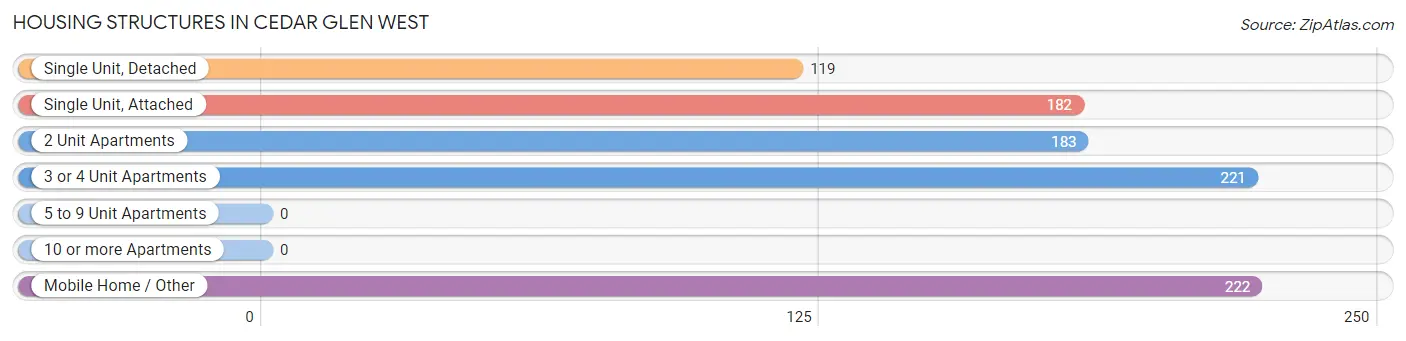
| Structure Type | # Housing Units | % Housing Units |
| Single Unit, Detached | 119 | 12.8% |
| Single Unit, Attached | 182 | 19.6% |
| 2 Unit Apartments | 183 | 19.7% |
| 3 or 4 Unit Apartments | 221 | 23.8% |
| 5 to 9 Unit Apartments | 0 | 0.0% |
| 10 or more Apartments | 0 | 0.0% |
| Mobile Home / Other | 222 | 23.9% |
| Total | 927 | 100.0% |
Housing Structures by Occupancy in Cedar Glen West
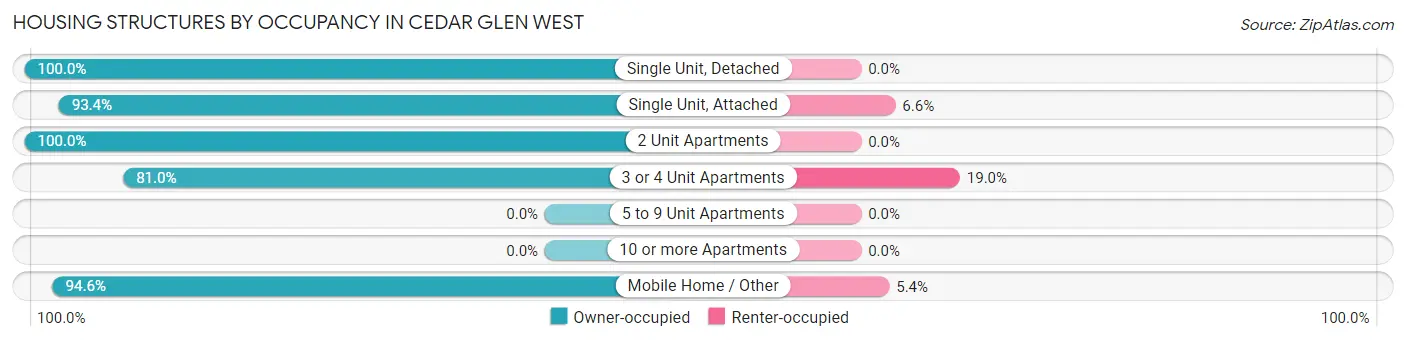
| Structure Type | Owner-occupied | Renter-occupied |
| Single Unit, Detached | 119 (100.0%) | 0 (0.0%) |
| Single Unit, Attached | 170 (93.4%) | 12 (6.6%) |
| 2 Unit Apartments | 183 (100.0%) | 0 (0.0%) |
| 3 or 4 Unit Apartments | 179 (81.0%) | 42 (19.0%) |
| 5 to 9 Unit Apartments | 0 (0.0%) | 0 (0.0%) |
| 10 or more Apartments | 0 (0.0%) | 0 (0.0%) |
| Mobile Home / Other | 210 (94.6%) | 12 (5.4%) |
| Total | 861 (92.9%) | 66 (7.1%) |
Housing Structures by Number of Rooms in Cedar Glen West
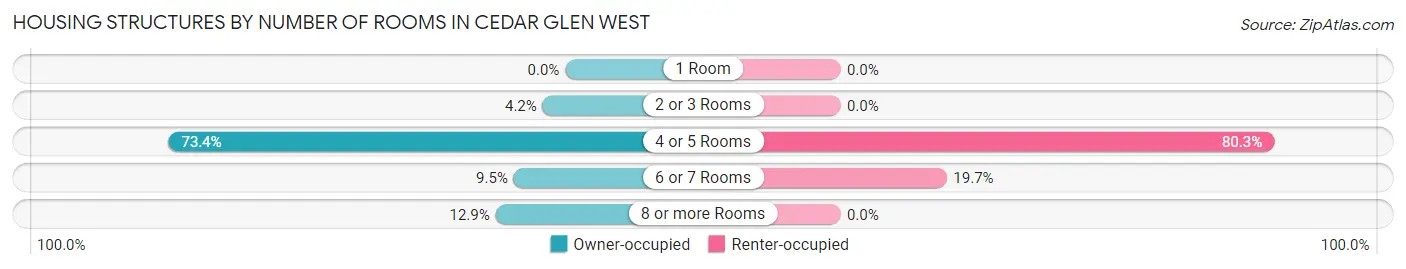
| Number of Rooms | Owner-occupied | Renter-occupied |
| 1 Room | 0 (0.0%) | 0 (0.0%) |
| 2 or 3 Rooms | 36 (4.2%) | 0 (0.0%) |
| 4 or 5 Rooms | 632 (73.4%) | 53 (80.3%) |
| 6 or 7 Rooms | 82 (9.5%) | 13 (19.7%) |
| 8 or more Rooms | 111 (12.9%) | 0 (0.0%) |
| Total | 861 (100.0%) | 66 (100.0%) |
Housing Structure by Heating Type in Cedar Glen West
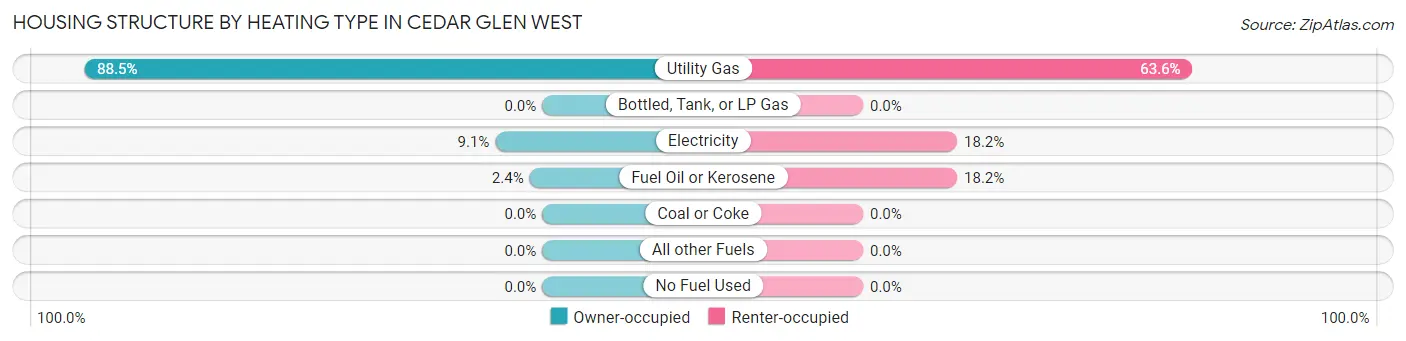
| Heating Type | Owner-occupied | Renter-occupied |
| Utility Gas | 762 (88.5%) | 42 (63.6%) |
| Bottled, Tank, or LP Gas | 0 (0.0%) | 0 (0.0%) |
| Electricity | 78 (9.1%) | 12 (18.2%) |
| Fuel Oil or Kerosene | 21 (2.4%) | 12 (18.2%) |
| Coal or Coke | 0 (0.0%) | 0 (0.0%) |
| All other Fuels | 0 (0.0%) | 0 (0.0%) |
| No Fuel Used | 0 (0.0%) | 0 (0.0%) |
| Total | 861 (100.0%) | 66 (100.0%) |
Household Vehicle Usage in Cedar Glen West
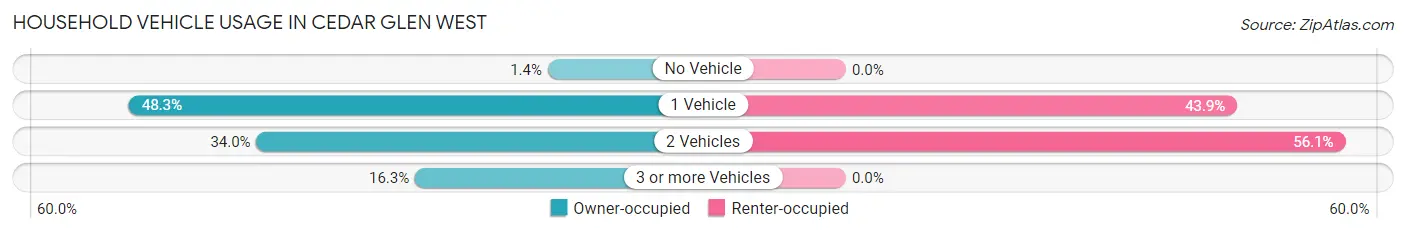
| Vehicles per Household | Owner-occupied | Renter-occupied |
| No Vehicle | 12 (1.4%) | 0 (0.0%) |
| 1 Vehicle | 416 (48.3%) | 29 (43.9%) |
| 2 Vehicles | 293 (34.0%) | 37 (56.1%) |
| 3 or more Vehicles | 140 (16.3%) | 0 (0.0%) |
| Total | 861 (100.0%) | 66 (100.0%) |
Real Estate & Mortgages in Cedar Glen West
Real Estate and Mortgage Overview in Cedar Glen West
| Characteristic | Without Mortgage | With Mortgage |
| Housing Units | 743 | 118 |
| Median Property Value | $62,600 | $174,400 |
| Median Household Income | $52,135 | $21 |
| Monthly Housing Costs | - | - |
| Real Estate Taxes | $756 | $18 |
Property Value by Mortgage Status in Cedar Glen West
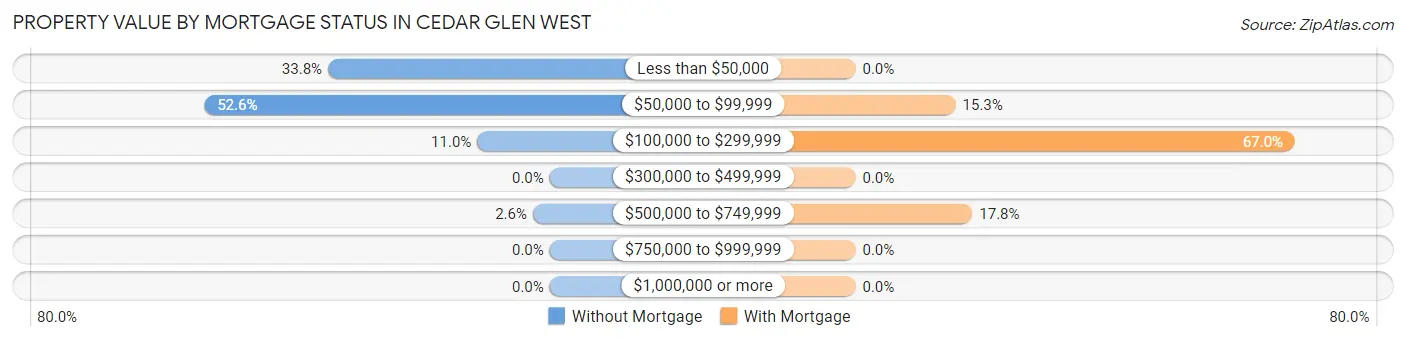
| Property Value | Without Mortgage | With Mortgage |
| Less than $50,000 | 251 (33.8%) | 0 (0.0%) |
| $50,000 to $99,999 | 391 (52.6%) | 18 (15.2%) |
| $100,000 to $299,999 | 82 (11.0%) | 79 (66.9%) |
| $300,000 to $499,999 | 0 (0.0%) | 0 (0.0%) |
| $500,000 to $749,999 | 19 (2.6%) | 21 (17.8%) |
| $750,000 to $999,999 | 0 (0.0%) | 0 (0.0%) |
| $1,000,000 or more | 0 (0.0%) | 0 (0.0%) |
| Total | 743 (100.0%) | 118 (100.0%) |
Household Income by Mortgage Status in Cedar Glen West
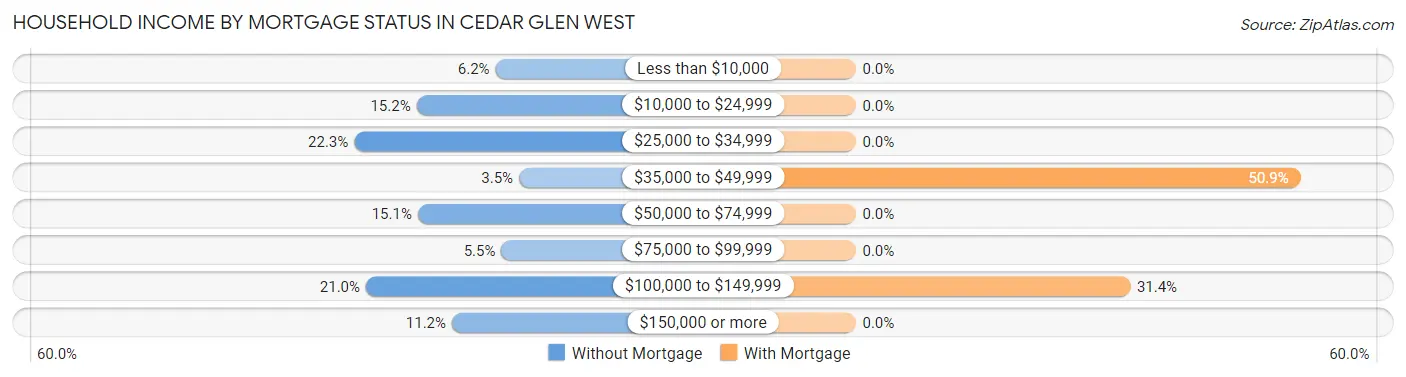
| Household Income | Without Mortgage | With Mortgage |
| Less than $10,000 | 46 (6.2%) | 0 (0.0%) |
| $10,000 to $24,999 | 113 (15.2%) | 0 (0.0%) |
| $25,000 to $34,999 | 166 (22.3%) | 0 (0.0%) |
| $35,000 to $49,999 | 26 (3.5%) | 60 (50.8%) |
| $50,000 to $74,999 | 112 (15.1%) | 0 (0.0%) |
| $75,000 to $99,999 | 41 (5.5%) | 0 (0.0%) |
| $100,000 to $149,999 | 156 (21.0%) | 37 (31.4%) |
| $150,000 or more | 83 (11.2%) | 0 (0.0%) |
| Total | 743 (100.0%) | 118 (100.0%) |
Property Value to Household Income Ratio in Cedar Glen West
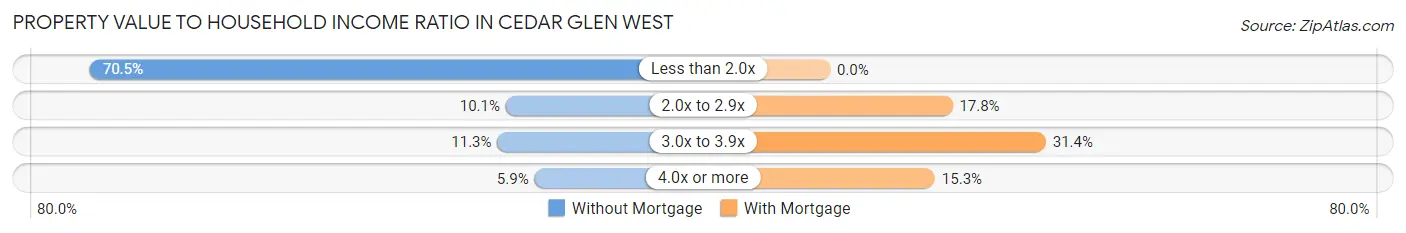
| Value-to-Income Ratio | Without Mortgage | With Mortgage |
| Less than 2.0x | 524 (70.5%) | 0 (0.0%) |
| 2.0x to 2.9x | 75 (10.1%) | 21 (17.8%) |
| 3.0x to 3.9x | 84 (11.3%) | 37 (31.4%) |
| 4.0x or more | 44 (5.9%) | 18 (15.2%) |
| Total | 743 (100.0%) | 118 (100.0%) |
Real Estate Taxes by Mortgage Status in Cedar Glen West
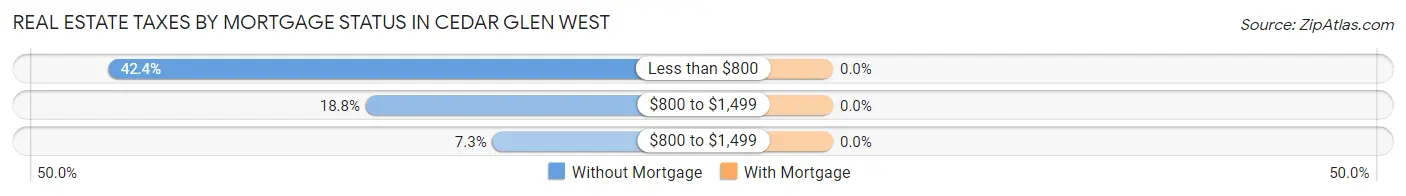
| Property Taxes | Without Mortgage | With Mortgage |
| Less than $800 | 315 (42.4%) | 0 (0.0%) |
| $800 to $1,499 | 140 (18.8%) | 0 (0.0%) |
| $800 to $1,499 | 54 (7.3%) | 0 (0.0%) |
| Total | 743 (100.0%) | 118 (100.0%) |
Health & Disability in Cedar Glen West
Health Insurance Coverage by Age in Cedar Glen West
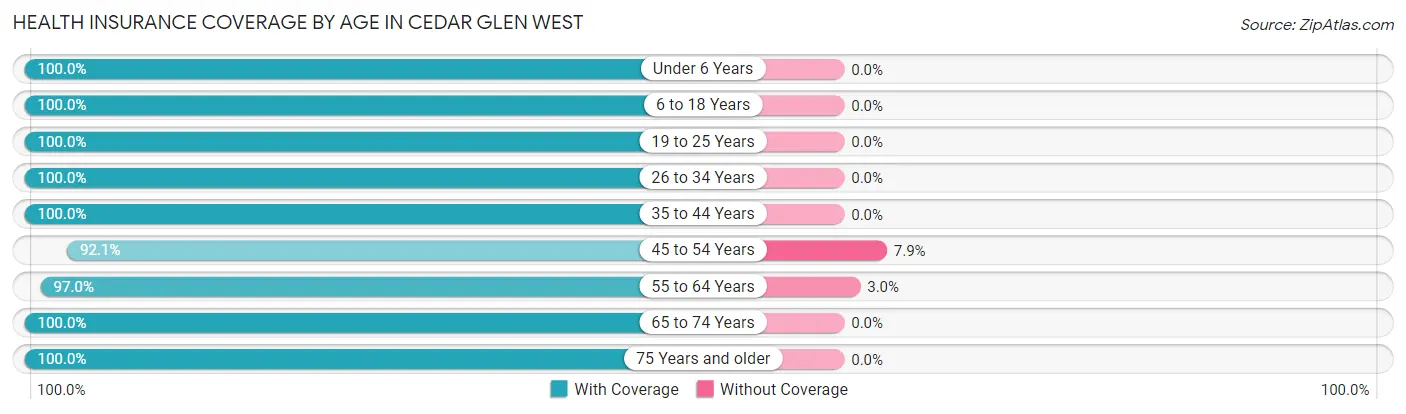
| Age Bracket | With Coverage | Without Coverage |
| Under 6 Years | 45 (100.0%) | 0 (0.0%) |
| 6 to 18 Years | 146 (100.0%) | 0 (0.0%) |
| 19 to 25 Years | 37 (100.0%) | 0 (0.0%) |
| 26 to 34 Years | 181 (100.0%) | 0 (0.0%) |
| 35 to 44 Years | 92 (100.0%) | 0 (0.0%) |
| 45 to 54 Years | 209 (92.1%) | 18 (7.9%) |
| 55 to 64 Years | 423 (97.0%) | 13 (3.0%) |
| 65 to 74 Years | 180 (100.0%) | 0 (0.0%) |
| 75 Years and older | 646 (100.0%) | 0 (0.0%) |
| Total | 1,959 (98.4%) | 31 (1.6%) |
Health Insurance Coverage by Citizenship Status in Cedar Glen West
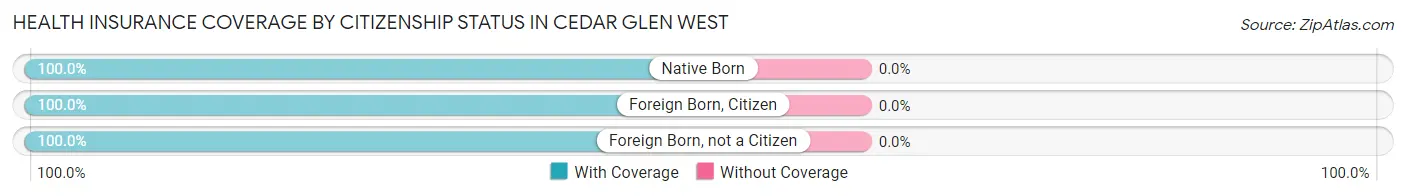
| Citizenship Status | With Coverage | Without Coverage |
| Native Born | 45 (100.0%) | 0 (0.0%) |
| Foreign Born, Citizen | 146 (100.0%) | 0 (0.0%) |
| Foreign Born, not a Citizen | 37 (100.0%) | 0 (0.0%) |
Health Insurance Coverage by Household Income in Cedar Glen West
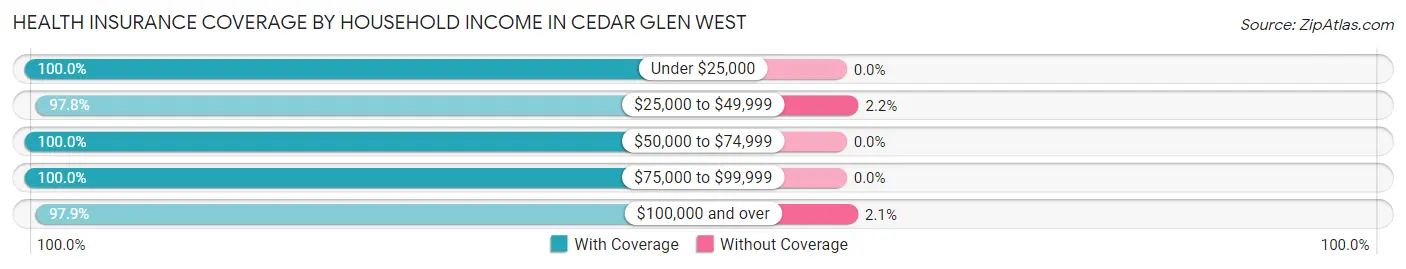
| Household Income | With Coverage | Without Coverage |
| Under $25,000 | 195 (100.0%) | 0 (0.0%) |
| $25,000 to $49,999 | 579 (97.8%) | 13 (2.2%) |
| $50,000 to $74,999 | 204 (100.0%) | 0 (0.0%) |
| $75,000 to $99,999 | 154 (100.0%) | 0 (0.0%) |
| $100,000 and over | 827 (97.9%) | 18 (2.1%) |
Public vs Private Health Insurance Coverage by Age in Cedar Glen West
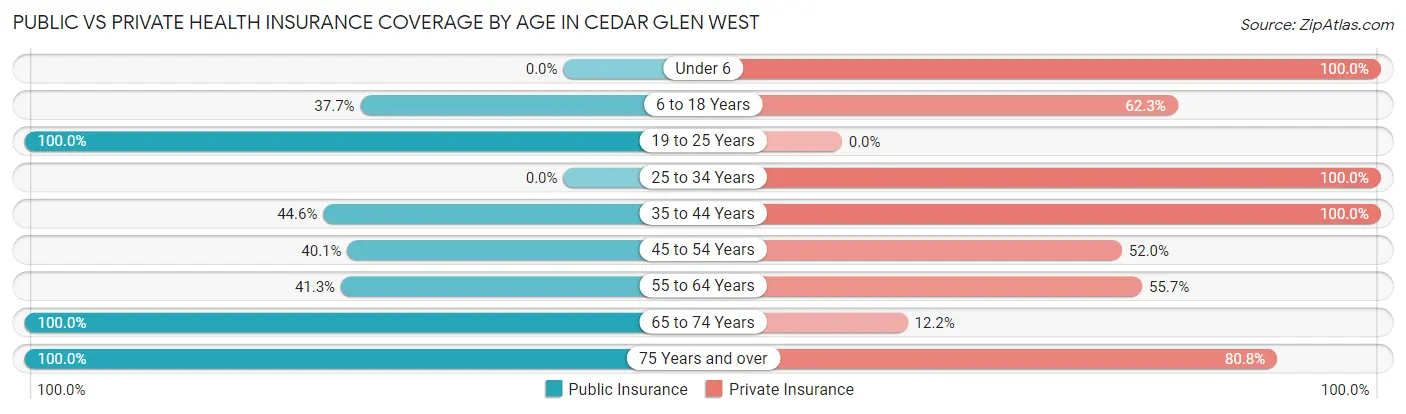
| Age Bracket | Public Insurance | Private Insurance |
| Under 6 | 0 (0.0%) | 45 (100.0%) |
| 6 to 18 Years | 55 (37.7%) | 91 (62.3%) |
| 19 to 25 Years | 37 (100.0%) | 0 (0.0%) |
| 25 to 34 Years | 0 (0.0%) | 181 (100.0%) |
| 35 to 44 Years | 41 (44.6%) | 92 (100.0%) |
| 45 to 54 Years | 91 (40.1%) | 118 (52.0%) |
| 55 to 64 Years | 180 (41.3%) | 243 (55.7%) |
| 65 to 74 Years | 180 (100.0%) | 22 (12.2%) |
| 75 Years and over | 646 (100.0%) | 522 (80.8%) |
| Total | 1,230 (61.8%) | 1,314 (66.0%) |
Disability Status by Sex by Age in Cedar Glen West
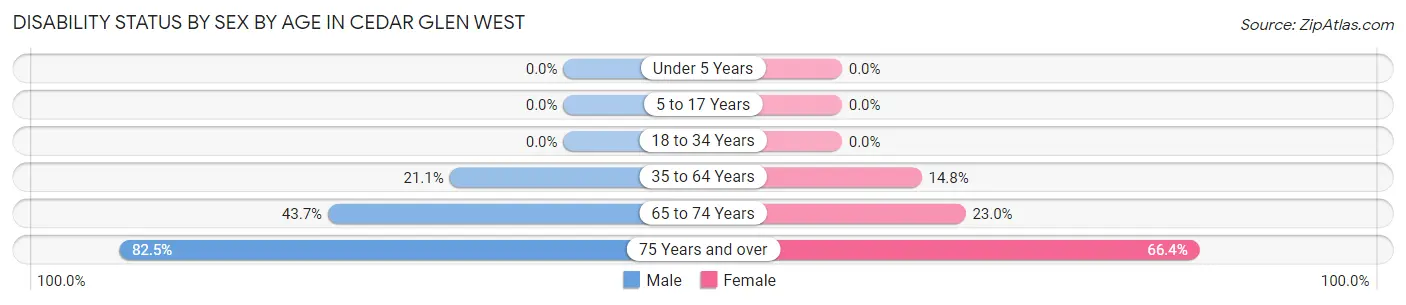
| Age Bracket | Male | Female |
| Under 5 Years | 0 (0.0%) | 0 (0.0%) |
| 5 to 17 Years | 0 (0.0%) | 0 (0.0%) |
| 18 to 34 Years | 0 (0.0%) | 0 (0.0%) |
| 35 to 64 Years | 71 (21.1%) | 62 (14.8%) |
| 65 to 74 Years | 52 (43.7%) | 14 (23.0%) |
| 75 Years and over | 226 (82.5%) | 247 (66.4%) |
Disability Class by Sex by Age in Cedar Glen West
Disability Class: Hearing Difficulty
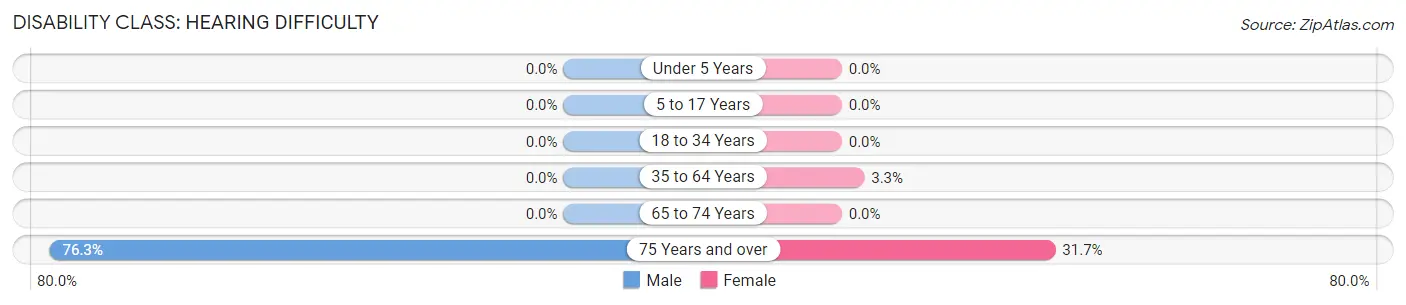
| Age Bracket | Male | Female |
| Under 5 Years | 0 (0.0%) | 0 (0.0%) |
| 5 to 17 Years | 0 (0.0%) | 0 (0.0%) |
| 18 to 34 Years | 0 (0.0%) | 0 (0.0%) |
| 35 to 64 Years | 0 (0.0%) | 14 (3.3%) |
| 65 to 74 Years | 0 (0.0%) | 0 (0.0%) |
| 75 Years and over | 209 (76.3%) | 118 (31.7%) |
Disability Class: Vision Difficulty
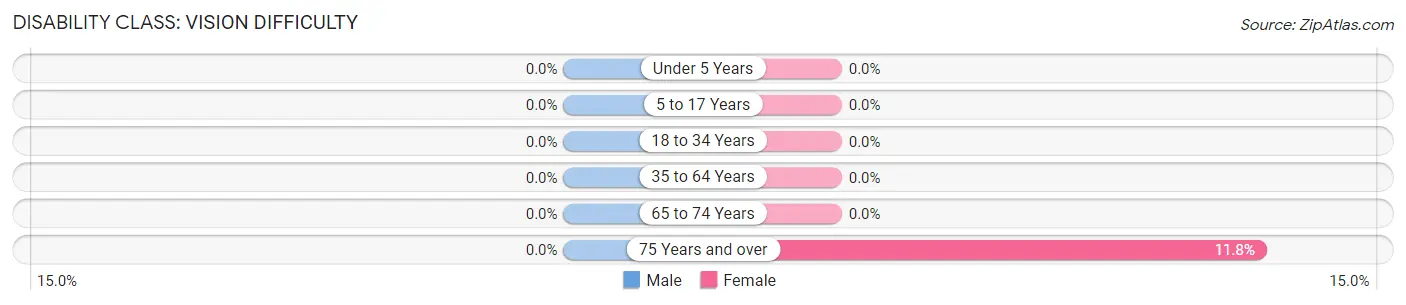
| Age Bracket | Male | Female |
| Under 5 Years | 0 (0.0%) | 0 (0.0%) |
| 5 to 17 Years | 0 (0.0%) | 0 (0.0%) |
| 18 to 34 Years | 0 (0.0%) | 0 (0.0%) |
| 35 to 64 Years | 0 (0.0%) | 0 (0.0%) |
| 65 to 74 Years | 0 (0.0%) | 0 (0.0%) |
| 75 Years and over | 0 (0.0%) | 44 (11.8%) |
Disability Class: Cognitive Difficulty
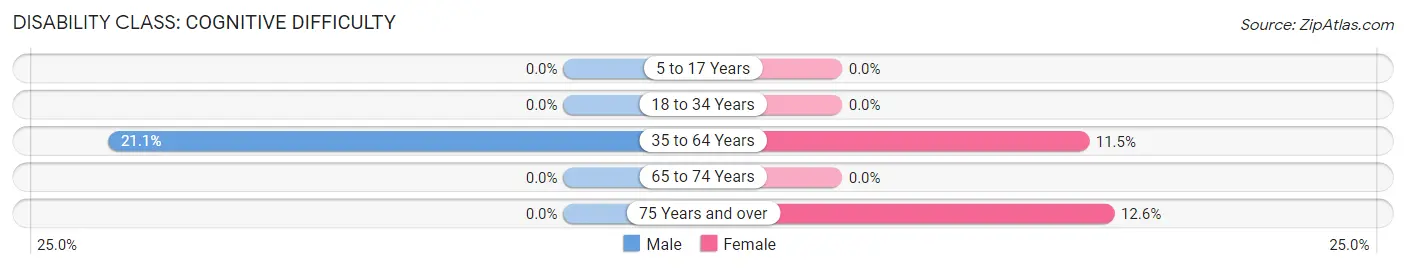
| Age Bracket | Male | Female |
| 5 to 17 Years | 0 (0.0%) | 0 (0.0%) |
| 18 to 34 Years | 0 (0.0%) | 0 (0.0%) |
| 35 to 64 Years | 71 (21.1%) | 48 (11.5%) |
| 65 to 74 Years | 0 (0.0%) | 0 (0.0%) |
| 75 Years and over | 0 (0.0%) | 47 (12.6%) |
Disability Class: Ambulatory Difficulty
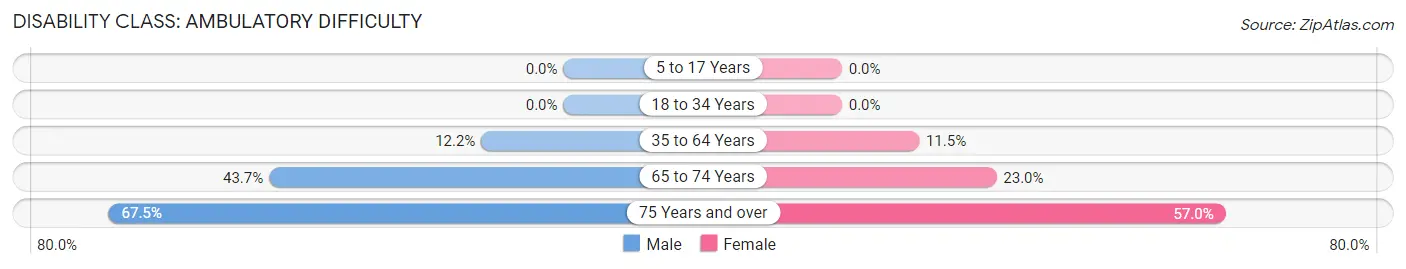
| Age Bracket | Male | Female |
| 5 to 17 Years | 0 (0.0%) | 0 (0.0%) |
| 18 to 34 Years | 0 (0.0%) | 0 (0.0%) |
| 35 to 64 Years | 41 (12.2%) | 48 (11.5%) |
| 65 to 74 Years | 52 (43.7%) | 14 (23.0%) |
| 75 Years and over | 185 (67.5%) | 212 (57.0%) |
Disability Class: Self-Care Difficulty
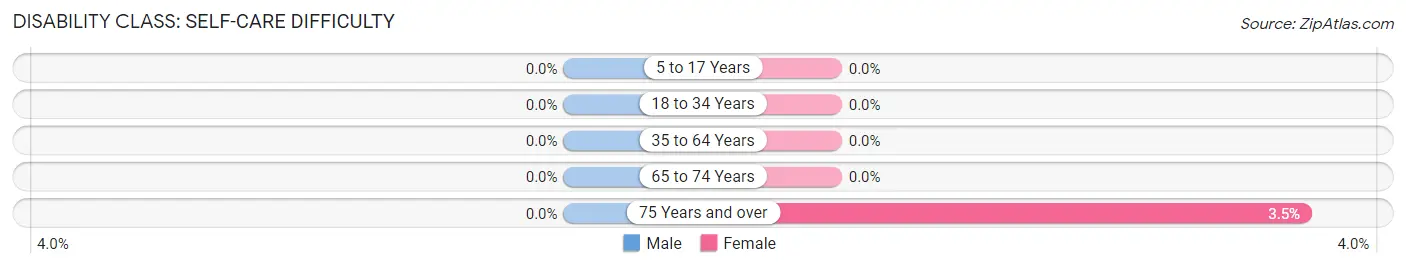
| Age Bracket | Male | Female |
| 5 to 17 Years | 0 (0.0%) | 0 (0.0%) |
| 18 to 34 Years | 0 (0.0%) | 0 (0.0%) |
| 35 to 64 Years | 0 (0.0%) | 0 (0.0%) |
| 65 to 74 Years | 0 (0.0%) | 0 (0.0%) |
| 75 Years and over | 0 (0.0%) | 13 (3.5%) |
Technology Access in Cedar Glen West
Computing Device Access in Cedar Glen West
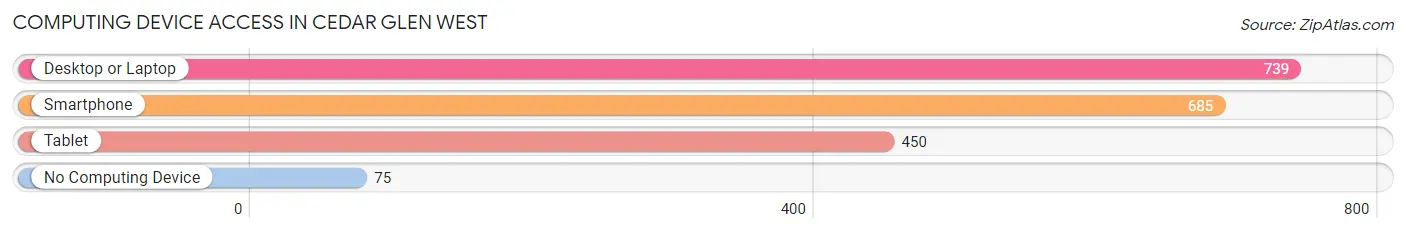
| Device Type | # Households | % Households |
| Desktop or Laptop | 739 | 79.7% |
| Smartphone | 685 | 73.9% |
| Tablet | 450 | 48.5% |
| No Computing Device | 75 | 8.1% |
| Total | 927 | 100.0% |
Internet Access in Cedar Glen West
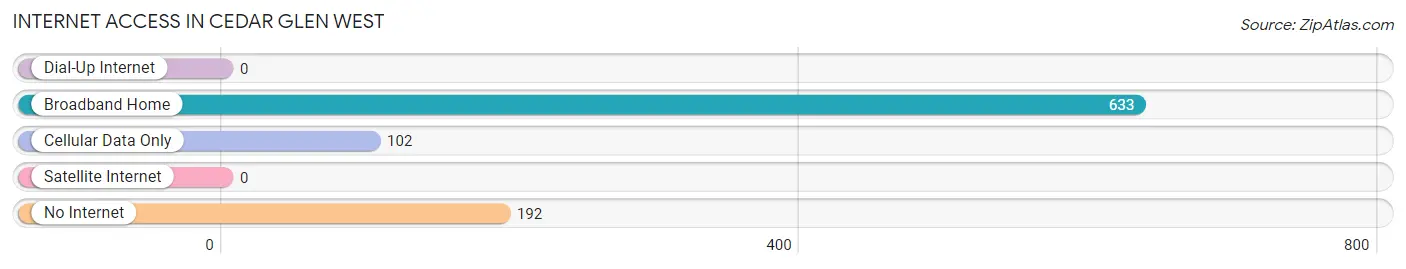
| Internet Type | # Households | % Households |
| Dial-Up Internet | 0 | 0.0% |
| Broadband Home | 633 | 68.3% |
| Cellular Data Only | 102 | 11.0% |
| Satellite Internet | 0 | 0.0% |
| No Internet | 192 | 20.7% |
| Total | 927 | 100.0% |
Cedar Glen West Summary
Cedar Glen West is a small unincorporated community located in Ocean County, New Jersey. It is situated in the northern part of the county, just south of the border with Monmouth County. The community is located within the New Jersey Pine Barrens, a unique and ecologically diverse region of the state. Cedar Glen West is home to a diverse population of approximately 1,000 people, and is a popular destination for outdoor recreation and relaxation.
History
Cedar Glen West was first settled in the late 1700s by a group of Quakers from Pennsylvania. The Quakers were attracted to the area due to its abundance of natural resources, including cedar trees, which were used to build homes and other structures. The community was originally known as Cedar Glen, but the name was changed to Cedar Glen West in the early 1900s to distinguish it from another community in the area.
Geography
Cedar Glen West is located in the northern part of Ocean County, just south of the border with Monmouth County. The community is situated within the New Jersey Pine Barrens, a unique and ecologically diverse region of the state. The area is characterized by sandy soils, pine forests, and numerous freshwater wetlands. The community is located near the Manasquan River, which provides a variety of recreational opportunities, including fishing, boating, and swimming.
Economy
Cedar Glen West is primarily a residential community, with most of its residents employed in nearby towns and cities. The community does have a few small businesses, including a convenience store, a gas station, and a few restaurants. The area is also home to a number of small farms, which produce a variety of fruits and vegetables.
Demographics
As of the 2010 census, Cedar Glen West had a population of 1,000 people. The racial makeup of the community was 94.2% White, 2.2% African American, 0.7% Asian, 0.3% Native American, and 2.6% from other races. The median household income was $50,000, and the median age was 44.
Conclusion
Cedar Glen West is a small unincorporated community located in Ocean County, New Jersey. It is situated in the northern part of the county, just south of the border with Monmouth County. The community is located within the New Jersey Pine Barrens, a unique and ecologically diverse region of the state. Cedar Glen West is home to a diverse population of approximately 1,000 people, and is a popular destination for outdoor recreation and relaxation. The area is primarily residential, with most of its residents employed in nearby towns and cities. The community does have a few small businesses, including a convenience store, a gas station, and a few restaurants. The area is also home to a number of small farms, which produce a variety of fruits and vegetables.
Common Questions
What is Per Capita Income in Cedar Glen West?
Per Capita income in Cedar Glen West is $44,159.
What is the Median Family Income in Cedar Glen West?
Median Family Income in Cedar Glen West is $70,924.
What is the Median Household income in Cedar Glen West?
Median Household Income in Cedar Glen West is $50,365.
What is Inequality or Gini Index in Cedar Glen West?
Inequality or Gini Index in Cedar Glen West is 0.56.
What is the Total Population of Cedar Glen West?
Total Population of Cedar Glen West is 1,990.
What is the Total Male Population of Cedar Glen West?
Total Male Population of Cedar Glen West is 925.
What is the Total Female Population of Cedar Glen West?
Total Female Population of Cedar Glen West is 1,065.
What is the Ratio of Males per 100 Females in Cedar Glen West?
There are 86.85 Males per 100 Females in Cedar Glen West.
What is the Ratio of Females per 100 Males in Cedar Glen West?
There are 115.14 Females per 100 Males in Cedar Glen West.
What is the Median Population Age in Cedar Glen West?
Median Population Age in Cedar Glen West is 59.6 Years.
What is the Average Family Size in Cedar Glen West
Average Family Size in Cedar Glen West is 2.6 People.
What is the Average Household Size in Cedar Glen West
Average Household Size in Cedar Glen West is 2.1 People.
How Large is the Labor Force in Cedar Glen West?
There are 899 People in the Labor Forcein in Cedar Glen West.
What is the Percentage of People in the Labor Force in Cedar Glen West?
48.8% of People are in the Labor Force in Cedar Glen West.
What is the Unemployment Rate in Cedar Glen West?
Unemployment Rate in Cedar Glen West is 4.8%.