Zip Codes with the Highest Percentage of Population with a Degree in Liberal Arts and History in Plainfield, NJ
RELATED REPORTS & OPTIONS
Liberal Arts and History
Plainfield
Compare Zip Codes
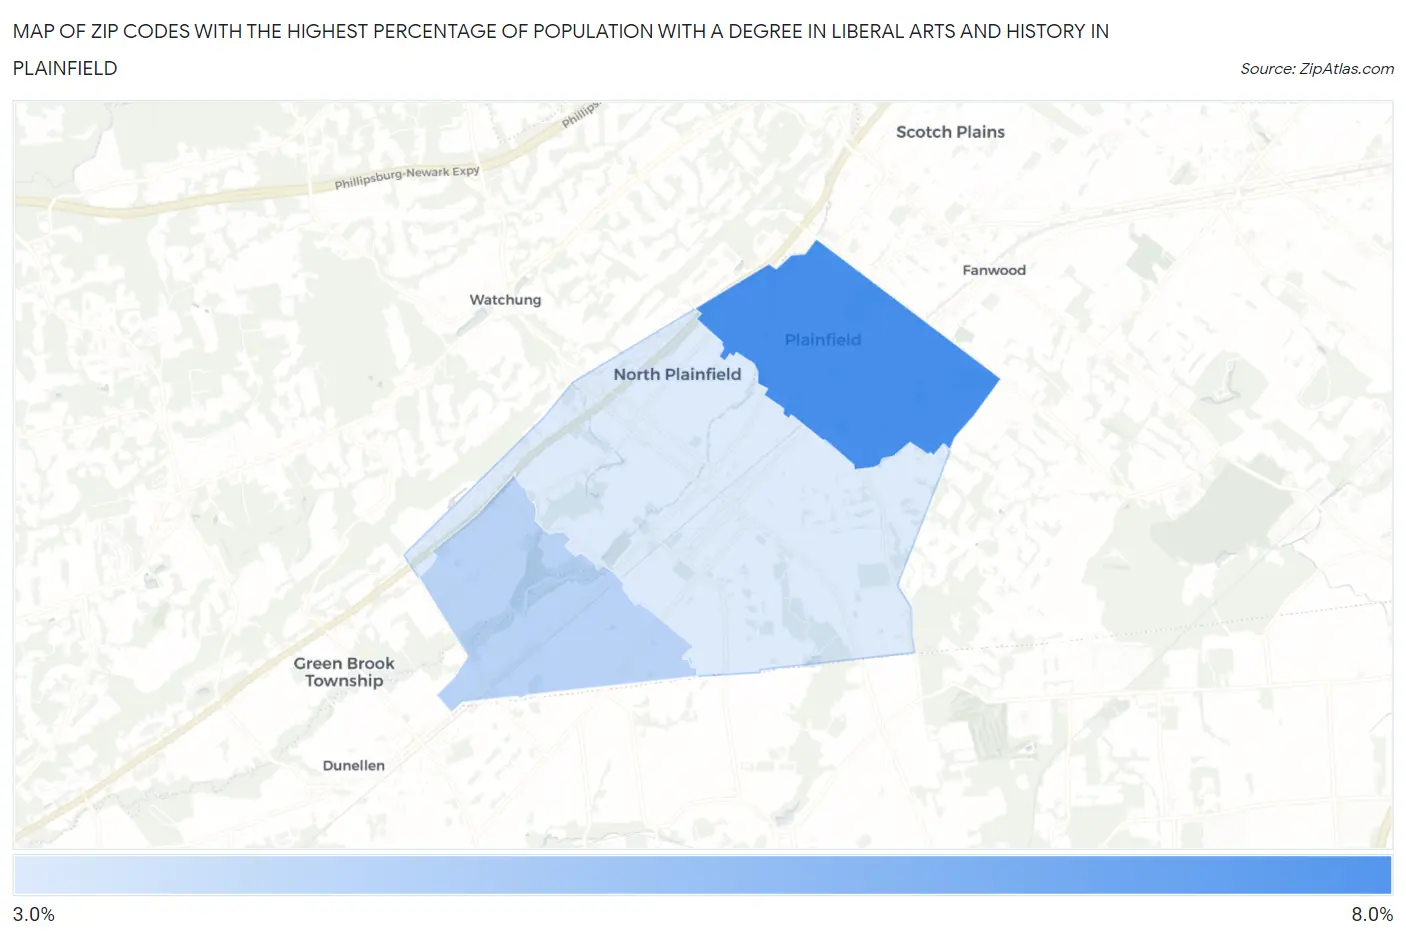
Map of Zip Codes with the Highest Percentage of Population with a Degree in Liberal Arts and History in Plainfield
3.7%
8.0%
Zip Codes with the Highest Percentage of Population with a Degree in Liberal Arts and History in Plainfield, NJ
| Zip Code | % Graduates | vs State | vs National | |
| 1. | 07062 | 8.0% | 4.6%(+3.40)#55 | 4.9%(+3.09)#4,941 |
| 2. | 07063 | 4.8% | 4.6%(+0.186)#226 | 4.9%(-0.117)#12,145 |
| 3. | 07060 | 3.7% | 4.6%(-0.830)#336 | 4.9%(-1.13)#15,743 |
1
Common Questions
What are the Top Zip Codes with the Highest Percentage of Population with a Degree in Liberal Arts and History in Plainfield, NJ?
Top Zip Codes with the Highest Percentage of Population with a Degree in Liberal Arts and History in Plainfield, NJ are:
What zip code has the Highest Percentage of Population with a Degree in Liberal Arts and History in Plainfield, NJ?
07062 has the Highest Percentage of Population with a Degree in Liberal Arts and History in Plainfield, NJ with 8.0%.
What is the Percentage of Population with a Degree in Liberal Arts and History in Plainfield, NJ?
Percentage of Population with a Degree in Liberal Arts and History in Plainfield is 5.2%.
What is the Percentage of Population with a Degree in Liberal Arts and History in New Jersey?
Percentage of Population with a Degree in Liberal Arts and History in New Jersey is 4.6%.
What is the Percentage of Population with a Degree in Liberal Arts and History in the United States?
Percentage of Population with a Degree in Liberal Arts and History in the United States is 4.9%.