Zip Codes with the Highest Percentage of Population with a Degree in Liberal Arts and History in Clifton, NJ
RELATED REPORTS & OPTIONS
Liberal Arts and History
Clifton
Compare Zip Codes
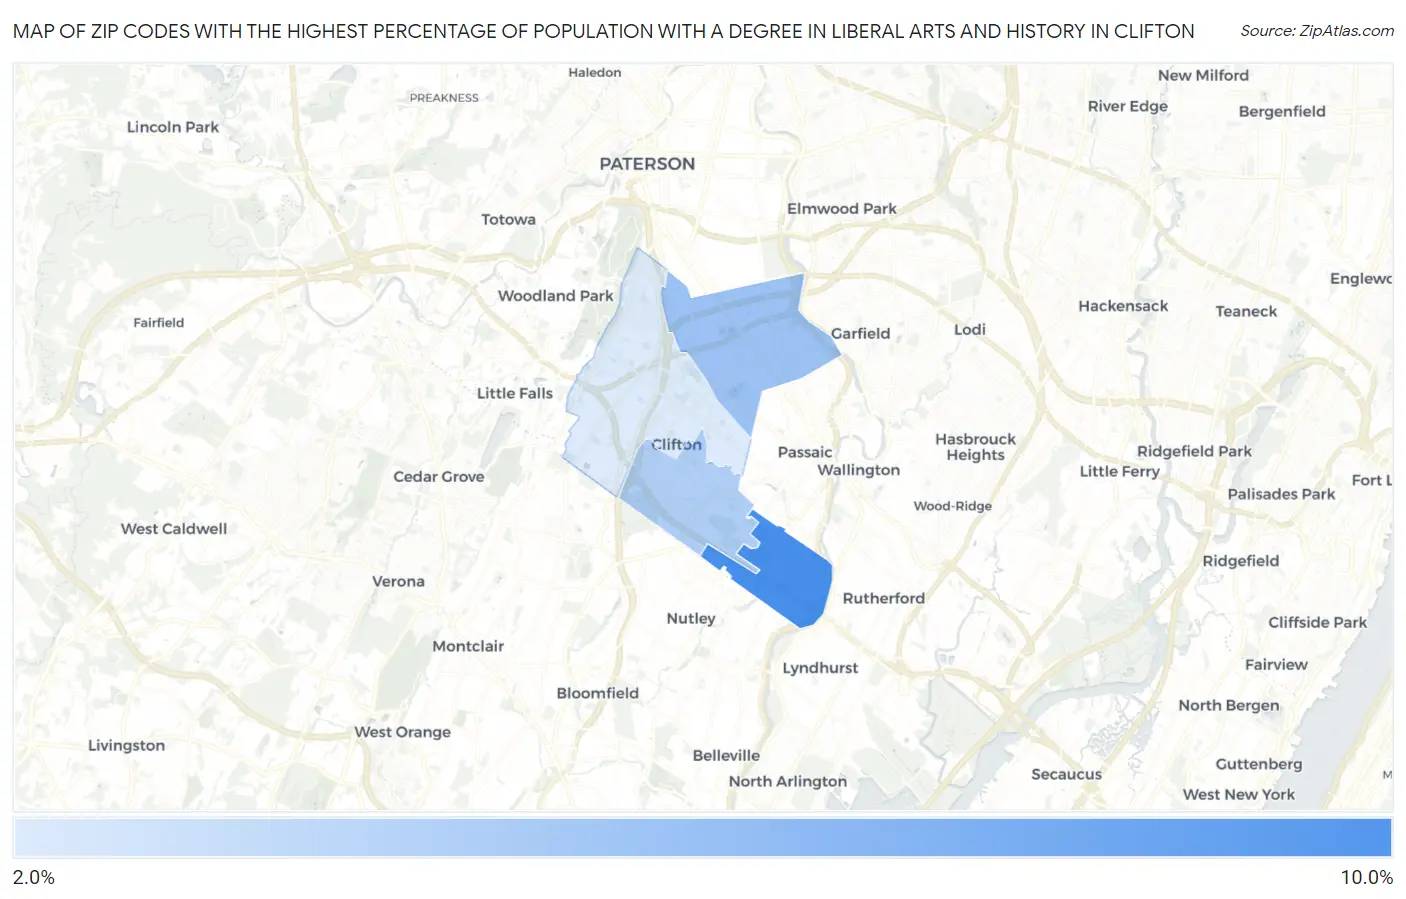
Map of Zip Codes with the Highest Percentage of Population with a Degree in Liberal Arts and History in Clifton
2.4%
8.8%
Zip Codes with the Highest Percentage of Population with a Degree in Liberal Arts and History in Clifton, NJ
| Zip Code | % Graduates | vs State | vs National | |
| 1. | 07014 | 8.8% | 4.6%(+4.21)#45 | 4.9%(+3.90)#4,054 |
| 2. | 07011 | 5.1% | 4.6%(+0.577)#193 | 4.9%(+0.274)#10,885 |
| 3. | 07012 | 4.4% | 4.6%(-0.196)#265 | 4.9%(-0.499)#13,386 |
| 4. | 07013 | 2.4% | 4.6%(-2.14)#471 | 4.9%(-2.44)#20,190 |
1
Common Questions
What are the Top 3 Zip Codes with the Highest Percentage of Population with a Degree in Liberal Arts and History in Clifton, NJ?
Top 3 Zip Codes with the Highest Percentage of Population with a Degree in Liberal Arts and History in Clifton, NJ are:
What zip code has the Highest Percentage of Population with a Degree in Liberal Arts and History in Clifton, NJ?
07014 has the Highest Percentage of Population with a Degree in Liberal Arts and History in Clifton, NJ with 8.8%.
What is the Percentage of Population with a Degree in Liberal Arts and History in Clifton, NJ?
Percentage of Population with a Degree in Liberal Arts and History in Clifton is 4.1%.
What is the Percentage of Population with a Degree in Liberal Arts and History in New Jersey?
Percentage of Population with a Degree in Liberal Arts and History in New Jersey is 4.6%.
What is the Percentage of Population with a Degree in Liberal Arts and History in the United States?
Percentage of Population with a Degree in Liberal Arts and History in the United States is 4.9%.