Leisure Village East, NJ Map & Demographics
Leisure Village East Map
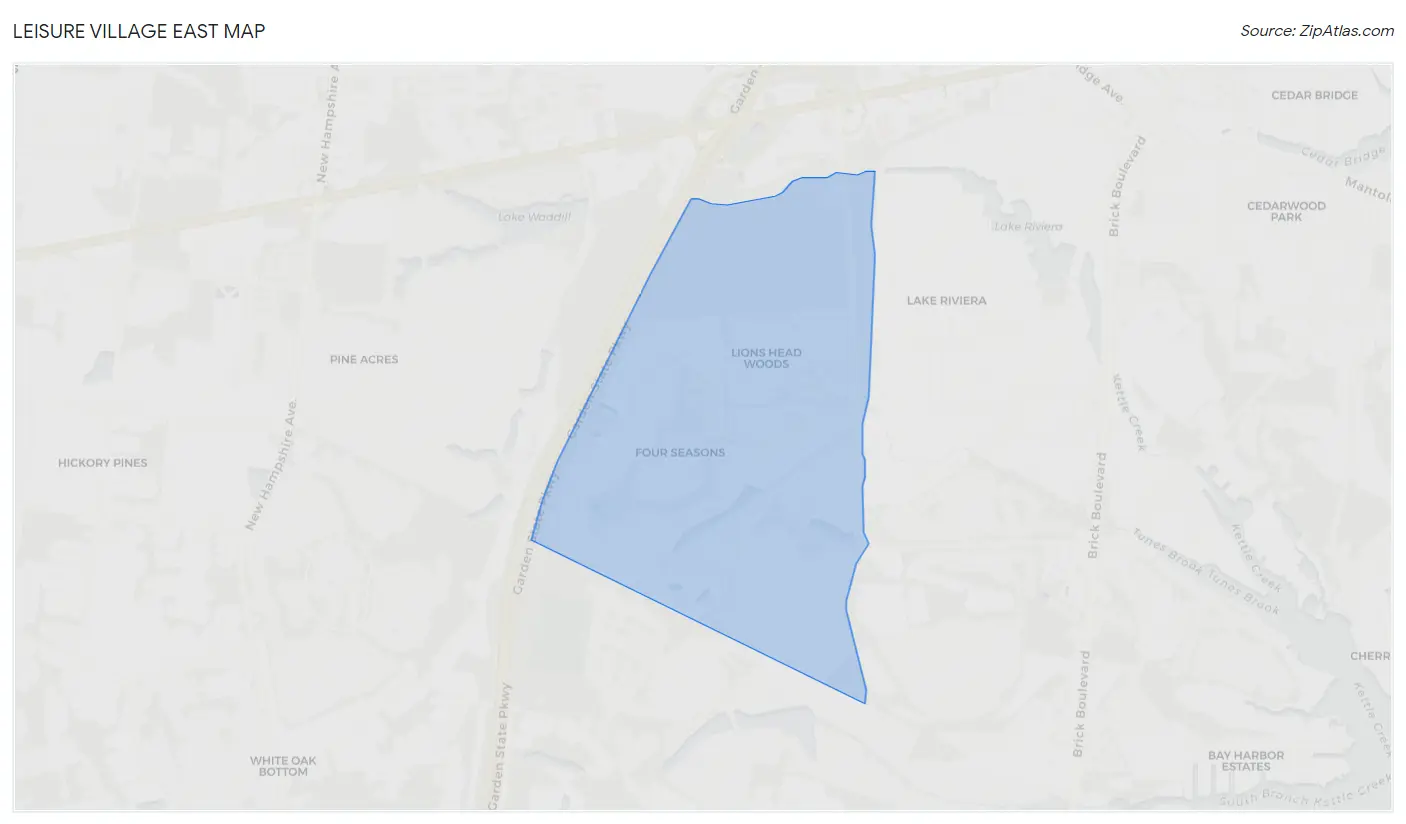
Leisure Village East Overview
$49,493
PER CAPITA INCOME
$61,319
AVG FAMILY INCOME
$45,395
AVG HOUSEHOLD INCOME
0.52
INEQUALITY / GINI INDEX
4,653
TOTAL POPULATION
1,924
MALE POPULATION
2,729
FEMALE POPULATION
70.50
MALES / 100 FEMALES
141.84
FEMALES / 100 MALES
74.9
MEDIAN AGE
2.1
AVG FAMILY SIZE
1.5
AVG HOUSEHOLD SIZE
1,121
LABOR FORCE [ PEOPLE ]
24.1%
PERCENT IN LABOR FORCE
17.2%
UNEMPLOYMENT RATE
Income in Leisure Village East
Income Overview in Leisure Village East
Per Capita Income in Leisure Village East is $49,493, while median incomes of families and households are $61,319 and $45,395 respectively.
| Characteristic | Number | Measure |
| Per Capita Income | 4,653 | $49,493 |
| Median Family Income | 1,363 | $61,319 |
| Mean Family Income | 1,363 | $78,732 |
| Median Household Income | 3,046 | $45,395 |
| Mean Household Income | 3,046 | $75,244 |
| Income Deficit | 1,363 | $0 |
| Wage / Income Gap (%) | 4,653 | 0.00% |
| Wage / Income Gap ($) | 4,653 | 100.00¢ per $1 |
| Gini / Inequality Index | 4,653 | 0.52 |
Earnings by Sex in Leisure Village East
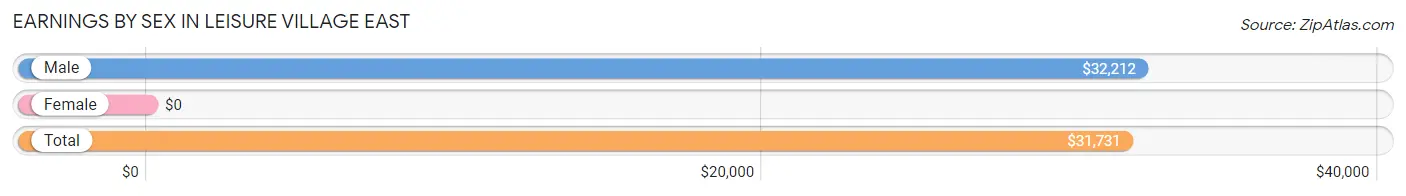
| Sex | Number | Average Earnings |
| Male | 674 (52.0%) | $32,212 |
| Female | 622 (48.0%) | $0 |
| Total | 1,296 (100.0%) | $31,731 |
Earnings by Sex by Income Bracket in Leisure Village East
The most common earnings brackets in Leisure Village East are $100,000+ for men (157 | 23.3%) and $20,000 to $22,499 for women (101 | 16.2%).
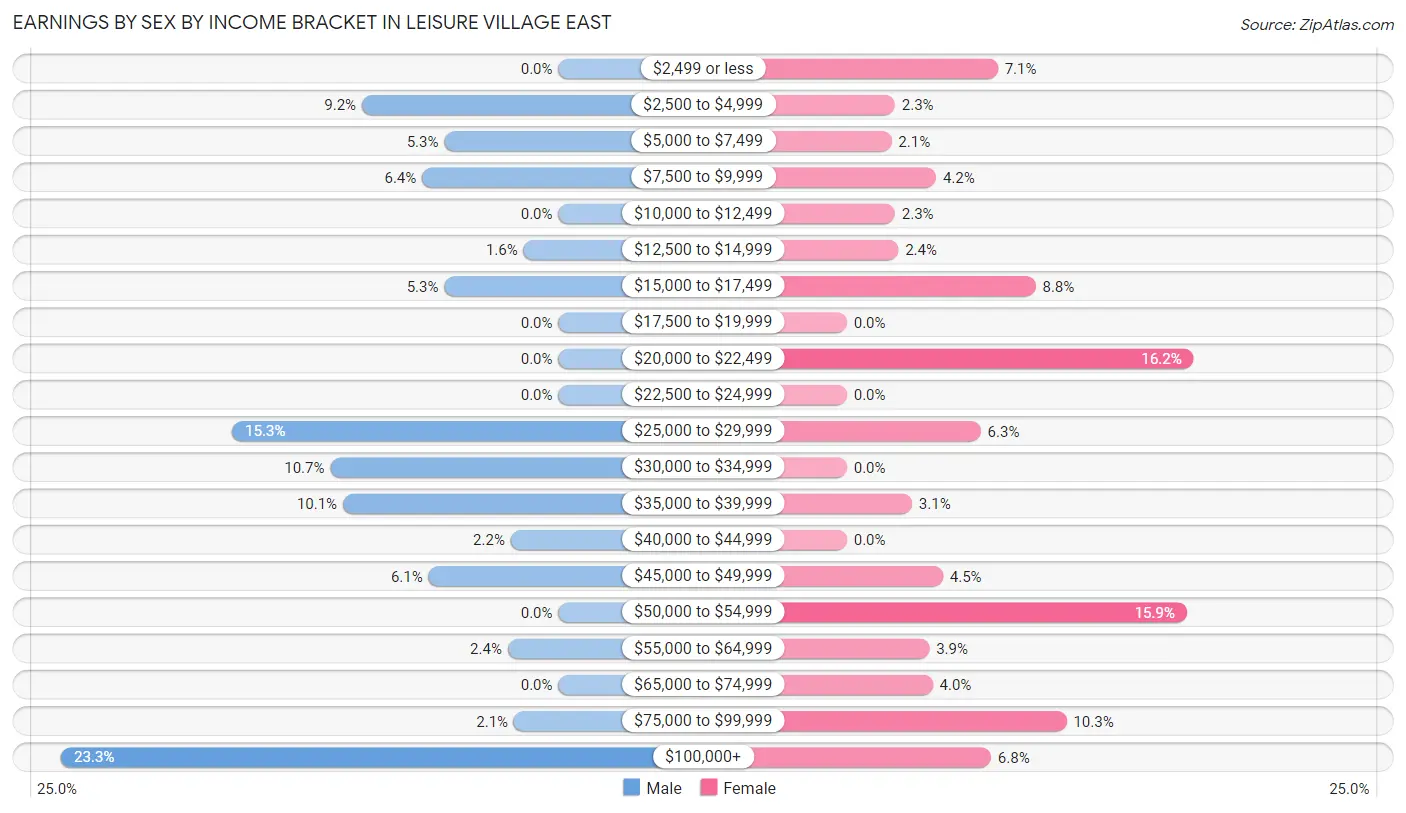
| Income | Male | Female |
| $2,499 or less | 0 (0.0%) | 44 (7.1%) |
| $2,500 to $4,999 | 62 (9.2%) | 14 (2.2%) |
| $5,000 to $7,499 | 36 (5.3%) | 13 (2.1%) |
| $7,500 to $9,999 | 43 (6.4%) | 26 (4.2%) |
| $10,000 to $12,499 | 0 (0.0%) | 14 (2.2%) |
| $12,500 to $14,999 | 11 (1.6%) | 15 (2.4%) |
| $15,000 to $17,499 | 36 (5.3%) | 55 (8.8%) |
| $17,500 to $19,999 | 0 (0.0%) | 0 (0.0%) |
| $20,000 to $22,499 | 0 (0.0%) | 101 (16.2%) |
| $22,500 to $24,999 | 0 (0.0%) | 0 (0.0%) |
| $25,000 to $29,999 | 103 (15.3%) | 39 (6.3%) |
| $30,000 to $34,999 | 72 (10.7%) | 0 (0.0%) |
| $35,000 to $39,999 | 68 (10.1%) | 19 (3.0%) |
| $40,000 to $44,999 | 15 (2.2%) | 0 (0.0%) |
| $45,000 to $49,999 | 41 (6.1%) | 28 (4.5%) |
| $50,000 to $54,999 | 0 (0.0%) | 99 (15.9%) |
| $55,000 to $64,999 | 16 (2.4%) | 24 (3.9%) |
| $65,000 to $74,999 | 0 (0.0%) | 25 (4.0%) |
| $75,000 to $99,999 | 14 (2.1%) | 64 (10.3%) |
| $100,000+ | 157 (23.3%) | 42 (6.8%) |
| Total | 674 (100.0%) | 622 (100.0%) |
Earnings by Sex by Educational Attainment in Leisure Village East
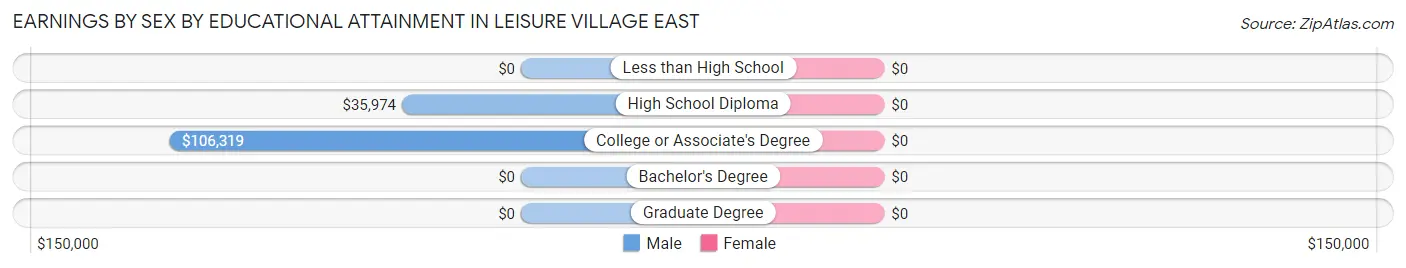
| Educational Attainment | Male Income | Female Income |
| Less than High School | - | - |
| High School Diploma | $35,974 | $0 |
| College or Associate's Degree | $106,319 | $0 |
| Bachelor's Degree | - | - |
| Graduate Degree | - | - |
| Total | $32,212 | $0 |
Family Income in Leisure Village East
Family Income Brackets in Leisure Village East
According to the Leisure Village East family income data, there are 399 families falling into the $50,000 to $74,999 income range, which is the most common income bracket and makes up 29.3% of all families.
| Income Bracket | # Families | % Families |
| Less than $10,000 | 0 | 0.0% |
| $10,000 to $14,999 | 31 | 2.3% |
| $15,000 to $24,999 | 49 | 3.6% |
| $25,000 to $34,999 | 185 | 13.6% |
| $35,000 to $49,999 | 294 | 21.6% |
| $50,000 to $74,999 | 399 | 29.3% |
| $75,000 to $99,999 | 176 | 12.9% |
| $100,000 to $149,999 | 170 | 12.5% |
| $150,000 to $199,999 | 18 | 1.3% |
| $200,000+ | 37 | 2.7% |
Family Income by Famaliy Size in Leisure Village East
3-person families (56 | 4.1%) account for the highest median family income in Leisure Village East with $113,900 per family, while 3-person families (56 | 4.1%) have the highest median income of $37,967 per family member.
| Income Bracket | # Families | Median Income |
| 2-Person Families | 1,307 (95.9%) | $57,474 |
| 3-Person Families | 56 (4.1%) | $113,900 |
| 4-Person Families | 0 (0.0%) | $0 |
| 5-Person Families | 0 (0.0%) | $0 |
| 6-Person Families | 0 (0.0%) | $0 |
| 7+ Person Families | 0 (0.0%) | $0 |
| Total | 1,363 (100.0%) | $61,319 |
Family Income by Number of Earners in Leisure Village East
| Number of Earners | # Families | Median Income |
| No Earners | 786 (57.7%) | $49,412 |
| 1 Earner | 374 (27.4%) | $52,391 |
| 2 Earners | 178 (13.1%) | $92,500 |
| 3+ Earners | 25 (1.8%) | $0 |
| Total | 1,363 (100.0%) | $61,319 |
Household Income in Leisure Village East
Household Income Brackets in Leisure Village East
With 627 households falling in the category, the $35,000 to $49,999 income range is the most frequent in Leisure Village East, accounting for 20.6% of all households. In contrast, only 46 households (1.5%) fall into the $150,000 to $199,999 income bracket, making it the least populous group.
| Income Bracket | # Households | % Households |
| Less than $10,000 | 125 | 4.1% |
| $10,000 to $14,999 | 88 | 2.9% |
| $15,000 to $24,999 | 347 | 11.4% |
| $25,000 to $34,999 | 536 | 17.6% |
| $35,000 to $49,999 | 627 | 20.6% |
| $50,000 to $74,999 | 591 | 19.4% |
| $75,000 to $99,999 | 256 | 8.4% |
| $100,000 to $149,999 | 314 | 10.3% |
| $150,000 to $199,999 | 46 | 1.5% |
| $200,000+ | 119 | 3.9% |
Household Income by Householder Age in Leisure Village East
The median household income in Leisure Village East is $45,395, with the highest median household income of $94,890 found in the 45 to 64 years age bracket for the primary householder. A total of 474 households (15.6%) fall into this category.
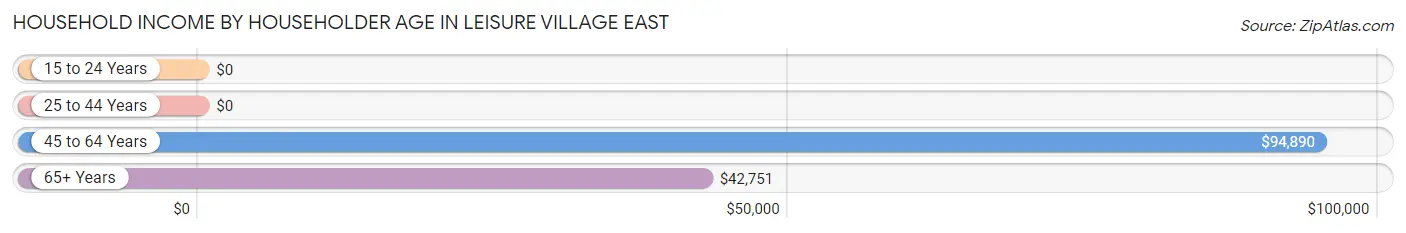
| Income Bracket | # Households | Median Income |
| 15 to 24 Years | 0 (0.0%) | $0 |
| 25 to 44 Years | 0 (0.0%) | $0 |
| 45 to 64 Years | 474 (15.6%) | $94,890 |
| 65+ Years | 2,572 (84.4%) | $42,751 |
| Total | 3,046 (100.0%) | $45,395 |
Poverty in Leisure Village East
Income Below Poverty by Sex and Age in Leisure Village East
With 8.6% poverty level for males and 7.8% for females among the residents of Leisure Village East, 25 to 34 year old males and 55 to 64 year old females are the most vulnerable to poverty, with 67 males (51.5%) and 29 females (11.2%) in their respective age groups living below the poverty level.
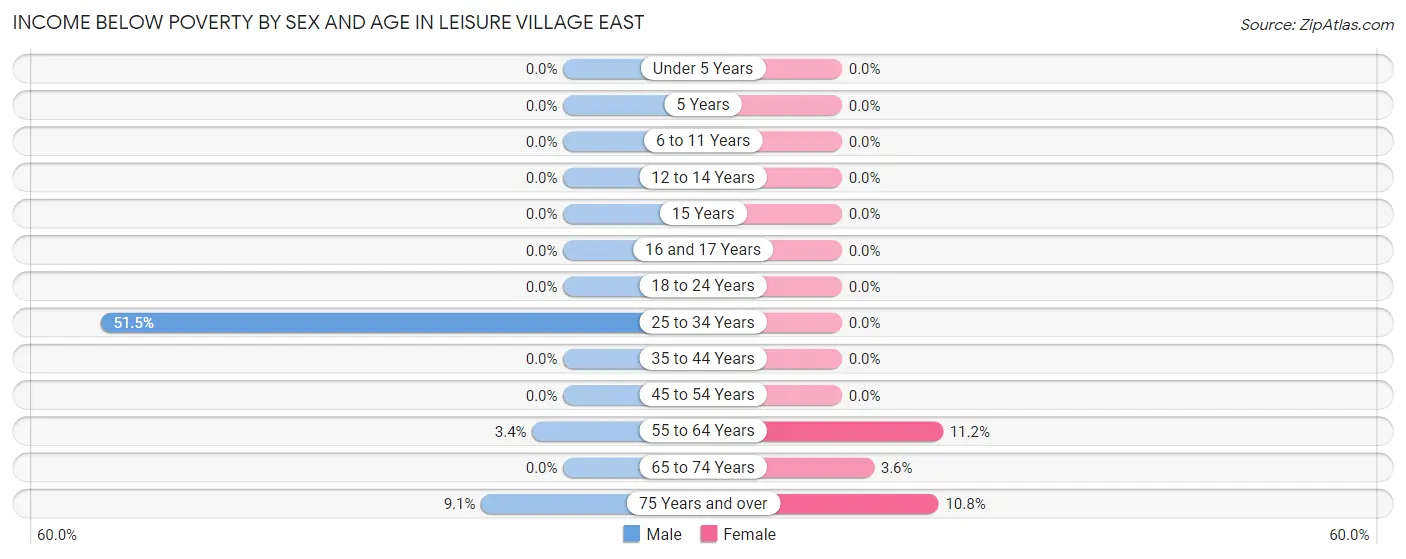
| Age Bracket | Male | Female |
| Under 5 Years | 0 (0.0%) | 0 (0.0%) |
| 5 Years | 0 (0.0%) | 0 (0.0%) |
| 6 to 11 Years | 0 (0.0%) | 0 (0.0%) |
| 12 to 14 Years | 0 (0.0%) | 0 (0.0%) |
| 15 Years | 0 (0.0%) | 0 (0.0%) |
| 16 and 17 Years | 0 (0.0%) | 0 (0.0%) |
| 18 to 24 Years | 0 (0.0%) | 0 (0.0%) |
| 25 to 34 Years | 67 (51.5%) | 0 (0.0%) |
| 35 to 44 Years | 0 (0.0%) | 0 (0.0%) |
| 45 to 54 Years | 0 (0.0%) | 0 (0.0%) |
| 55 to 64 Years | 14 (3.4%) | 29 (11.2%) |
| 65 to 74 Years | 0 (0.0%) | 32 (3.6%) |
| 75 Years and over | 84 (9.1%) | 151 (10.8%) |
| Total | 165 (8.6%) | 212 (7.8%) |
Income Above Poverty by Sex and Age in Leisure Village East
According to the poverty statistics in Leisure Village East, males aged 35 to 44 years and females aged 25 to 34 years are the age groups that are most secure financially, with 100.0% of males and 100.0% of females in these age groups living above the poverty line.
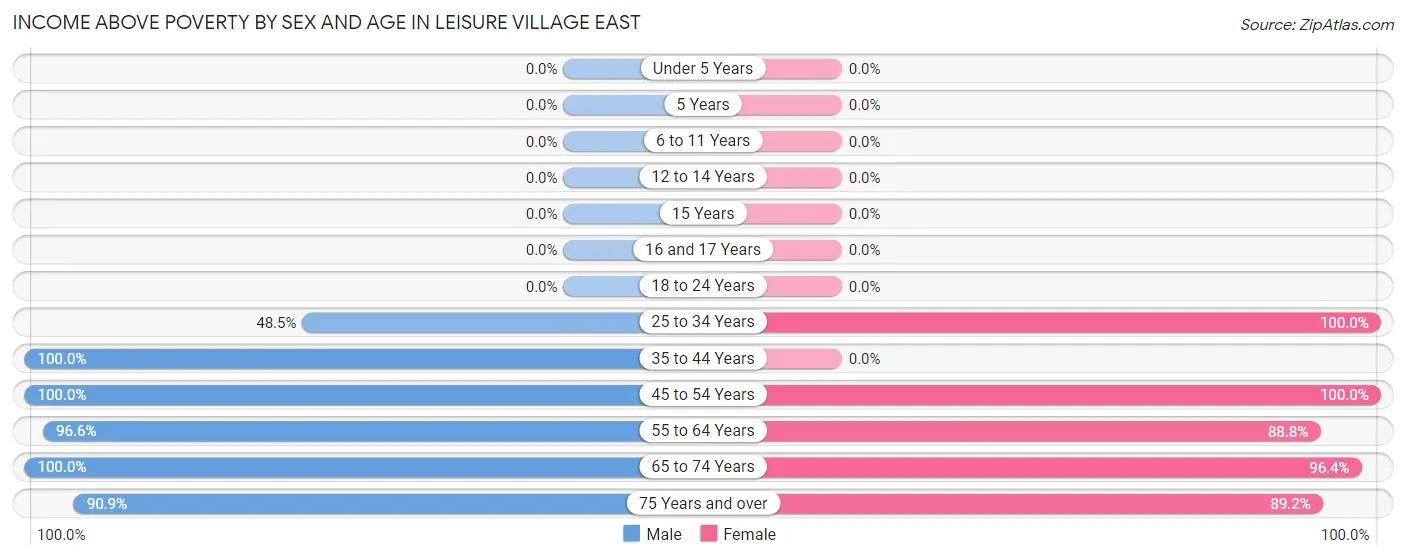
| Age Bracket | Male | Female |
| Under 5 Years | 0 (0.0%) | 0 (0.0%) |
| 5 Years | 0 (0.0%) | 0 (0.0%) |
| 6 to 11 Years | 0 (0.0%) | 0 (0.0%) |
| 12 to 14 Years | 0 (0.0%) | 0 (0.0%) |
| 15 Years | 0 (0.0%) | 0 (0.0%) |
| 16 and 17 Years | 0 (0.0%) | 0 (0.0%) |
| 18 to 24 Years | 0 (0.0%) | 0 (0.0%) |
| 25 to 34 Years | 63 (48.5%) | 28 (100.0%) |
| 35 to 44 Years | 42 (100.0%) | 0 (0.0%) |
| 45 to 54 Years | 41 (100.0%) | 143 (100.0%) |
| 55 to 64 Years | 393 (96.6%) | 229 (88.8%) |
| 65 to 74 Years | 385 (100.0%) | 866 (96.4%) |
| 75 Years and over | 835 (90.9%) | 1,251 (89.2%) |
| Total | 1,759 (91.4%) | 2,517 (92.2%) |
Income Below Poverty Among Married-Couple Families in Leisure Village East
The poverty statistics for married-couple families in Leisure Village East show that 3.0% or 32 of the total 1,055 families live below the poverty line. Families with no children have the highest poverty rate of 3.0%, comprising of 32 families. On the other hand, families with no children have the lowest poverty rate of 3.0%, which includes 32 families.
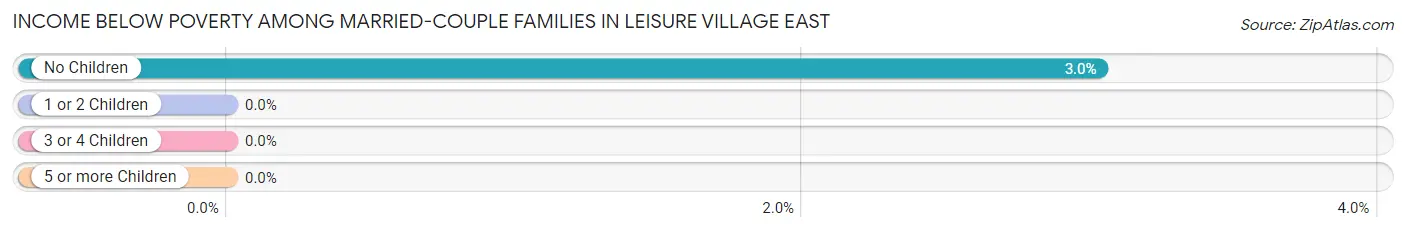
| Children | Above Poverty | Below Poverty |
| No Children | 1,023 (97.0%) | 32 (3.0%) |
| 1 or 2 Children | 0 (0.0%) | 0 (0.0%) |
| 3 or 4 Children | 0 (0.0%) | 0 (0.0%) |
| 5 or more Children | 0 (0.0%) | 0 (0.0%) |
| Total | 1,023 (97.0%) | 32 (3.0%) |
Income Below Poverty Among Single-Parent Households in Leisure Village East
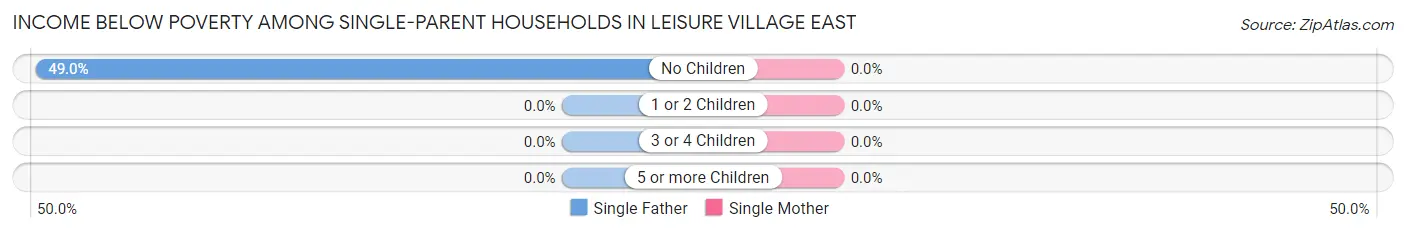
| Children | Single Father | Single Mother |
| No Children | 49 (49.0%) | 0 (0.0%) |
| 1 or 2 Children | 0 (0.0%) | 0 (0.0%) |
| 3 or 4 Children | 0 (0.0%) | 0 (0.0%) |
| 5 or more Children | 0 (0.0%) | 0 (0.0%) |
| Total | 49 (49.0%) | 0 (0.0%) |
Income Below Poverty Among Married-Couple vs Single-Parent Households in Leisure Village East
The poverty data for Leisure Village East shows that 32 of the married-couple family households (3.0%) and 49 of the single-parent households (15.9%) are living below the poverty level. Within the married-couple family households, those with no children have the highest poverty rate, with 32 households (3.0%) falling below the poverty line. Among the single-parent households, those with no children have the highest poverty rate, with 49 household (15.9%) living below poverty.
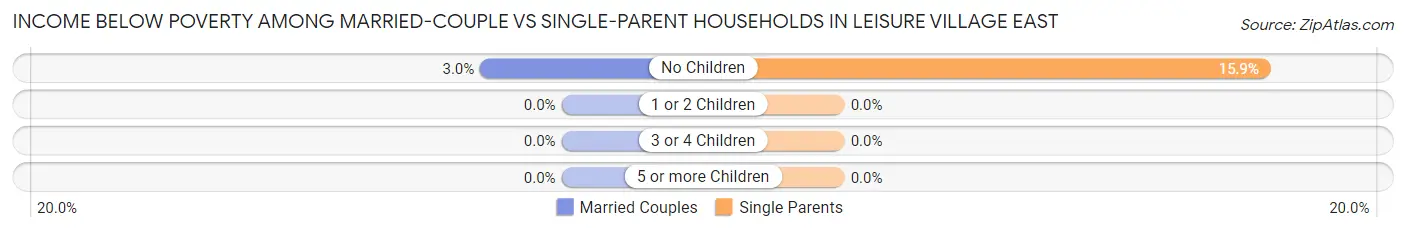
| Children | Married-Couple Families | Single-Parent Households |
| No Children | 32 (3.0%) | 49 (15.9%) |
| 1 or 2 Children | 0 (0.0%) | 0 (0.0%) |
| 3 or 4 Children | 0 (0.0%) | 0 (0.0%) |
| 5 or more Children | 0 (0.0%) | 0 (0.0%) |
| Total | 32 (3.0%) | 49 (15.9%) |
Race in Leisure Village East
The most populous races in Leisure Village East are White / Caucasian (4,519 | 97.1%), Hispanic or Latino (157 | 3.4%), and Two or more Races (82 | 1.8%).
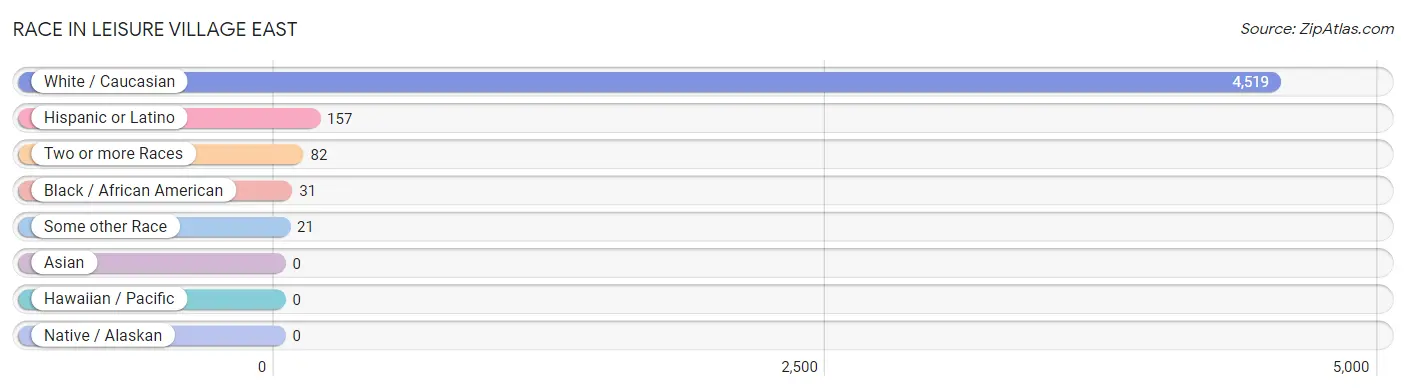
| Race | # Population | % Population |
| Asian | 0 | 0.0% |
| Black / African American | 31 | 0.7% |
| Hawaiian / Pacific | 0 | 0.0% |
| Hispanic or Latino | 157 | 3.4% |
| Native / Alaskan | 0 | 0.0% |
| White / Caucasian | 4,519 | 97.1% |
| Two or more Races | 82 | 1.8% |
| Some other Race | 21 | 0.4% |
| Total | 4,653 | 100.0% |
Ancestry in Leisure Village East
The most populous ancestries reported in Leisure Village East are Italian (1,414 | 30.4%), Irish (1,088 | 23.4%), German (756 | 16.3%), English (428 | 9.2%), and Polish (305 | 6.6%), together accounting for 85.8% of all Leisure Village East residents.
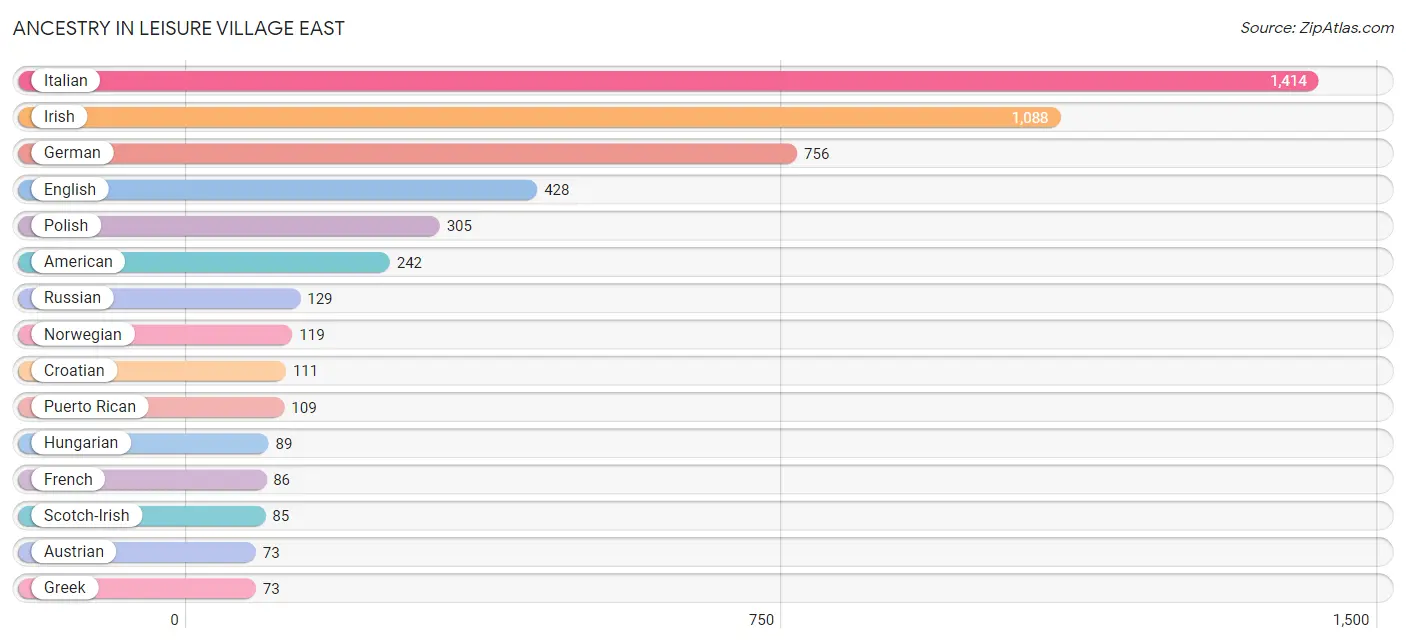
| Ancestry | # Population | % Population |
| African | 17 | 0.4% |
| American | 242 | 5.2% |
| Apache | 15 | 0.3% |
| Armenian | 16 | 0.3% |
| Austrian | 73 | 1.6% |
| Bhutanese | 28 | 0.6% |
| British | 15 | 0.3% |
| Central American | 21 | 0.4% |
| Croatian | 111 | 2.4% |
| Cuban | 13 | 0.3% |
| Danish | 14 | 0.3% |
| Dutch | 51 | 1.1% |
| Eastern European | 15 | 0.3% |
| English | 428 | 9.2% |
| French | 86 | 1.8% |
| German | 756 | 16.3% |
| Greek | 73 | 1.6% |
| Honduran | 21 | 0.4% |
| Hungarian | 89 | 1.9% |
| Irish | 1,088 | 23.4% |
| Italian | 1,414 | 30.4% |
| Lithuanian | 15 | 0.3% |
| Mexican | 14 | 0.3% |
| Norwegian | 119 | 2.6% |
| Polish | 305 | 6.6% |
| Portuguese | 31 | 0.7% |
| Puerto Rican | 109 | 2.3% |
| Russian | 129 | 2.8% |
| Scotch-Irish | 85 | 1.8% |
| Slovak | 19 | 0.4% |
| Subsaharan African | 17 | 0.4% |
| Swedish | 21 | 0.4% |
| Swiss | 16 | 0.3% |
| Trinidadian and Tobagonian | 39 | 0.8% | View All 34 Rows |
Immigrants in Leisure Village East
The most numerous immigrant groups reported in Leisure Village East came from Europe (186 | 4.0%), Eastern Europe (71 | 1.5%), Latin America (52 | 1.1%), Southern Europe (50 | 1.1%), and Croatia (49 | 1.1%), together accounting for 8.8% of all Leisure Village East residents.
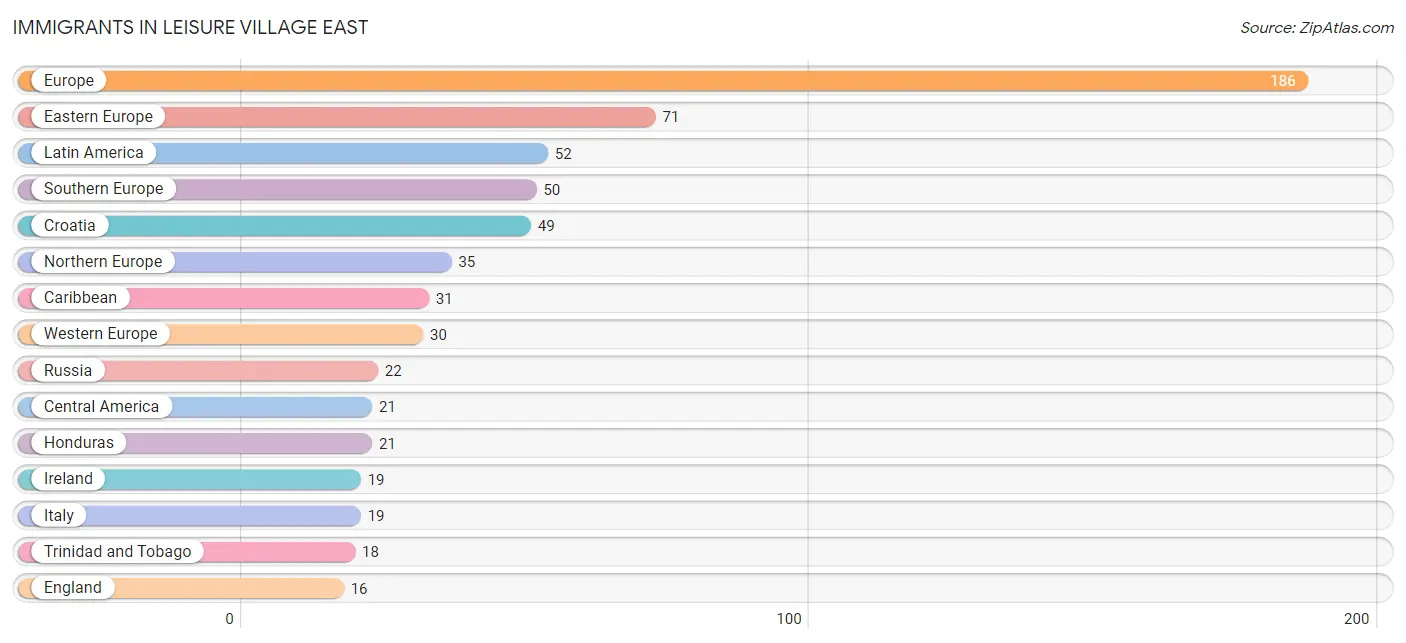
| Immigration Origin | # Population | % Population |
| Canada | 13 | 0.3% |
| Caribbean | 31 | 0.7% |
| Central America | 21 | 0.4% |
| Croatia | 49 | 1.1% |
| Cuba | 13 | 0.3% |
| Eastern Europe | 71 | 1.5% |
| England | 16 | 0.3% |
| Europe | 186 | 4.0% |
| Germany | 14 | 0.3% |
| Greece | 15 | 0.3% |
| Honduras | 21 | 0.4% |
| Ireland | 19 | 0.4% |
| Italy | 19 | 0.4% |
| Latin America | 52 | 1.1% |
| Northern Europe | 35 | 0.7% |
| Portugal | 16 | 0.3% |
| Russia | 22 | 0.5% |
| Southern Europe | 50 | 1.1% |
| Switzerland | 16 | 0.3% |
| Trinidad and Tobago | 18 | 0.4% |
| Western Europe | 30 | 0.6% | View All 21 Rows |
Sex and Age in Leisure Village East
Sex and Age in Leisure Village East
The most populous age groups in Leisure Village East are 85 Years and over (434 | 22.6%) for men and 80 to 84 Years (589 | 21.6%) for women.
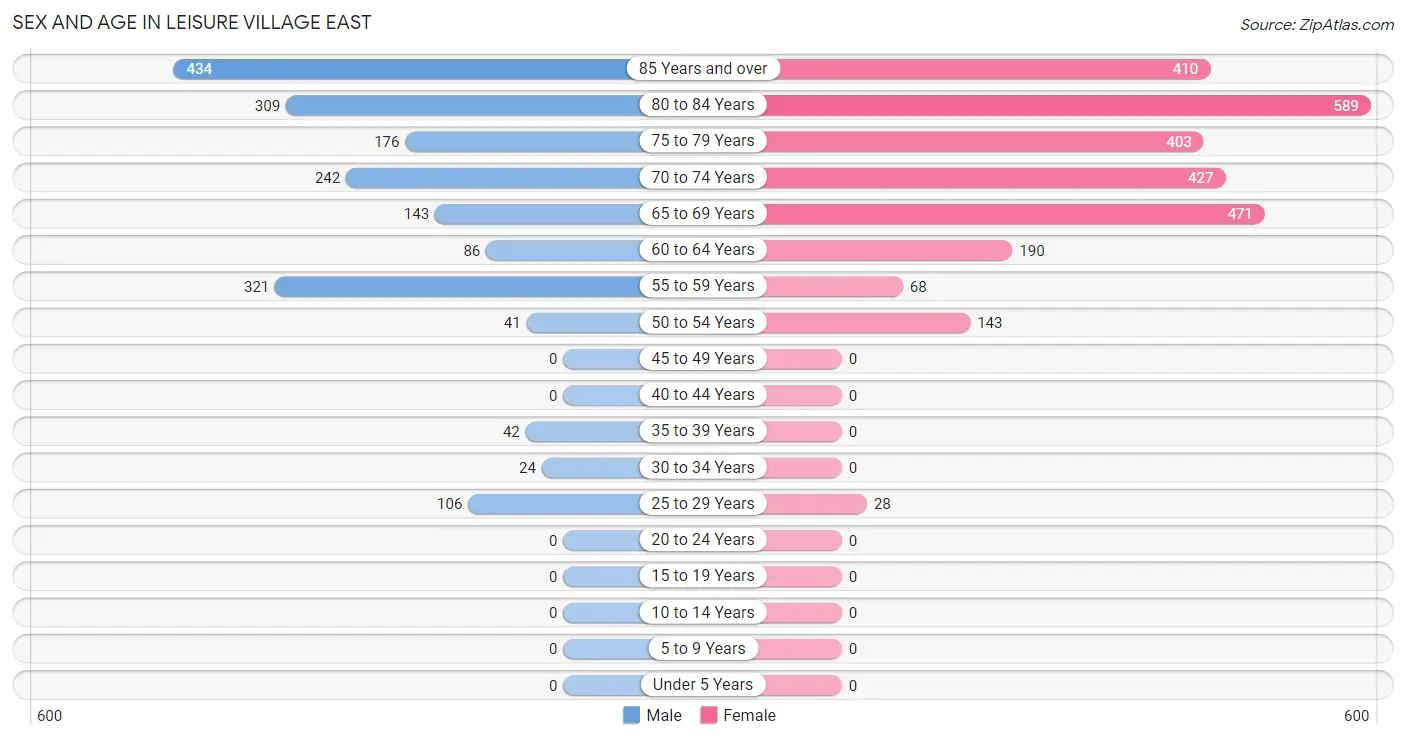
| Age Bracket | Male | Female |
| Under 5 Years | 0 (0.0%) | 0 (0.0%) |
| 5 to 9 Years | 0 (0.0%) | 0 (0.0%) |
| 10 to 14 Years | 0 (0.0%) | 0 (0.0%) |
| 15 to 19 Years | 0 (0.0%) | 0 (0.0%) |
| 20 to 24 Years | 0 (0.0%) | 0 (0.0%) |
| 25 to 29 Years | 106 (5.5%) | 28 (1.0%) |
| 30 to 34 Years | 24 (1.3%) | 0 (0.0%) |
| 35 to 39 Years | 42 (2.2%) | 0 (0.0%) |
| 40 to 44 Years | 0 (0.0%) | 0 (0.0%) |
| 45 to 49 Years | 0 (0.0%) | 0 (0.0%) |
| 50 to 54 Years | 41 (2.1%) | 143 (5.2%) |
| 55 to 59 Years | 321 (16.7%) | 68 (2.5%) |
| 60 to 64 Years | 86 (4.5%) | 190 (7.0%) |
| 65 to 69 Years | 143 (7.4%) | 471 (17.3%) |
| 70 to 74 Years | 242 (12.6%) | 427 (15.7%) |
| 75 to 79 Years | 176 (9.1%) | 403 (14.8%) |
| 80 to 84 Years | 309 (16.1%) | 589 (21.6%) |
| 85 Years and over | 434 (22.6%) | 410 (15.0%) |
| Total | 1,924 (100.0%) | 2,729 (100.0%) |
Families and Households in Leisure Village East
Median Family Size in Leisure Village East
The median family size in Leisure Village East is 2.08 persons per family, with single male/father families (100 | 7.3%) accounting for the largest median family size of 2.36 persons per family. On the other hand, married-couple families (1,055 | 77.4%) represent the smallest median family size with 2.00 persons per family.
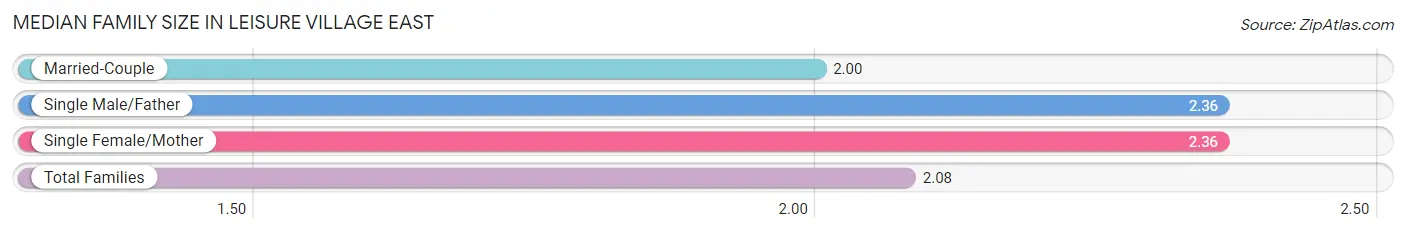
| Family Type | # Families | Family Size |
| Married-Couple | 1,055 (77.4%) | 2.00 |
| Single Male/Father | 100 (7.3%) | 2.36 |
| Single Female/Mother | 208 (15.3%) | 2.36 |
| Total Families | 1,363 (100.0%) | 2.08 |
Median Household Size in Leisure Village East
The median household size in Leisure Village East is 1.53 persons per household, with single male/father households (100 | 3.3%) accounting for the largest median household size of 2.36 persons per household. non-family households (1,683 | 55.2%) represent the smallest median household size with 1.08 persons per household.
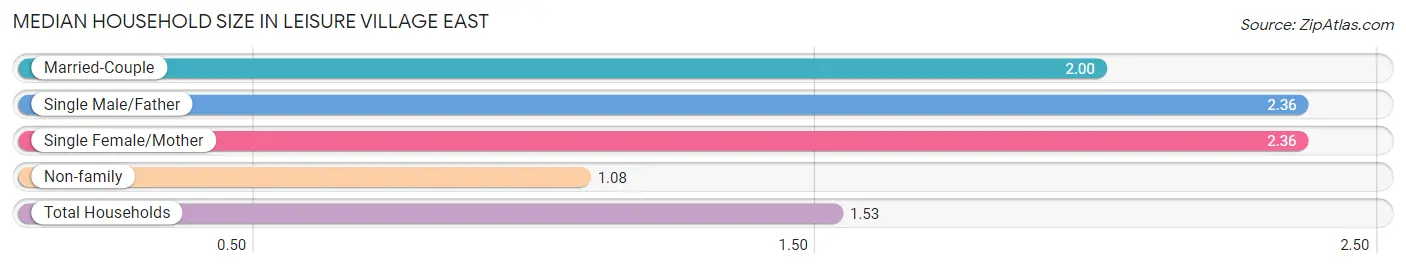
| Household Type | # Households | Household Size |
| Married-Couple | 1,055 (34.6%) | 2.00 |
| Single Male/Father | 100 (3.3%) | 2.36 |
| Single Female/Mother | 208 (6.8%) | 2.36 |
| Non-family | 1,683 (55.2%) | 1.08 |
| Total Households | 3,046 (100.0%) | 1.53 |
Household Size by Marriage Status in Leisure Village East
Out of a total of 3,046 households in Leisure Village East, 1,363 (44.8%) are family households, while 1,683 (55.2%) are nonfamily households. The most numerous type of family households are 2-person households, comprising 1,307, and the most common type of nonfamily households are 1-person households, comprising 1,564.
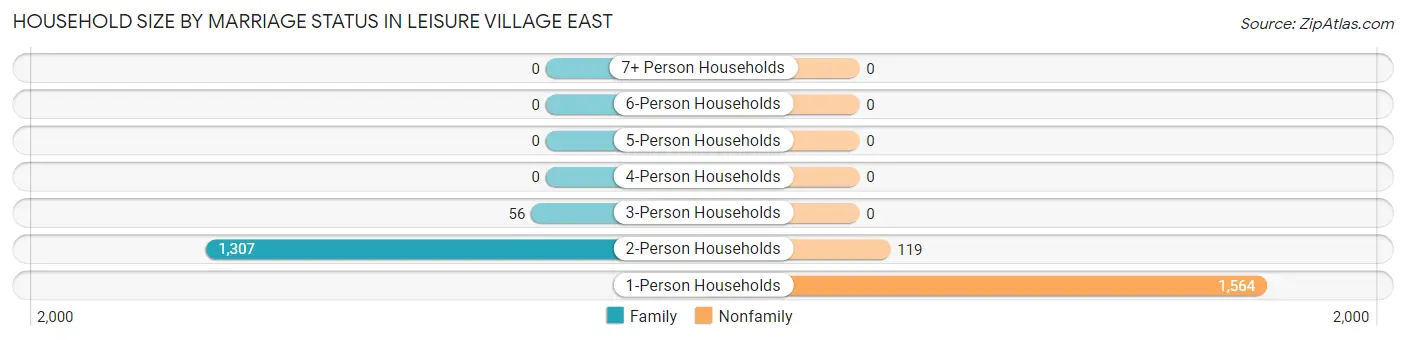
| Household Size | Family Households | Nonfamily Households |
| 1-Person Households | - | 1,564 (51.3%) |
| 2-Person Households | 1,307 (42.9%) | 119 (3.9%) |
| 3-Person Households | 56 (1.8%) | 0 (0.0%) |
| 4-Person Households | 0 (0.0%) | 0 (0.0%) |
| 5-Person Households | 0 (0.0%) | 0 (0.0%) |
| 6-Person Households | 0 (0.0%) | 0 (0.0%) |
| 7+ Person Households | 0 (0.0%) | 0 (0.0%) |
| Total | 1,363 (44.8%) | 1,683 (55.2%) |
Female Fertility in Leisure Village East
Fertility by Age in Leisure Village East
| Age Bracket | Women with Births | Births / 1,000 Women |
| 15 to 19 years | 0 (0.0%) | 0.0 |
| 20 to 34 years | 0 (0.0%) | 0.0 |
| 35 to 50 years | 0 (0.0%) | 0.0 |
| Total | 0 (0.0%) | 0.0 |
Fertility by Age by Marriage Status in Leisure Village East
| Age Bracket | Married | Unmarried |
| 15 to 19 years | 0 (0.0%) | 0 (0.0%) |
| 20 to 34 years | 0 (0.0%) | 0 (0.0%) |
| 35 to 50 years | 0 (0.0%) | 0 (0.0%) |
| Total | 0 (0.0%) | 0 (0.0%) |
Fertility by Education in Leisure Village East
| Educational Attainment | Women with Births | Births / 1,000 Women |
| Less than High School | 0 (0.0%) | 0.0 |
| High School Diploma | 0 (0.0%) | 0.0 |
| College or Associate's Degree | 0 (0.0%) | 0.0 |
| Bachelor's Degree | 0 (0.0%) | 0.0 |
| Graduate Degree | 0 (0.0%) | 0.0 |
| Total | 0 (0.0%) | 0.0 |
Fertility by Education by Marriage Status in Leisure Village East
| Educational Attainment | Married | Unmarried |
| Less than High School | 0 (0.0%) | 0 (0.0%) |
| High School Diploma | 0 (0.0%) | 0 (0.0%) |
| College or Associate's Degree | 0 (0.0%) | 0 (0.0%) |
| Bachelor's Degree | 0 (0.0%) | 0 (0.0%) |
| Graduate Degree | 0 (0.0%) | 0 (0.0%) |
| Total | 0 (0.0%) | 0 (0.0%) |
Employment Characteristics in Leisure Village East
Employment by Class of Employer in Leisure Village East
Among the 929 employed individuals in Leisure Village East, private company employees (821 | 88.4%), self-employed (not incorporated) (34 | 3.7%), and federal government employees (28 | 3.0%) make up the most common classes of employment.
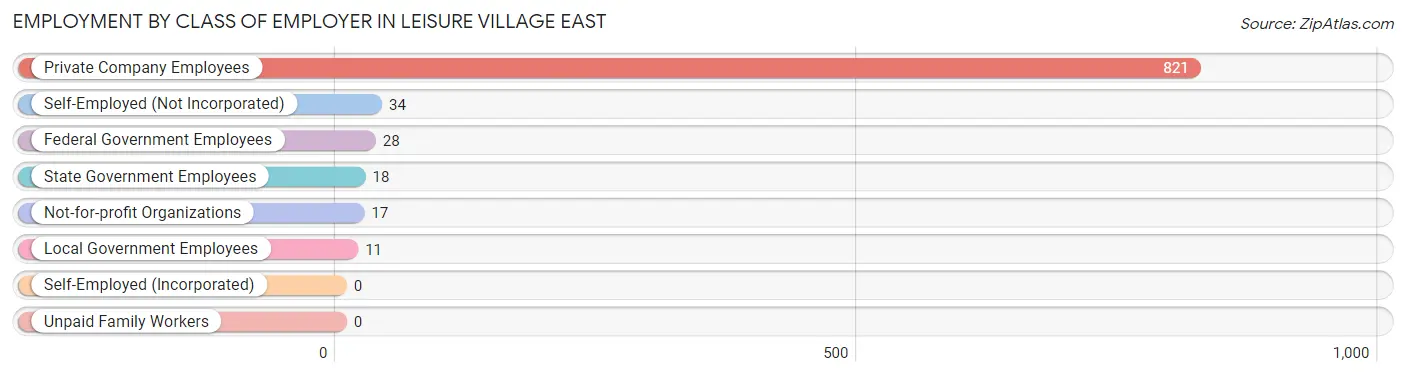
| Employer Class | # Employees | % Employees |
| Private Company Employees | 821 | 88.4% |
| Self-Employed (Incorporated) | 0 | 0.0% |
| Self-Employed (Not Incorporated) | 34 | 3.7% |
| Not-for-profit Organizations | 17 | 1.8% |
| Local Government Employees | 11 | 1.2% |
| State Government Employees | 18 | 1.9% |
| Federal Government Employees | 28 | 3.0% |
| Unpaid Family Workers | 0 | 0.0% |
| Total | 929 | 100.0% |
Employment Status by Age in Leisure Village East
According to the labor force statistics for Leisure Village East, out of the total population over 16 years of age (4,653), 24.1% or 1,121 individuals are in the labor force, with 17.2% or 193 of them unemployed. The age group with the highest labor force participation rate is 35 to 44 years, with 100.0% or 42 individuals in the labor force. Within the labor force, the 45 to 54 years age range has the highest percentage of unemployed individuals, with 75.4% or 126 of them being unemployed.
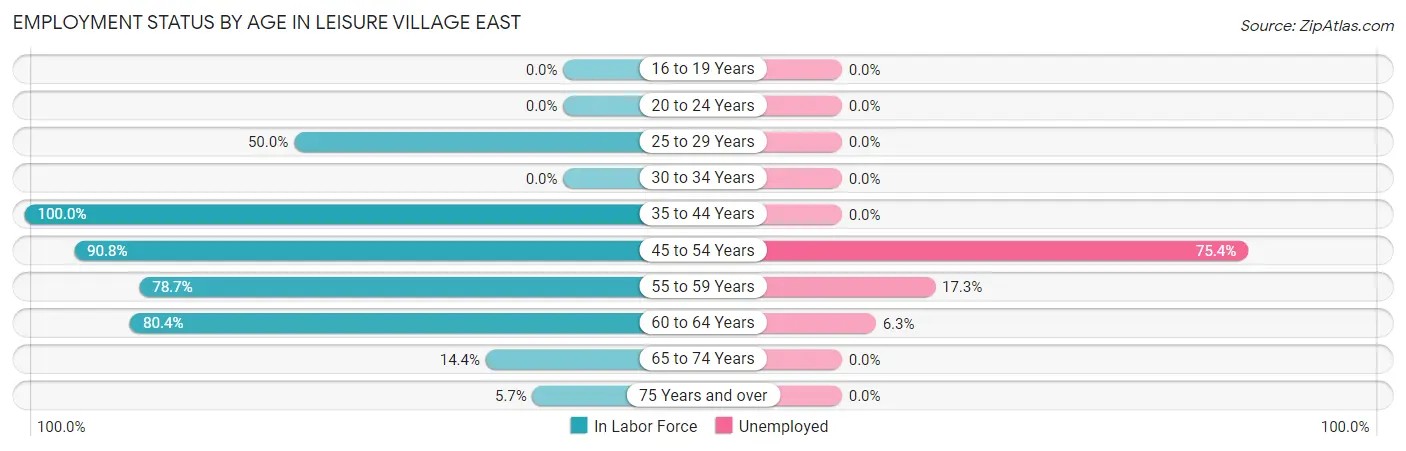
| Age Bracket | In Labor Force | Unemployed |
| 16 to 19 Years | 0 (0.0%) | 0 (0.0%) |
| 20 to 24 Years | 0 (0.0%) | 0 (0.0%) |
| 25 to 29 Years | 67 (50.0%) | 0 (0.0%) |
| 30 to 34 Years | 0 (0.0%) | 0 (0.0%) |
| 35 to 44 Years | 42 (100.0%) | 0 (0.0%) |
| 45 to 54 Years | 167 (90.8%) | 126 (75.4%) |
| 55 to 59 Years | 306 (78.7%) | 53 (17.3%) |
| 60 to 64 Years | 222 (80.4%) | 14 (6.3%) |
| 65 to 74 Years | 185 (14.4%) | 0 (0.0%) |
| 75 Years and over | 132 (5.7%) | 0 (0.0%) |
| Total | 1,121 (24.1%) | 193 (17.2%) |
Employment Status by Educational Attainment in Leisure Village East
According to labor force statistics for Leisure Village East, 76.6% of individuals (804) out of the total population between 25 and 64 years of age (1,049) are in the labor force, with 24.0% or 193 of them being unemployed. The group with the highest labor force participation rate are those with the educational attainment of high school diploma, with 83.1% or 575 individuals in the labor force. Within the labor force, individuals with high school diploma education have the highest percentage of unemployment, with 31.1% or 179 of them being unemployed.
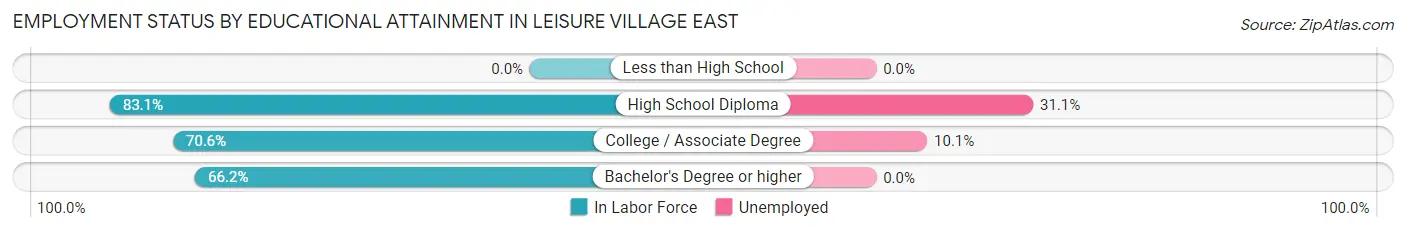
| Educational Attainment | In Labor Force | Unemployed |
| Less than High School | 0 (0.0%) | 0 (0.0%) |
| High School Diploma | 575 (83.1%) | 215 (31.1%) |
| College / Associate Degree | 139 (70.6%) | 20 (10.1%) |
| Bachelor's Degree or higher | 90 (66.2%) | 0 (0.0%) |
| Total | 804 (76.6%) | 252 (24.0%) |
Employment Occupations by Sex in Leisure Village East
Management, Business, Science and Arts Occupations
The most common Management, Business, Science and Arts occupations in Leisure Village East are Business & Financial (71 | 7.6%), Community & Social Service (36 | 3.9%), Management (30 | 3.2%), Education Instruction & Library (20 | 2.1%), and Legal Services & Support (16 | 1.7%).
Management, Business, Science and Arts Occupations by Sex
Within the Management, Business, Science and Arts occupations in Leisure Village East, the most male-oriented occupations are Community & Social Service (100.0%), Legal Services & Support (100.0%), and Education Instruction & Library (100.0%), while the most female-oriented occupations are Management (100.0%), and Business & Financial (45.1%).
| Occupation | Male | Female |
| Management | 0 (0.0%) | 30 (100.0%) |
| Business & Financial | 39 (54.9%) | 32 (45.1%) |
| Computers, Engineering & Science | 0 (0.0%) | 0 (0.0%) |
| Computers & Mathematics | 0 (0.0%) | 0 (0.0%) |
| Architecture & Engineering | 0 (0.0%) | 0 (0.0%) |
| Life, Physical & Social Science | 0 (0.0%) | 0 (0.0%) |
| Community & Social Service | 36 (100.0%) | 0 (0.0%) |
| Education, Arts & Media | 0 (0.0%) | 0 (0.0%) |
| Legal Services & Support | 16 (100.0%) | 0 (0.0%) |
| Education Instruction & Library | 20 (100.0%) | 0 (0.0%) |
| Arts, Media & Entertainment | 0 (0.0%) | 0 (0.0%) |
| Health Diagnosing & Treating | 0 (0.0%) | 0 (0.0%) |
| Health Technologists | 0 (0.0%) | 0 (0.0%) |
| Total (Category) | 75 (54.7%) | 62 (45.3%) |
| Total (Overall) | 520 (56.0%) | 409 (44.0%) |
Services Occupations
The most common Services occupations in Leisure Village East are Food Preparation & Serving (46 | 5.0%), Personal Care & Service (32 | 3.4%), Security & Protection (18 | 1.9%), Law Enforcement (18 | 1.9%), and Healthcare Support (16 | 1.7%).
Services Occupations by Sex
Within the Services occupations in Leisure Village East, the most male-oriented occupations are Security & Protection (100.0%), Law Enforcement (100.0%), and Personal Care & Service (100.0%), while the most female-oriented occupations are Healthcare Support (100.0%), Cleaning & Maintenance (100.0%), and Food Preparation & Serving (58.7%).
| Occupation | Male | Female |
| Healthcare Support | 0 (0.0%) | 16 (100.0%) |
| Security & Protection | 18 (100.0%) | 0 (0.0%) |
| Firefighting & Prevention | 0 (0.0%) | 0 (0.0%) |
| Law Enforcement | 18 (100.0%) | 0 (0.0%) |
| Food Preparation & Serving | 19 (41.3%) | 27 (58.7%) |
| Cleaning & Maintenance | 0 (0.0%) | 14 (100.0%) |
| Personal Care & Service | 32 (100.0%) | 0 (0.0%) |
| Total (Category) | 69 (54.8%) | 57 (45.2%) |
| Total (Overall) | 520 (56.0%) | 409 (44.0%) |
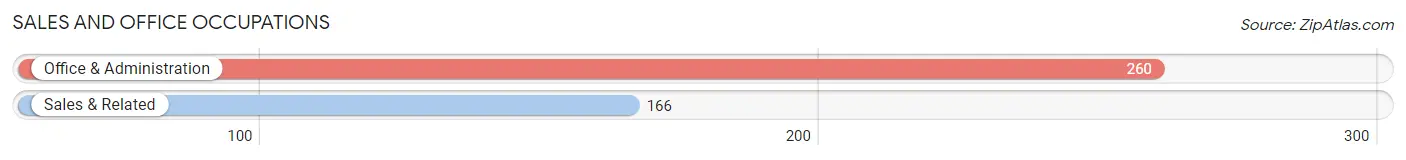
Sales and Office Occupations
The most common Sales and Office occupations in Leisure Village East are Office & Administration (260 | 28.0%), and Sales & Related (166 | 17.9%).
Sales and Office Occupations by Sex
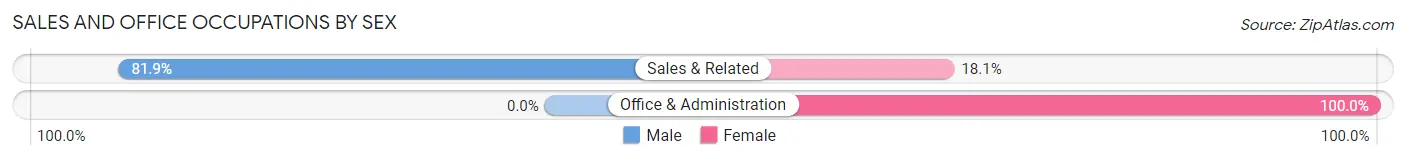
| Occupation | Male | Female |
| Sales & Related | 136 (81.9%) | 30 (18.1%) |
| Office & Administration | 0 (0.0%) | 260 (100.0%) |
| Total (Category) | 136 (31.9%) | 290 (68.1%) |
| Total (Overall) | 520 (56.0%) | 409 (44.0%) |
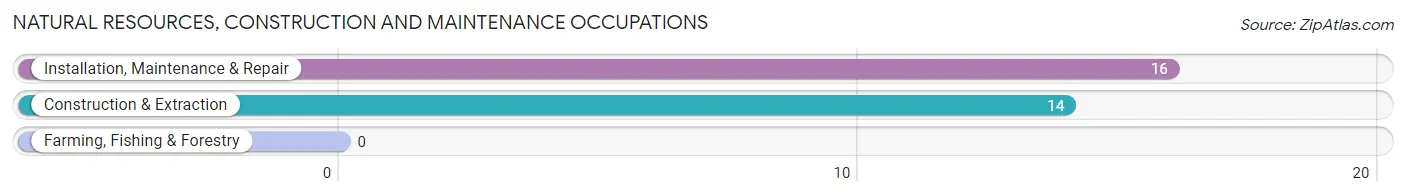
Natural Resources, Construction and Maintenance Occupations
The most common Natural Resources, Construction and Maintenance occupations in Leisure Village East are Installation, Maintenance & Repair (16 | 1.7%), and Construction & Extraction (14 | 1.5%).
Natural Resources, Construction and Maintenance Occupations by Sex
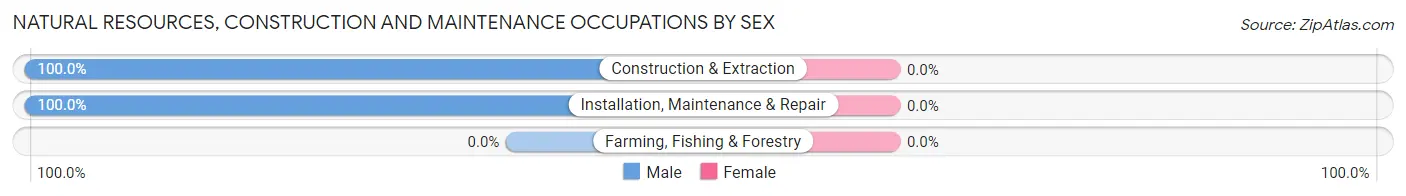
| Occupation | Male | Female |
| Farming, Fishing & Forestry | 0 (0.0%) | 0 (0.0%) |
| Construction & Extraction | 14 (100.0%) | 0 (0.0%) |
| Installation, Maintenance & Repair | 16 (100.0%) | 0 (0.0%) |
| Total (Category) | 30 (100.0%) | 0 (0.0%) |
| Total (Overall) | 520 (56.0%) | 409 (44.0%) |
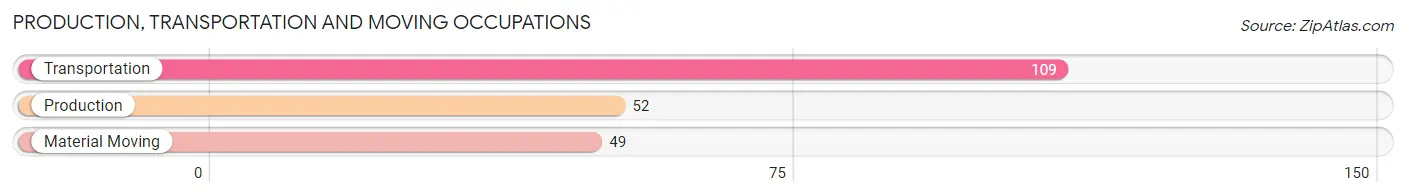
Production, Transportation and Moving Occupations
The most common Production, Transportation and Moving occupations in Leisure Village East are Transportation (109 | 11.7%), Production (52 | 5.6%), and Material Moving (49 | 5.3%).
Production, Transportation and Moving Occupations by Sex
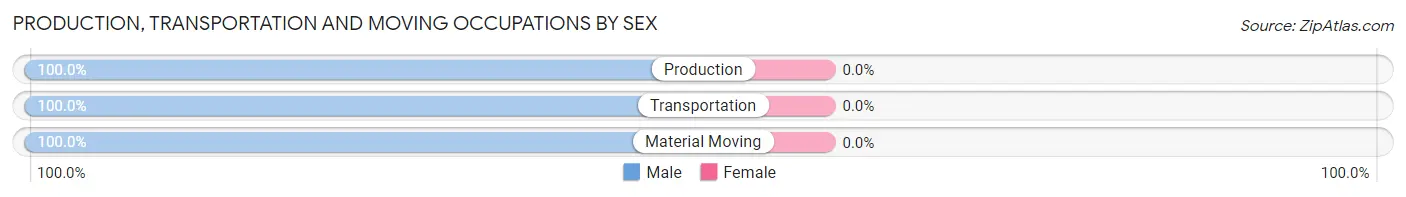
| Occupation | Male | Female |
| Production | 52 (100.0%) | 0 (0.0%) |
| Transportation | 109 (100.0%) | 0 (0.0%) |
| Material Moving | 49 (100.0%) | 0 (0.0%) |
| Total (Category) | 210 (100.0%) | 0 (0.0%) |
| Total (Overall) | 520 (56.0%) | 409 (44.0%) |
Employment Industries by Sex in Leisure Village East
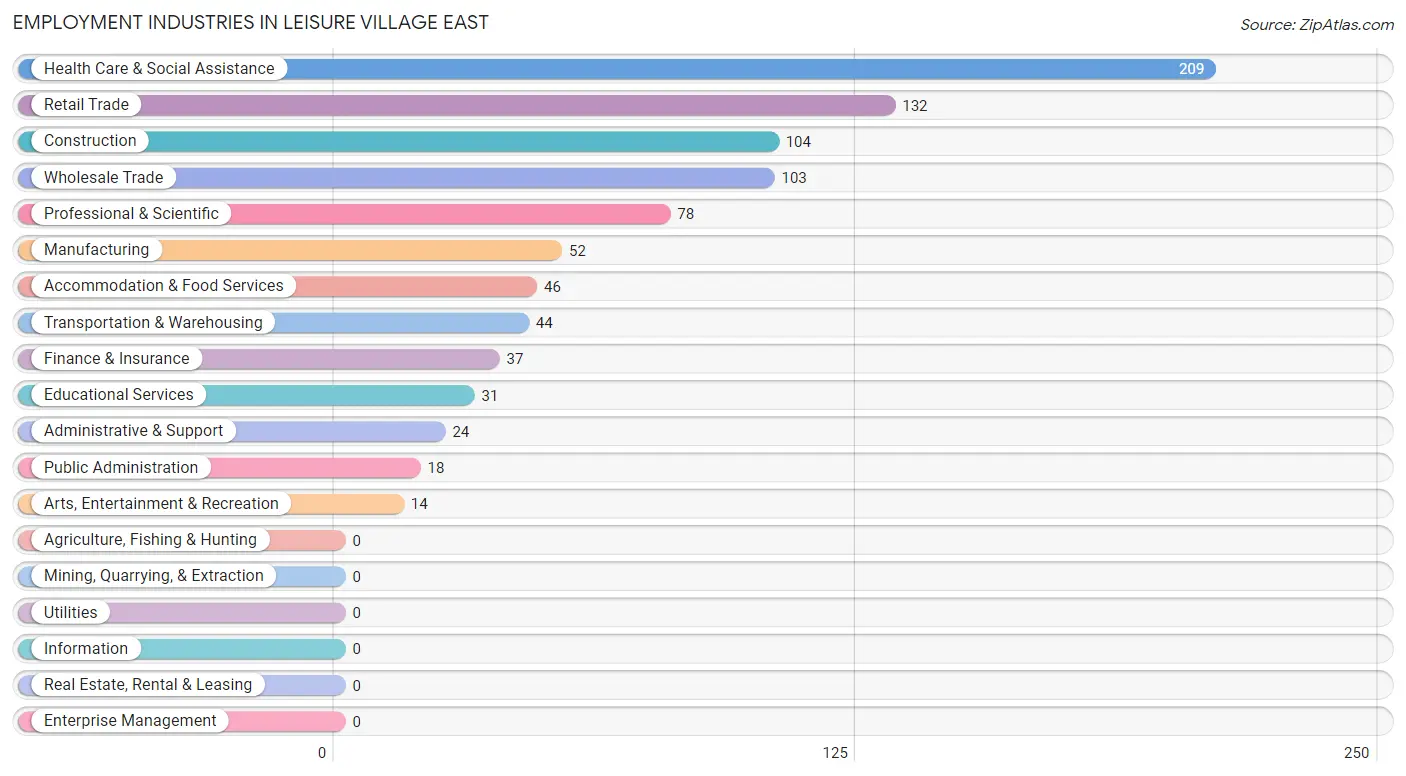
Employment Industries in Leisure Village East
The major employment industries in Leisure Village East include Health Care & Social Assistance (209 | 22.5%), Retail Trade (132 | 14.2%), Construction (104 | 11.2%), Wholesale Trade (103 | 11.1%), and Professional & Scientific (78 | 8.4%).
Employment Industries by Sex in Leisure Village East
The Leisure Village East industries that see more men than women are Construction (100.0%), Manufacturing (100.0%), and Educational Services (100.0%), whereas the industries that tend to have a higher number of women are Transportation & Warehousing (100.0%), Administrative & Support (100.0%), and Arts, Entertainment & Recreation (100.0%).
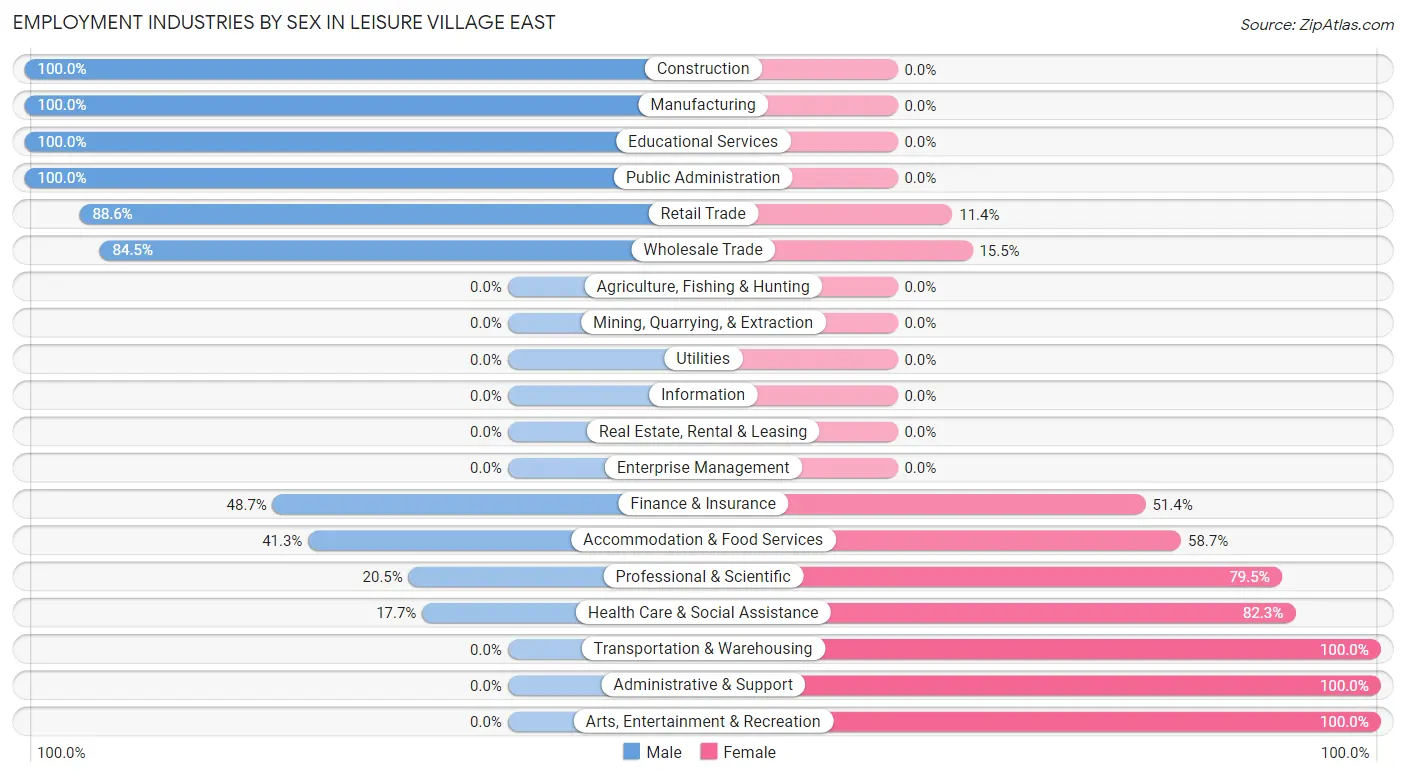
| Industry | Male | Female |
| Agriculture, Fishing & Hunting | 0 (0.0%) | 0 (0.0%) |
| Mining, Quarrying, & Extraction | 0 (0.0%) | 0 (0.0%) |
| Construction | 104 (100.0%) | 0 (0.0%) |
| Manufacturing | 52 (100.0%) | 0 (0.0%) |
| Wholesale Trade | 87 (84.5%) | 16 (15.5%) |
| Retail Trade | 117 (88.6%) | 15 (11.4%) |
| Transportation & Warehousing | 0 (0.0%) | 44 (100.0%) |
| Utilities | 0 (0.0%) | 0 (0.0%) |
| Information | 0 (0.0%) | 0 (0.0%) |
| Finance & Insurance | 18 (48.6%) | 19 (51.3%) |
| Real Estate, Rental & Leasing | 0 (0.0%) | 0 (0.0%) |
| Professional & Scientific | 16 (20.5%) | 62 (79.5%) |
| Enterprise Management | 0 (0.0%) | 0 (0.0%) |
| Administrative & Support | 0 (0.0%) | 24 (100.0%) |
| Educational Services | 31 (100.0%) | 0 (0.0%) |
| Health Care & Social Assistance | 37 (17.7%) | 172 (82.3%) |
| Arts, Entertainment & Recreation | 0 (0.0%) | 14 (100.0%) |
| Accommodation & Food Services | 19 (41.3%) | 27 (58.7%) |
| Public Administration | 18 (100.0%) | 0 (0.0%) |
| Total | 520 (56.0%) | 409 (44.0%) |
Education in Leisure Village East
School Enrollment in Leisure Village East
The most common levels of schooling among the 84 students in Leisure Village East are graduate / professional (39 | 46.4%), college / undergraduate (28 | 33.3%), and high school (17 | 20.2%).
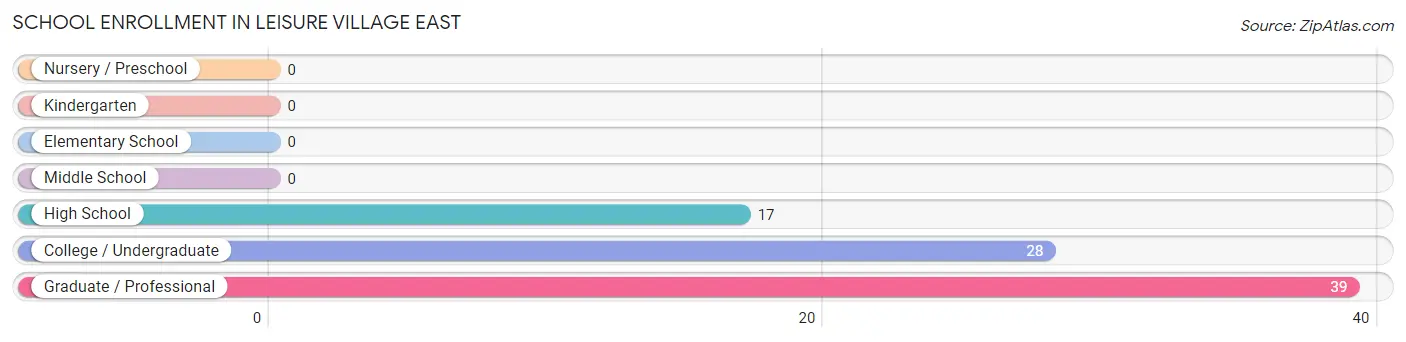
| School Level | # Students | % Students |
| Nursery / Preschool | 0 | 0.0% |
| Kindergarten | 0 | 0.0% |
| Elementary School | 0 | 0.0% |
| Middle School | 0 | 0.0% |
| High School | 17 | 20.2% |
| College / Undergraduate | 28 | 33.3% |
| Graduate / Professional | 39 | 46.4% |
| Total | 84 | 100.0% |
School Enrollment by Age by Funding Source in Leisure Village East
Out of a total of 84 students who are enrolled in schools in Leisure Village East, 19 (22.6%) attend a private institution, while the remaining 65 (77.4%) are enrolled in public schools. The age group of 35 years and over has the highest likelihood of being enrolled in private schools, with 19 (29.7% in the age bracket) enrolled. Conversely, the age group of 25 to 34 year olds has the lowest likelihood of being enrolled in a private school, with 20 (100.0% in the age bracket) attending a public institution.
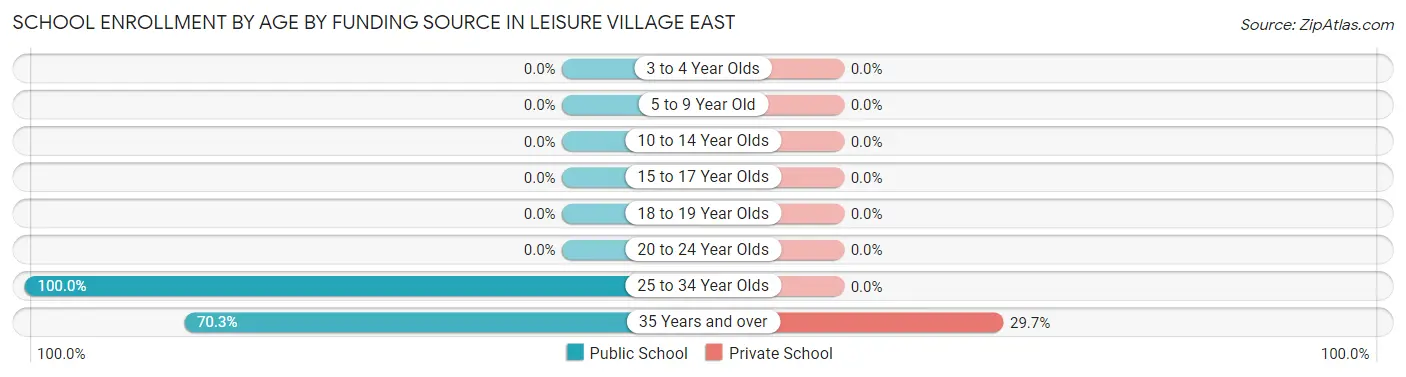
| Age Bracket | Public School | Private School |
| 3 to 4 Year Olds | 0 (0.0%) | 0 (0.0%) |
| 5 to 9 Year Old | 0 (0.0%) | 0 (0.0%) |
| 10 to 14 Year Olds | 0 (0.0%) | 0 (0.0%) |
| 15 to 17 Year Olds | 0 (0.0%) | 0 (0.0%) |
| 18 to 19 Year Olds | 0 (0.0%) | 0 (0.0%) |
| 20 to 24 Year Olds | 0 (0.0%) | 0 (0.0%) |
| 25 to 34 Year Olds | 20 (100.0%) | 0 (0.0%) |
| 35 Years and over | 45 (70.3%) | 19 (29.7%) |
| Total | 65 (77.4%) | 19 (22.6%) |
Educational Attainment by Field of Study in Leisure Village East
Education (268 | 23.7%), arts & humanities (152 | 13.4%), business (150 | 13.3%), liberal arts & history (125 | 11.1%), and social sciences (104 | 9.2%) are the most common fields of study among 1,131 individuals in Leisure Village East who have obtained a bachelor's degree or higher.
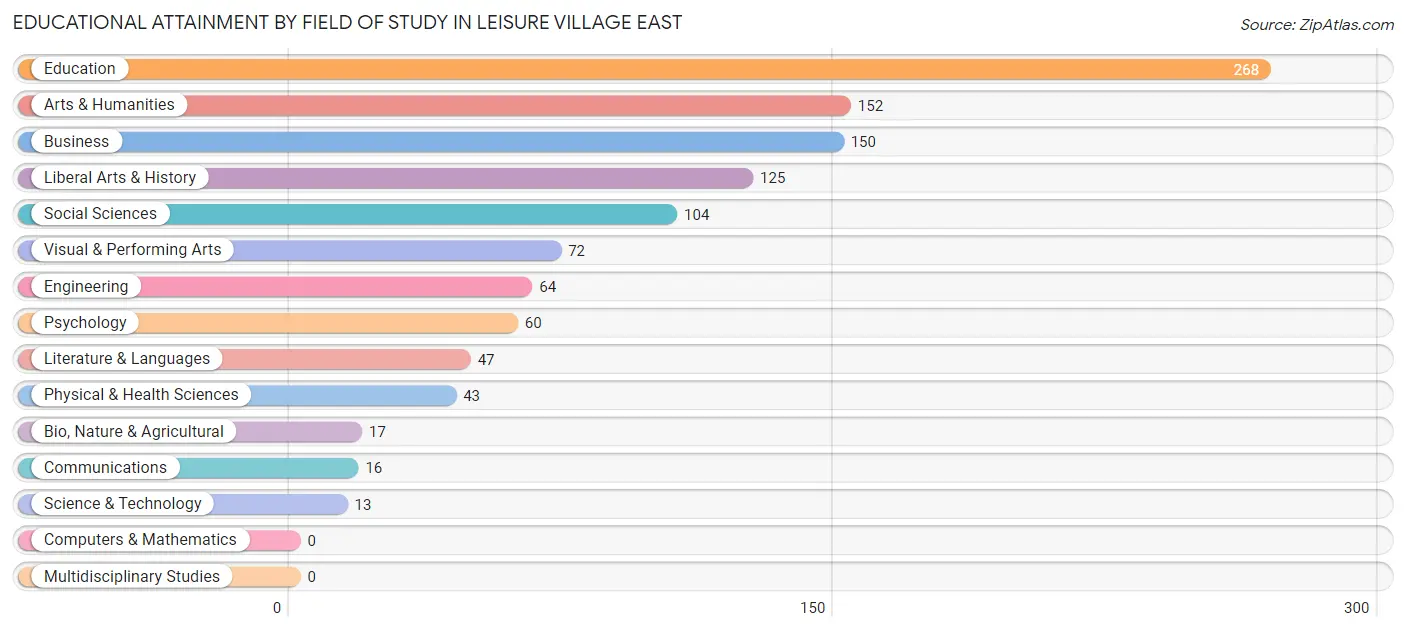
| Field of Study | # Graduates | % Graduates |
| Computers & Mathematics | 0 | 0.0% |
| Bio, Nature & Agricultural | 17 | 1.5% |
| Physical & Health Sciences | 43 | 3.8% |
| Psychology | 60 | 5.3% |
| Social Sciences | 104 | 9.2% |
| Engineering | 64 | 5.7% |
| Multidisciplinary Studies | 0 | 0.0% |
| Science & Technology | 13 | 1.1% |
| Business | 150 | 13.3% |
| Education | 268 | 23.7% |
| Literature & Languages | 47 | 4.2% |
| Liberal Arts & History | 125 | 11.1% |
| Visual & Performing Arts | 72 | 6.4% |
| Communications | 16 | 1.4% |
| Arts & Humanities | 152 | 13.4% |
| Total | 1,131 | 100.0% |
Transportation & Commute in Leisure Village East
Vehicle Availability by Sex in Leisure Village East
The most prevalent vehicle ownership categories in Leisure Village East are males with 1 vehicle (321, accounting for 61.7%) and females with 1 vehicle (233, making up 78.5%).
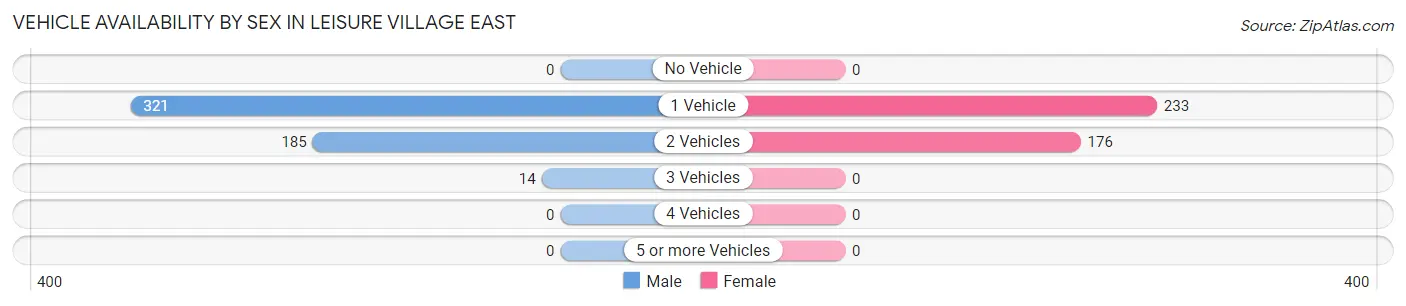
| Vehicles Available | Male | Female |
| No Vehicle | 0 (0.0%) | 0 (0.0%) |
| 1 Vehicle | 321 (61.7%) | 233 (57.0%) |
| 2 Vehicles | 185 (35.6%) | 176 (43.0%) |
| 3 Vehicles | 14 (2.7%) | 0 (0.0%) |
| 4 Vehicles | 0 (0.0%) | 0 (0.0%) |
| 5 or more Vehicles | 0 (0.0%) | 0 (0.0%) |
| Total | 520 (100.0%) | 409 (100.0%) |
Commute Time in Leisure Village East
The most frequently occuring commute durations in Leisure Village East are 30 to 34 minutes (209 commuters, 22.8%), 10 to 14 minutes (130 commuters, 14.2%), and 40 to 44 minutes (109 commuters, 11.9%).
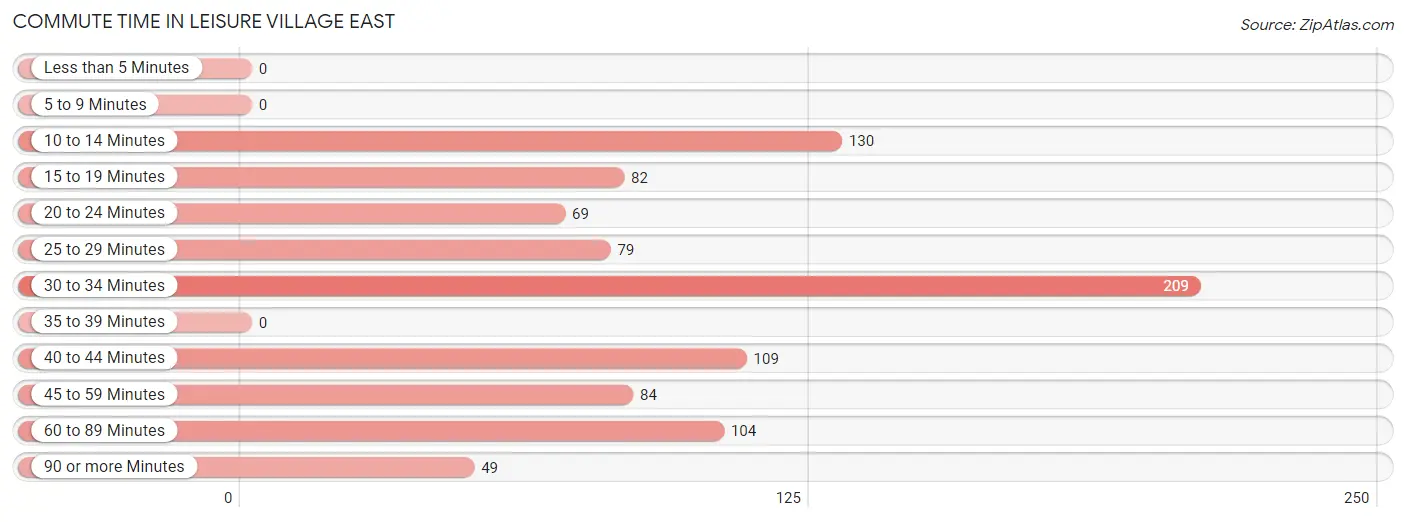
| Commute Time | # Commuters | % Commuters |
| Less than 5 Minutes | 0 | 0.0% |
| 5 to 9 Minutes | 0 | 0.0% |
| 10 to 14 Minutes | 130 | 14.2% |
| 15 to 19 Minutes | 82 | 9.0% |
| 20 to 24 Minutes | 69 | 7.5% |
| 25 to 29 Minutes | 79 | 8.6% |
| 30 to 34 Minutes | 209 | 22.8% |
| 35 to 39 Minutes | 0 | 0.0% |
| 40 to 44 Minutes | 109 | 11.9% |
| 45 to 59 Minutes | 84 | 9.2% |
| 60 to 89 Minutes | 104 | 11.4% |
| 90 or more Minutes | 49 | 5.4% |
Commute Time by Sex in Leisure Village East
The most common commute times in Leisure Village East are 30 to 34 minutes (112 commuters, 22.1%) for males and 30 to 34 minutes (97 commuters, 23.7%) for females.
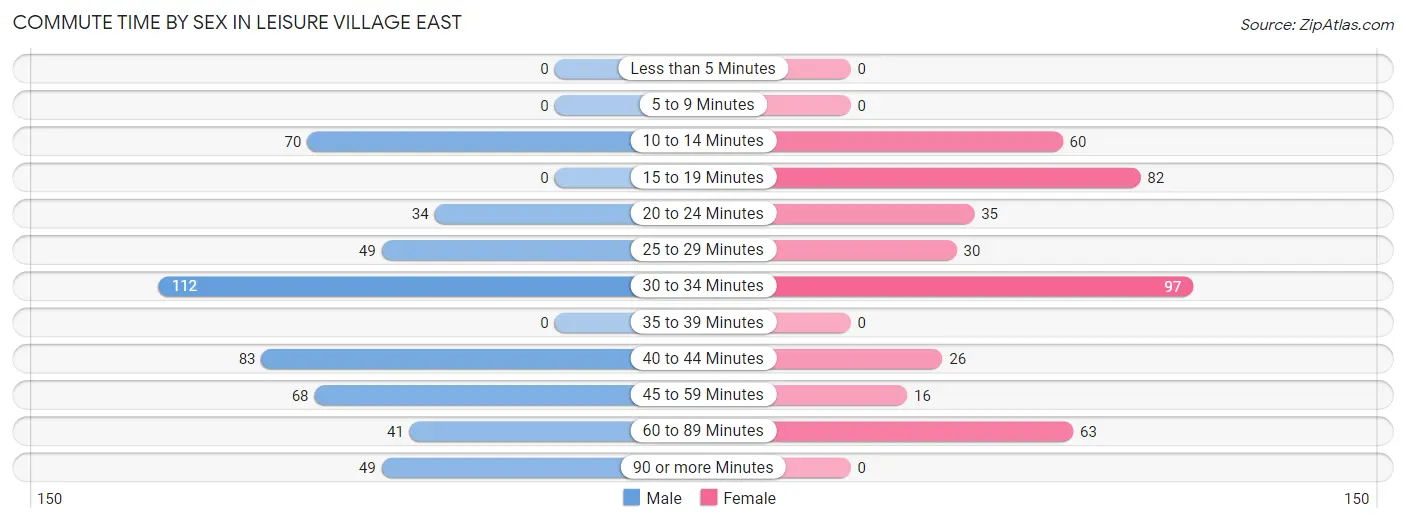
| Commute Time | Male | Female |
| Less than 5 Minutes | 0 (0.0%) | 0 (0.0%) |
| 5 to 9 Minutes | 0 (0.0%) | 0 (0.0%) |
| 10 to 14 Minutes | 70 (13.8%) | 60 (14.7%) |
| 15 to 19 Minutes | 0 (0.0%) | 82 (20.1%) |
| 20 to 24 Minutes | 34 (6.7%) | 35 (8.6%) |
| 25 to 29 Minutes | 49 (9.7%) | 30 (7.3%) |
| 30 to 34 Minutes | 112 (22.1%) | 97 (23.7%) |
| 35 to 39 Minutes | 0 (0.0%) | 0 (0.0%) |
| 40 to 44 Minutes | 83 (16.4%) | 26 (6.4%) |
| 45 to 59 Minutes | 68 (13.4%) | 16 (3.9%) |
| 60 to 89 Minutes | 41 (8.1%) | 63 (15.4%) |
| 90 or more Minutes | 49 (9.7%) | 0 (0.0%) |
Time of Departure to Work by Sex in Leisure Village East
The most frequent times of departure to work in Leisure Village East are 9:00 AM to 9:59 AM (104, 20.5%) for males and 7:00 AM to 7:29 AM (123, 30.1%) for females.
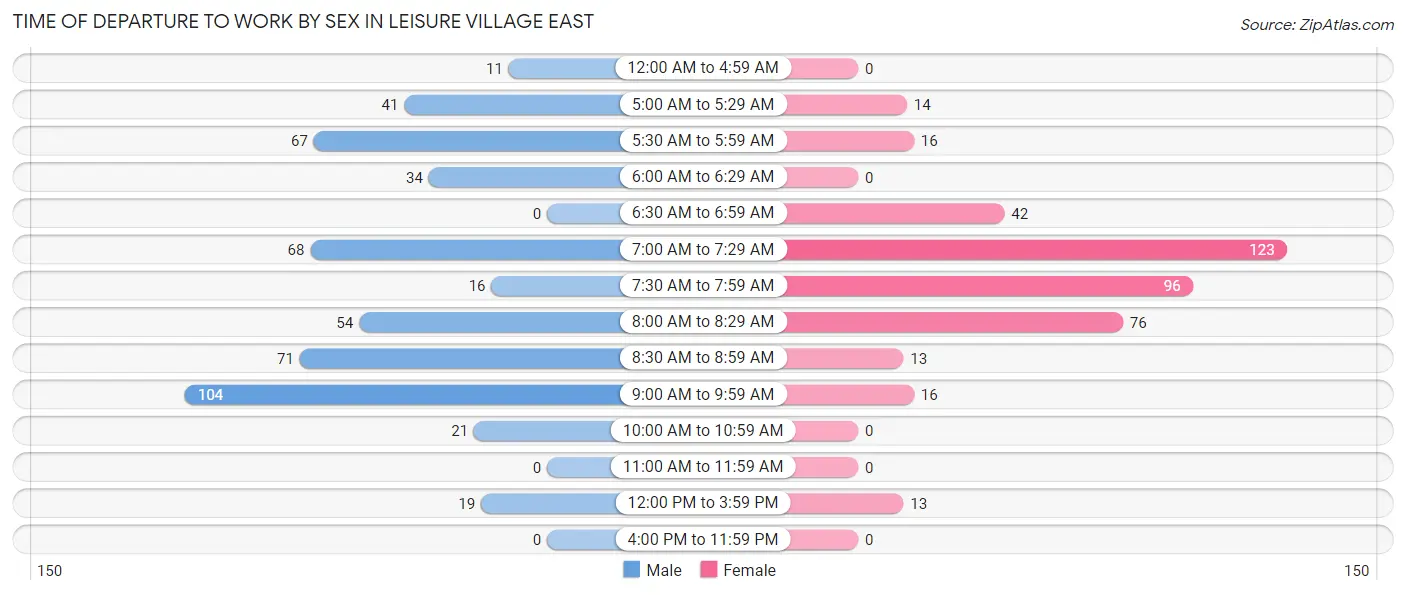
| Time of Departure | Male | Female |
| 12:00 AM to 4:59 AM | 11 (2.2%) | 0 (0.0%) |
| 5:00 AM to 5:29 AM | 41 (8.1%) | 14 (3.4%) |
| 5:30 AM to 5:59 AM | 67 (13.2%) | 16 (3.9%) |
| 6:00 AM to 6:29 AM | 34 (6.7%) | 0 (0.0%) |
| 6:30 AM to 6:59 AM | 0 (0.0%) | 42 (10.3%) |
| 7:00 AM to 7:29 AM | 68 (13.4%) | 123 (30.1%) |
| 7:30 AM to 7:59 AM | 16 (3.2%) | 96 (23.5%) |
| 8:00 AM to 8:29 AM | 54 (10.7%) | 76 (18.6%) |
| 8:30 AM to 8:59 AM | 71 (14.0%) | 13 (3.2%) |
| 9:00 AM to 9:59 AM | 104 (20.5%) | 16 (3.9%) |
| 10:00 AM to 10:59 AM | 21 (4.2%) | 0 (0.0%) |
| 11:00 AM to 11:59 AM | 0 (0.0%) | 0 (0.0%) |
| 12:00 PM to 3:59 PM | 19 (3.7%) | 13 (3.2%) |
| 4:00 PM to 11:59 PM | 0 (0.0%) | 0 (0.0%) |
| Total | 506 (100.0%) | 409 (100.0%) |
Housing Occupancy in Leisure Village East
Occupancy by Ownership in Leisure Village East
Of the total 3,046 dwellings in Leisure Village East, owner-occupied units account for 2,612 (85.8%), while renter-occupied units make up 434 (14.2%).
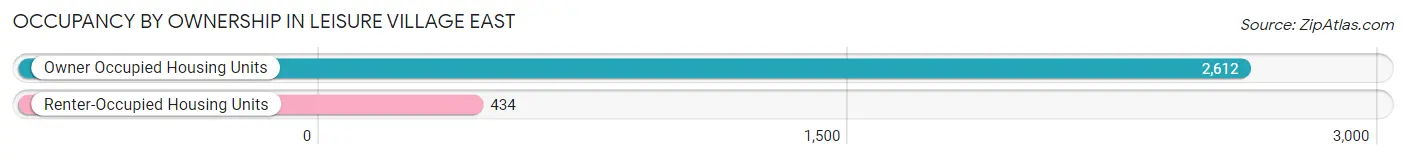
| Occupancy | # Housing Units | % Housing Units |
| Owner Occupied Housing Units | 2,612 | 85.8% |
| Renter-Occupied Housing Units | 434 | 14.2% |
| Total Occupied Housing Units | 3,046 | 100.0% |
Occupancy by Household Size in Leisure Village East
| Household Size | # Housing Units | % Housing Units |
| 1-Person Household | 1,564 | 51.3% |
| 2-Person Household | 1,426 | 46.8% |
| 3-Person Household | 56 | 1.8% |
| 4+ Person Household | 0 | 0.0% |
| Total Housing Units | 3,046 | 100.0% |
Occupancy by Ownership by Household Size in Leisure Village East
| Household Size | Owner-occupied | Renter-occupied |
| 1-Person Household | 1,387 (88.7%) | 177 (11.3%) |
| 2-Person Household | 1,169 (82.0%) | 257 (18.0%) |
| 3-Person Household | 56 (100.0%) | 0 (0.0%) |
| 4+ Person Household | 0 (0.0%) | 0 (0.0%) |
| Total Housing Units | 2,612 (85.8%) | 434 (14.2%) |
Occupancy by Educational Attainment in Leisure Village East
| Household Size | Owner-occupied | Renter-occupied |
| Less than High School | 201 (56.9%) | 152 (43.1%) |
| High School Diploma | 1,296 (89.2%) | 157 (10.8%) |
| College/Associate Degree | 561 (89.9%) | 63 (10.1%) |
| Bachelor's Degree or higher | 554 (89.9%) | 62 (10.1%) |
Occupancy by Age of Householder in Leisure Village East
| Age Bracket | # Households | % Households |
| Under 35 Years | 0 | 0.0% |
| 35 to 44 Years | 0 | 0.0% |
| 45 to 54 Years | 58 | 1.9% |
| 55 to 64 Years | 416 | 13.7% |
| 65 to 74 Years | 929 | 30.5% |
| 75 to 84 Years | 1,053 | 34.6% |
| 85 Years and Over | 590 | 19.4% |
| Total | 3,046 | 100.0% |
Housing Finances in Leisure Village East
Median Income by Occupancy in Leisure Village East

| Occupancy Type | # Households | Median Income |
| Owner-Occupied | 2,612 (85.8%) | $46,369 |
| Renter-Occupied | 434 (14.2%) | $34,274 |
| Average | 3,046 (100.0%) | $45,395 |
Occupancy by Householder Income Bracket in Leisure Village East
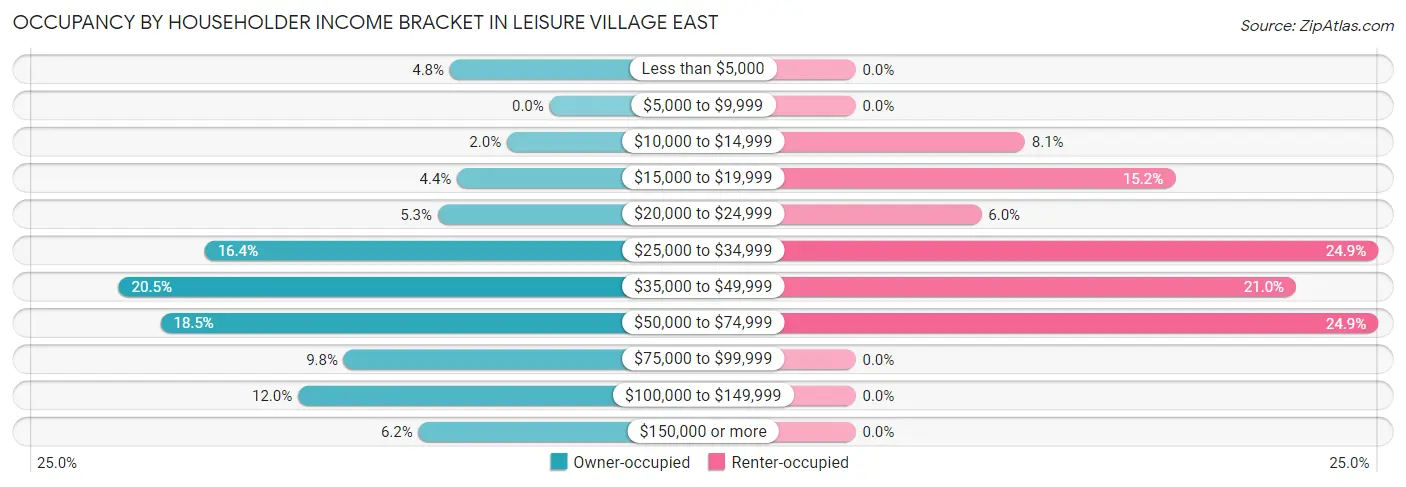
| Income Bracket | Owner-occupied | Renter-occupied |
| Less than $5,000 | 124 (4.8%) | 0 (0.0%) |
| $5,000 to $9,999 | 0 (0.0%) | 0 (0.0%) |
| $10,000 to $14,999 | 53 (2.0%) | 35 (8.1%) |
| $15,000 to $19,999 | 115 (4.4%) | 66 (15.2%) |
| $20,000 to $24,999 | 139 (5.3%) | 26 (6.0%) |
| $25,000 to $34,999 | 429 (16.4%) | 108 (24.9%) |
| $35,000 to $49,999 | 536 (20.5%) | 91 (21.0%) |
| $50,000 to $74,999 | 484 (18.5%) | 108 (24.9%) |
| $75,000 to $99,999 | 256 (9.8%) | 0 (0.0%) |
| $100,000 to $149,999 | 313 (12.0%) | 0 (0.0%) |
| $150,000 or more | 163 (6.2%) | 0 (0.0%) |
| Total | 2,612 (100.0%) | 434 (100.0%) |
Monthly Housing Cost Tiers in Leisure Village East
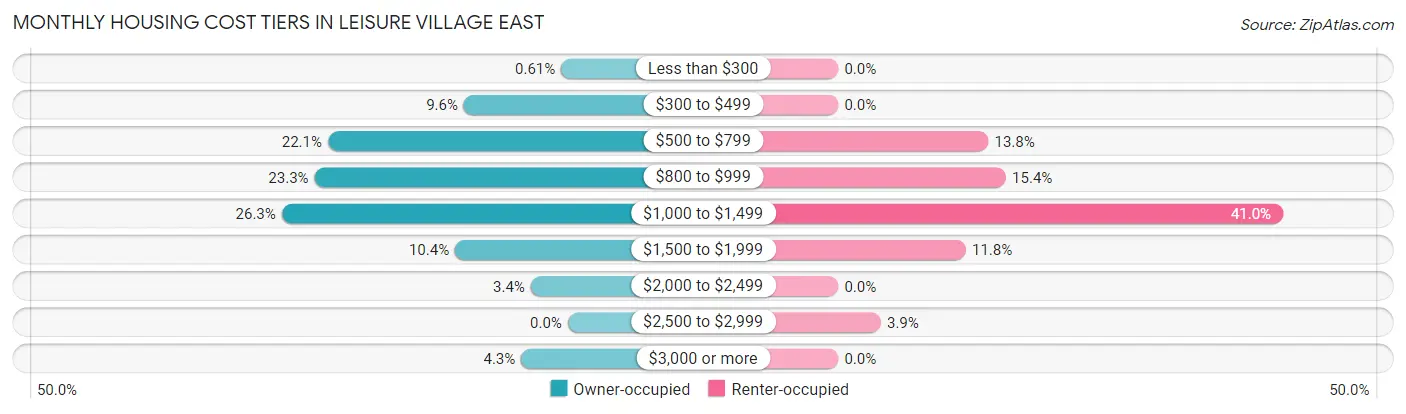
| Monthly Cost | Owner-occupied | Renter-occupied |
| Less than $300 | 16 (0.6%) | 0 (0.0%) |
| $300 to $499 | 250 (9.6%) | 0 (0.0%) |
| $500 to $799 | 577 (22.1%) | 60 (13.8%) |
| $800 to $999 | 609 (23.3%) | 67 (15.4%) |
| $1,000 to $1,499 | 688 (26.3%) | 178 (41.0%) |
| $1,500 to $1,999 | 271 (10.4%) | 51 (11.7%) |
| $2,000 to $2,499 | 89 (3.4%) | 0 (0.0%) |
| $2,500 to $2,999 | 0 (0.0%) | 17 (3.9%) |
| $3,000 or more | 112 (4.3%) | 0 (0.0%) |
| Total | 2,612 (100.0%) | 434 (100.0%) |
Physical Housing Characteristics in Leisure Village East
Housing Structures in Leisure Village East
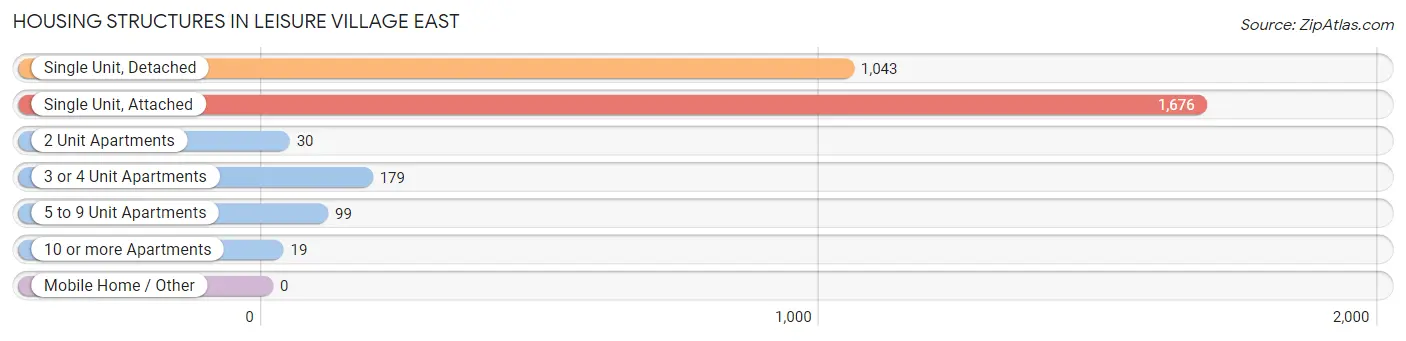
| Structure Type | # Housing Units | % Housing Units |
| Single Unit, Detached | 1,043 | 34.2% |
| Single Unit, Attached | 1,676 | 55.0% |
| 2 Unit Apartments | 30 | 1.0% |
| 3 or 4 Unit Apartments | 179 | 5.9% |
| 5 to 9 Unit Apartments | 99 | 3.3% |
| 10 or more Apartments | 19 | 0.6% |
| Mobile Home / Other | 0 | 0.0% |
| Total | 3,046 | 100.0% |
Housing Structures by Occupancy in Leisure Village East
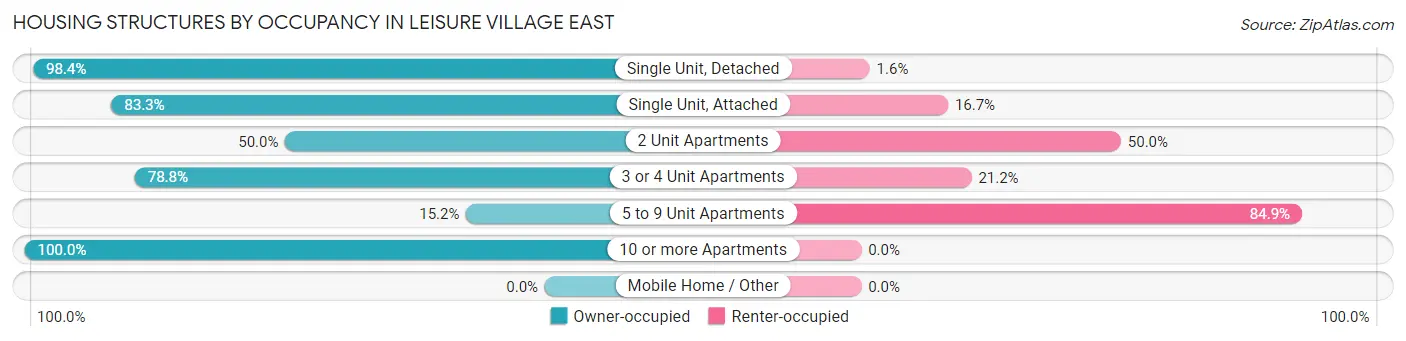
| Structure Type | Owner-occupied | Renter-occupied |
| Single Unit, Detached | 1,026 (98.4%) | 17 (1.6%) |
| Single Unit, Attached | 1,396 (83.3%) | 280 (16.7%) |
| 2 Unit Apartments | 15 (50.0%) | 15 (50.0%) |
| 3 or 4 Unit Apartments | 141 (78.8%) | 38 (21.2%) |
| 5 to 9 Unit Apartments | 15 (15.1%) | 84 (84.9%) |
| 10 or more Apartments | 19 (100.0%) | 0 (0.0%) |
| Mobile Home / Other | 0 (0.0%) | 0 (0.0%) |
| Total | 2,612 (85.8%) | 434 (14.2%) |
Housing Structures by Number of Rooms in Leisure Village East
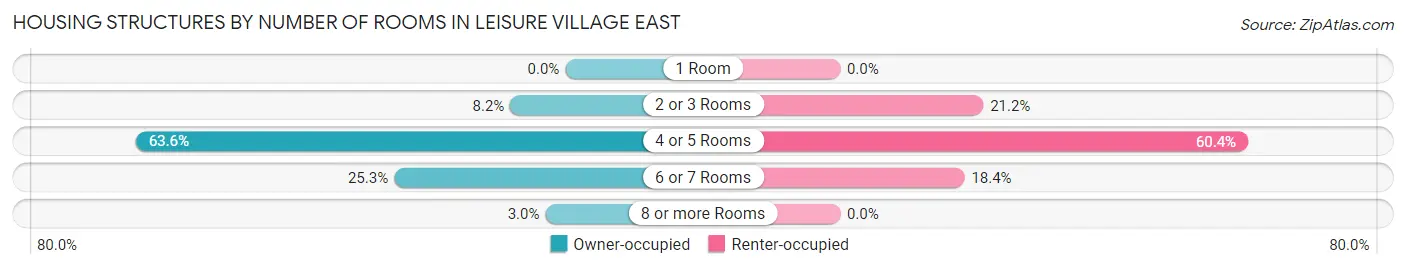
| Number of Rooms | Owner-occupied | Renter-occupied |
| 1 Room | 0 (0.0%) | 0 (0.0%) |
| 2 or 3 Rooms | 213 (8.2%) | 92 (21.2%) |
| 4 or 5 Rooms | 1,660 (63.5%) | 262 (60.4%) |
| 6 or 7 Rooms | 662 (25.3%) | 80 (18.4%) |
| 8 or more Rooms | 77 (2.9%) | 0 (0.0%) |
| Total | 2,612 (100.0%) | 434 (100.0%) |
Housing Structure by Heating Type in Leisure Village East
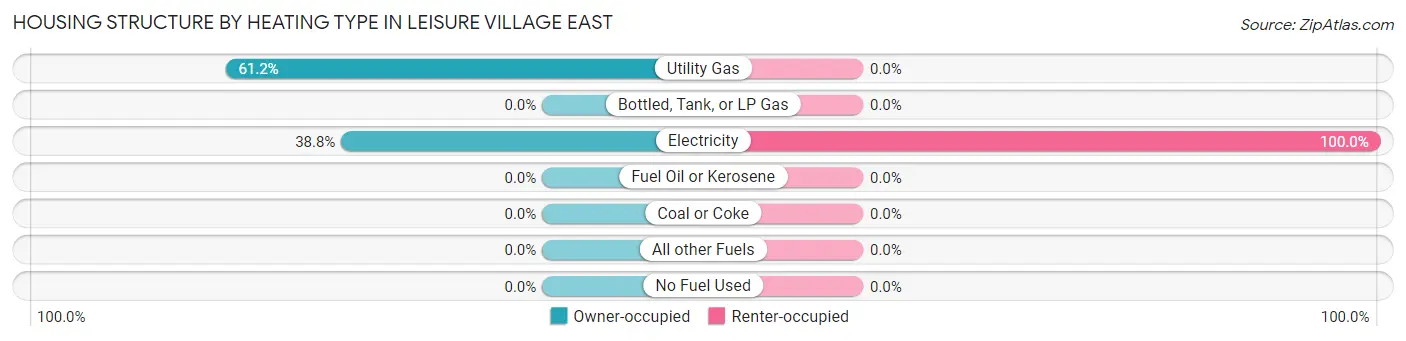
| Heating Type | Owner-occupied | Renter-occupied |
| Utility Gas | 1,598 (61.2%) | 0 (0.0%) |
| Bottled, Tank, or LP Gas | 0 (0.0%) | 0 (0.0%) |
| Electricity | 1,014 (38.8%) | 434 (100.0%) |
| Fuel Oil or Kerosene | 0 (0.0%) | 0 (0.0%) |
| Coal or Coke | 0 (0.0%) | 0 (0.0%) |
| All other Fuels | 0 (0.0%) | 0 (0.0%) |
| No Fuel Used | 0 (0.0%) | 0 (0.0%) |
| Total | 2,612 (100.0%) | 434 (100.0%) |
Household Vehicle Usage in Leisure Village East
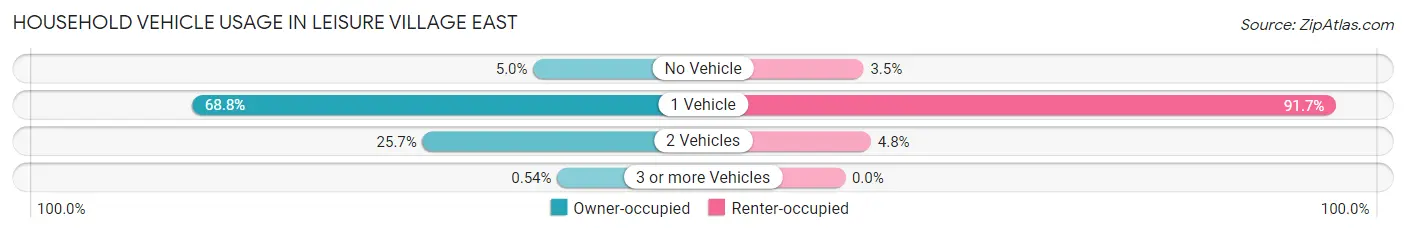
| Vehicles per Household | Owner-occupied | Renter-occupied |
| No Vehicle | 131 (5.0%) | 15 (3.5%) |
| 1 Vehicle | 1,796 (68.8%) | 398 (91.7%) |
| 2 Vehicles | 671 (25.7%) | 21 (4.8%) |
| 3 or more Vehicles | 14 (0.5%) | 0 (0.0%) |
| Total | 2,612 (100.0%) | 434 (100.0%) |
Real Estate & Mortgages in Leisure Village East
Real Estate and Mortgage Overview in Leisure Village East
| Characteristic | Without Mortgage | With Mortgage |
| Housing Units | 1,663 | 949 |
| Median Property Value | $196,700 | $250,500 |
| Median Household Income | $43,374 | $63 |
| Monthly Housing Costs | $806 | $112 |
| Real Estate Taxes | $3,752 | $56 |
Property Value by Mortgage Status in Leisure Village East
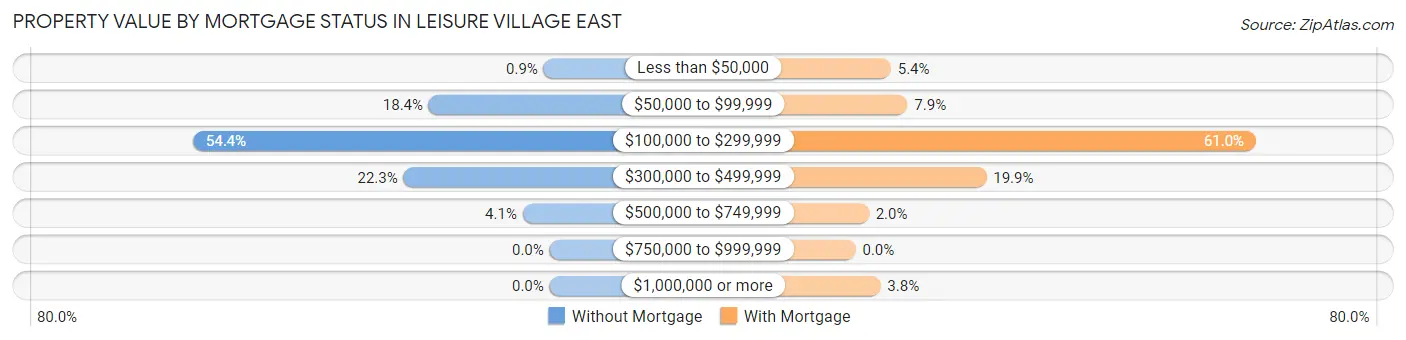
| Property Value | Without Mortgage | With Mortgage |
| Less than $50,000 | 15 (0.9%) | 51 (5.4%) |
| $50,000 to $99,999 | 306 (18.4%) | 75 (7.9%) |
| $100,000 to $299,999 | 904 (54.4%) | 579 (61.0%) |
| $300,000 to $499,999 | 370 (22.3%) | 189 (19.9%) |
| $500,000 to $749,999 | 68 (4.1%) | 19 (2.0%) |
| $750,000 to $999,999 | 0 (0.0%) | 0 (0.0%) |
| $1,000,000 or more | 0 (0.0%) | 36 (3.8%) |
| Total | 1,663 (100.0%) | 949 (100.0%) |
Household Income by Mortgage Status in Leisure Village East
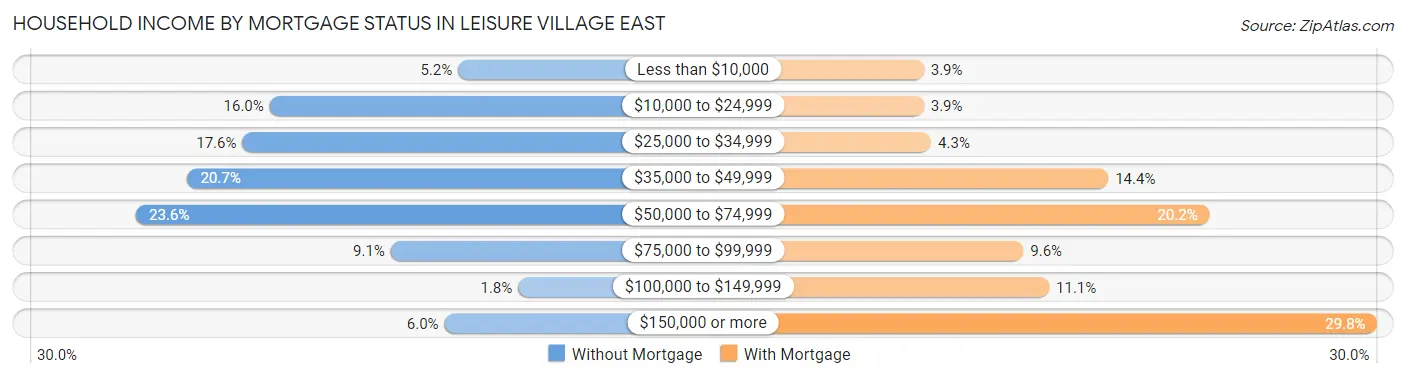
| Household Income | Without Mortgage | With Mortgage |
| Less than $10,000 | 87 (5.2%) | 37 (3.9%) |
| $10,000 to $24,999 | 266 (16.0%) | 37 (3.9%) |
| $25,000 to $34,999 | 292 (17.6%) | 41 (4.3%) |
| $35,000 to $49,999 | 344 (20.7%) | 137 (14.4%) |
| $50,000 to $74,999 | 393 (23.6%) | 192 (20.2%) |
| $75,000 to $99,999 | 151 (9.1%) | 91 (9.6%) |
| $100,000 to $149,999 | 30 (1.8%) | 105 (11.1%) |
| $150,000 or more | 100 (6.0%) | 283 (29.8%) |
| Total | 1,663 (100.0%) | 949 (100.0%) |
Property Value to Household Income Ratio in Leisure Village East
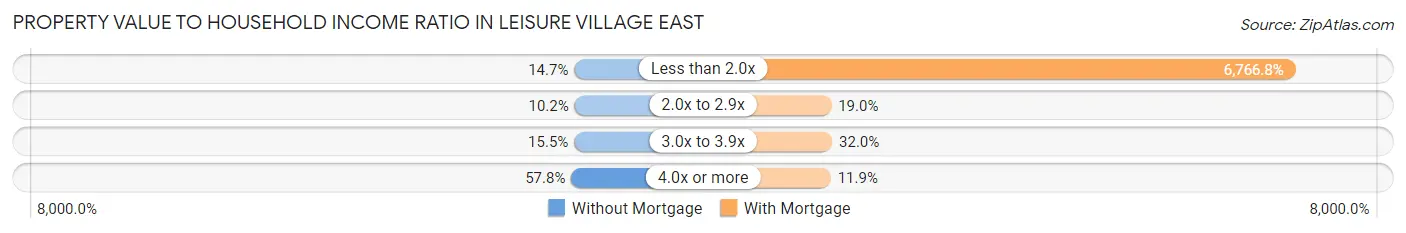
| Value-to-Income Ratio | Without Mortgage | With Mortgage |
| Less than 2.0x | 245 (14.7%) | 64,217 (6,766.8%) |
| 2.0x to 2.9x | 169 (10.2%) | 180 (19.0%) |
| 3.0x to 3.9x | 257 (15.4%) | 304 (32.0%) |
| 4.0x or more | 961 (57.8%) | 113 (11.9%) |
| Total | 1,663 (100.0%) | 949 (100.0%) |
Real Estate Taxes by Mortgage Status in Leisure Village East
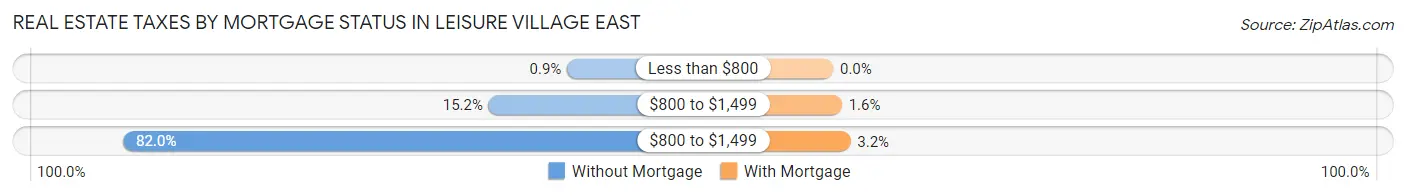
| Property Taxes | Without Mortgage | With Mortgage |
| Less than $800 | 15 (0.9%) | 0 (0.0%) |
| $800 to $1,499 | 253 (15.2%) | 15 (1.6%) |
| $800 to $1,499 | 1,364 (82.0%) | 30 (3.2%) |
| Total | 1,663 (100.0%) | 949 (100.0%) |
Health & Disability in Leisure Village East
Health Insurance Coverage by Age in Leisure Village East
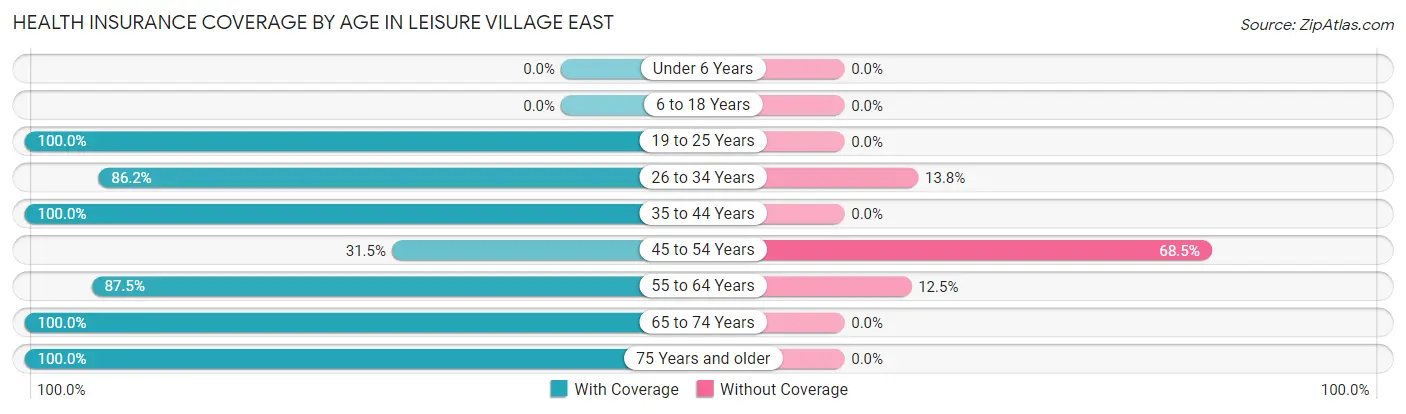
| Age Bracket | With Coverage | Without Coverage |
| Under 6 Years | 0 (0.0%) | 0 (0.0%) |
| 6 to 18 Years | 0 (0.0%) | 0 (0.0%) |
| 19 to 25 Years | 20 (100.0%) | 0 (0.0%) |
| 26 to 34 Years | 119 (86.2%) | 19 (13.8%) |
| 35 to 44 Years | 42 (100.0%) | 0 (0.0%) |
| 45 to 54 Years | 58 (31.5%) | 126 (68.5%) |
| 55 to 64 Years | 582 (87.5%) | 83 (12.5%) |
| 65 to 74 Years | 1,283 (100.0%) | 0 (0.0%) |
| 75 Years and older | 2,321 (100.0%) | 0 (0.0%) |
| Total | 4,425 (95.1%) | 228 (4.9%) |
Health Insurance Coverage by Citizenship Status in Leisure Village East
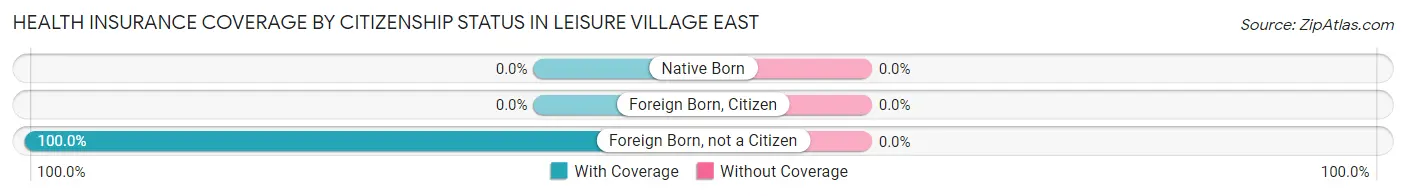
| Citizenship Status | With Coverage | Without Coverage |
| Native Born | 0 (0.0%) | 0 (0.0%) |
| Foreign Born, Citizen | 0 (0.0%) | 0 (0.0%) |
| Foreign Born, not a Citizen | 20 (100.0%) | 0 (0.0%) |
Health Insurance Coverage by Household Income in Leisure Village East
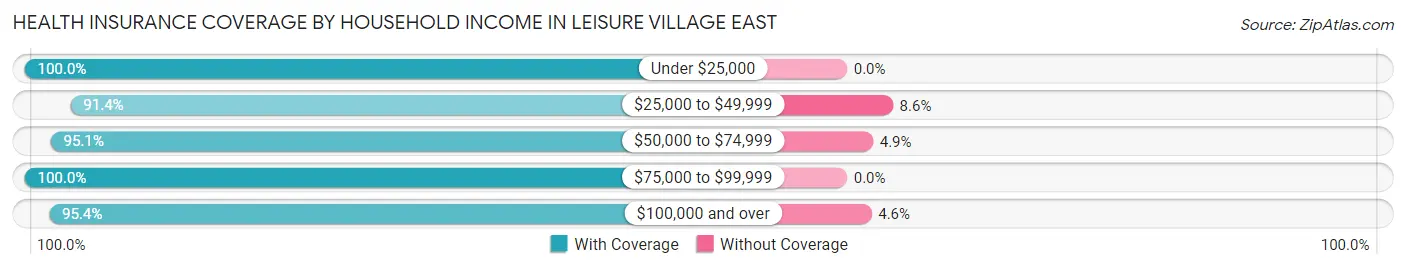
| Household Income | With Coverage | Without Coverage |
| Under $25,000 | 674 (100.0%) | 0 (0.0%) |
| $25,000 to $49,999 | 1,521 (91.4%) | 143 (8.6%) |
| $50,000 to $74,999 | 958 (95.1%) | 49 (4.9%) |
| $75,000 to $99,999 | 524 (100.0%) | 0 (0.0%) |
| $100,000 and over | 748 (95.4%) | 36 (4.6%) |
Public vs Private Health Insurance Coverage by Age in Leisure Village East
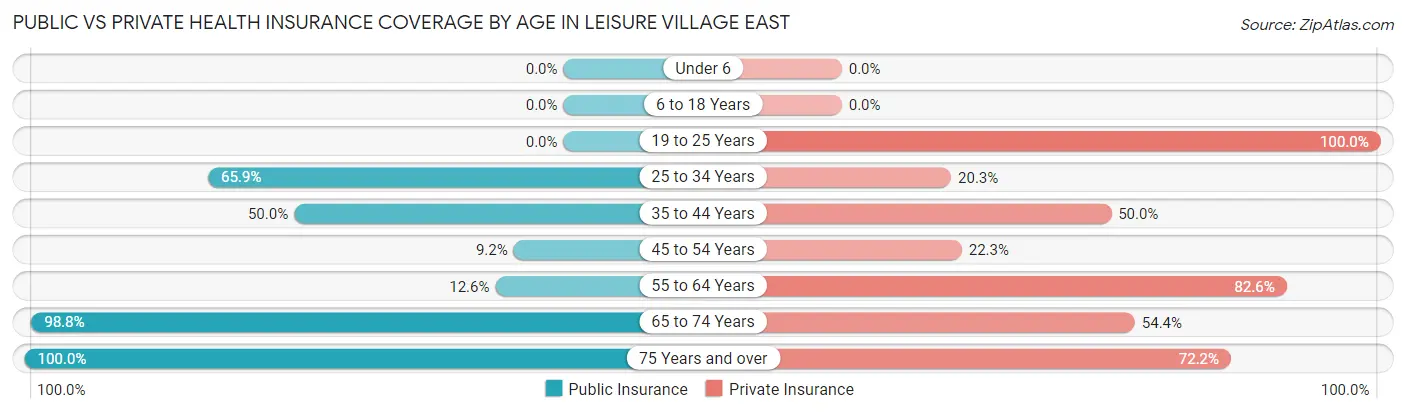
| Age Bracket | Public Insurance | Private Insurance |
| Under 6 | 0 (0.0%) | 0 (0.0%) |
| 6 to 18 Years | 0 (0.0%) | 0 (0.0%) |
| 19 to 25 Years | 0 (0.0%) | 20 (100.0%) |
| 25 to 34 Years | 91 (65.9%) | 28 (20.3%) |
| 35 to 44 Years | 21 (50.0%) | 21 (50.0%) |
| 45 to 54 Years | 17 (9.2%) | 41 (22.3%) |
| 55 to 64 Years | 84 (12.6%) | 549 (82.6%) |
| 65 to 74 Years | 1,267 (98.8%) | 698 (54.4%) |
| 75 Years and over | 2,321 (100.0%) | 1,676 (72.2%) |
| Total | 3,801 (81.7%) | 3,033 (65.2%) |
Disability Status by Sex by Age in Leisure Village East
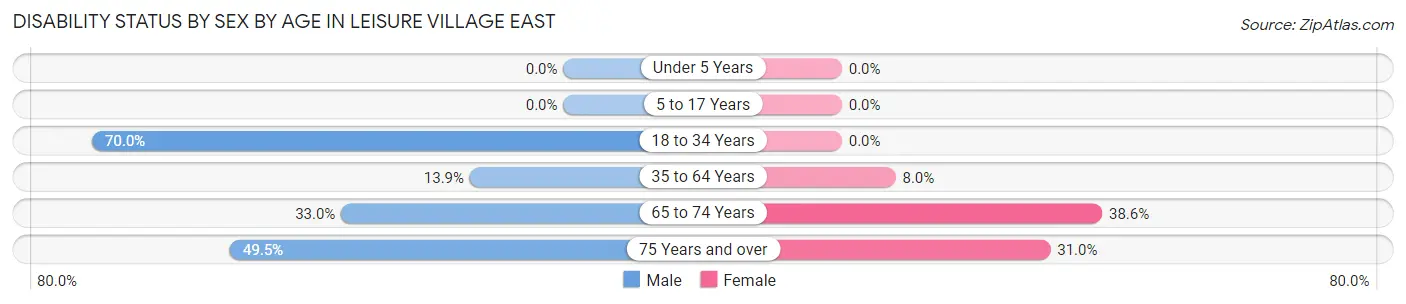
| Age Bracket | Male | Female |
| Under 5 Years | 0 (0.0%) | 0 (0.0%) |
| 5 to 17 Years | 0 (0.0%) | 0 (0.0%) |
| 18 to 34 Years | 91 (70.0%) | 0 (0.0%) |
| 35 to 64 Years | 68 (13.9%) | 32 (8.0%) |
| 65 to 74 Years | 127 (33.0%) | 347 (38.6%) |
| 75 Years and over | 455 (49.5%) | 434 (31.0%) |
Disability Class by Sex by Age in Leisure Village East
Disability Class: Hearing Difficulty
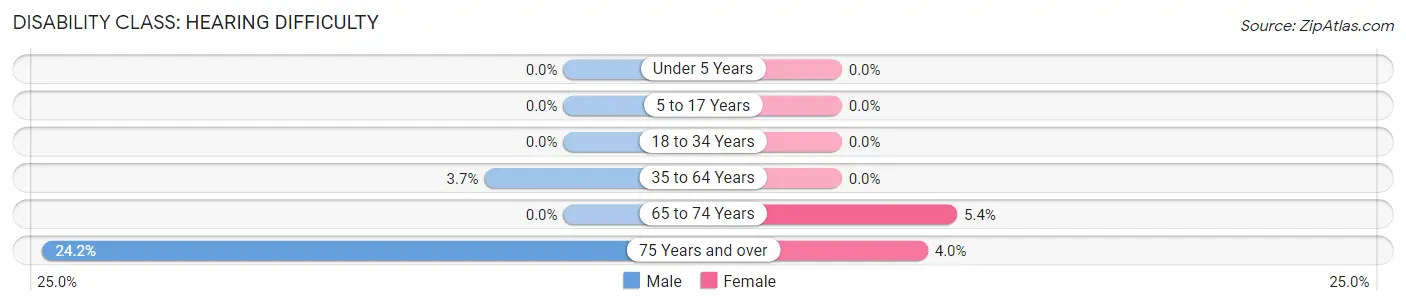
| Age Bracket | Male | Female |
| Under 5 Years | 0 (0.0%) | 0 (0.0%) |
| 5 to 17 Years | 0 (0.0%) | 0 (0.0%) |
| 18 to 34 Years | 0 (0.0%) | 0 (0.0%) |
| 35 to 64 Years | 18 (3.7%) | 0 (0.0%) |
| 65 to 74 Years | 0 (0.0%) | 48 (5.3%) |
| 75 Years and over | 222 (24.2%) | 56 (4.0%) |
Disability Class: Vision Difficulty
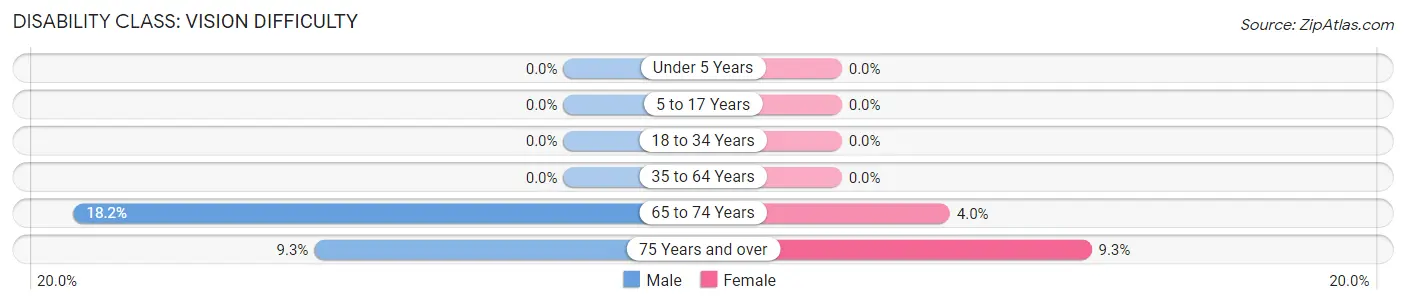
| Age Bracket | Male | Female |
| Under 5 Years | 0 (0.0%) | 0 (0.0%) |
| 5 to 17 Years | 0 (0.0%) | 0 (0.0%) |
| 18 to 34 Years | 0 (0.0%) | 0 (0.0%) |
| 35 to 64 Years | 0 (0.0%) | 0 (0.0%) |
| 65 to 74 Years | 70 (18.2%) | 36 (4.0%) |
| 75 Years and over | 85 (9.2%) | 130 (9.3%) |
Disability Class: Cognitive Difficulty
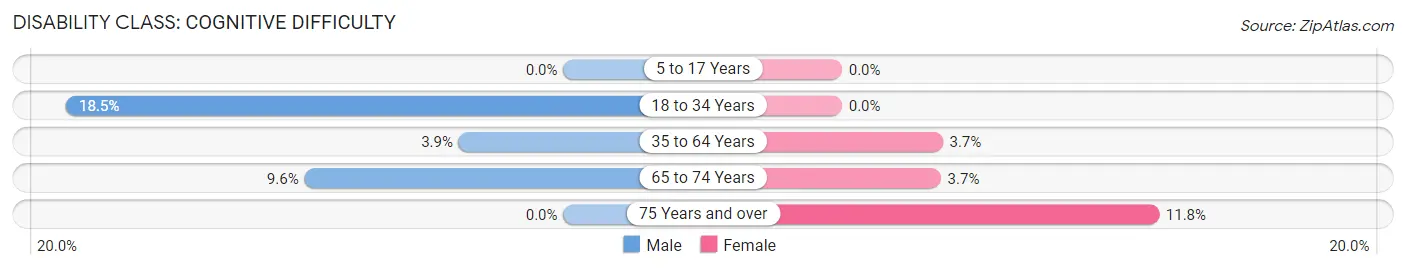
| Age Bracket | Male | Female |
| 5 to 17 Years | 0 (0.0%) | 0 (0.0%) |
| 18 to 34 Years | 24 (18.5%) | 0 (0.0%) |
| 35 to 64 Years | 19 (3.9%) | 15 (3.7%) |
| 65 to 74 Years | 37 (9.6%) | 33 (3.7%) |
| 75 Years and over | 0 (0.0%) | 165 (11.8%) |
Disability Class: Ambulatory Difficulty
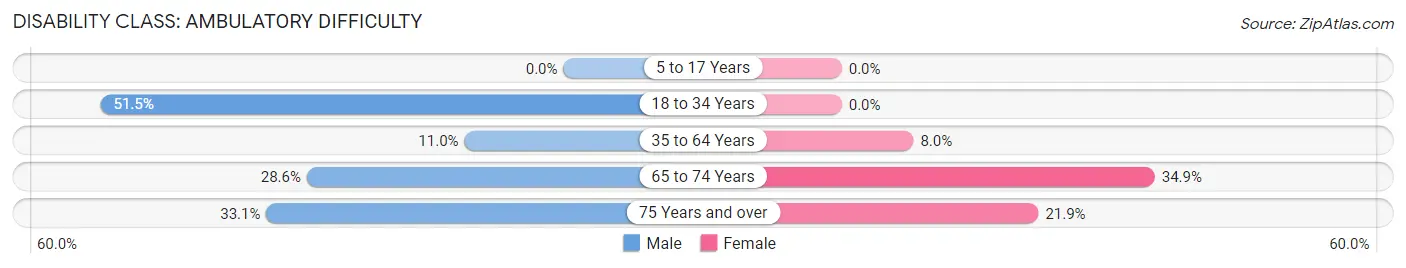
| Age Bracket | Male | Female |
| 5 to 17 Years | 0 (0.0%) | 0 (0.0%) |
| 18 to 34 Years | 67 (51.5%) | 0 (0.0%) |
| 35 to 64 Years | 54 (11.0%) | 32 (8.0%) |
| 65 to 74 Years | 110 (28.6%) | 313 (34.9%) |
| 75 Years and over | 304 (33.1%) | 307 (21.9%) |
Disability Class: Self-Care Difficulty
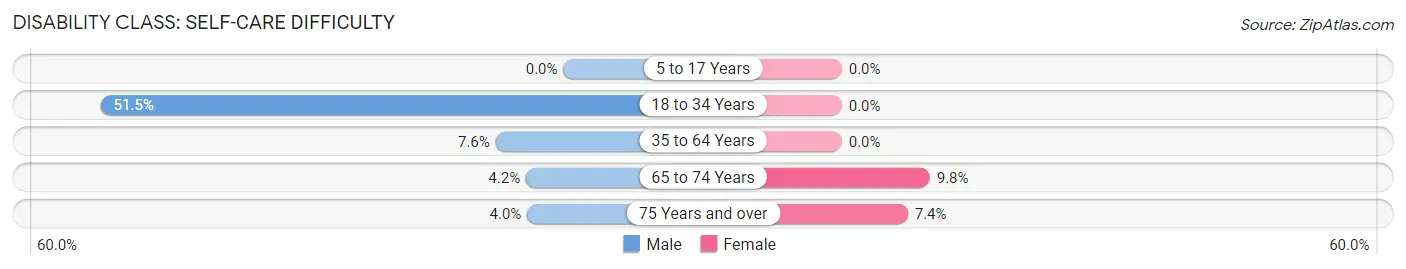
| Age Bracket | Male | Female |
| 5 to 17 Years | 0 (0.0%) | 0 (0.0%) |
| 18 to 34 Years | 67 (51.5%) | 0 (0.0%) |
| 35 to 64 Years | 37 (7.5%) | 0 (0.0%) |
| 65 to 74 Years | 16 (4.2%) | 88 (9.8%) |
| 75 Years and over | 37 (4.0%) | 103 (7.3%) |
Technology Access in Leisure Village East
Computing Device Access in Leisure Village East
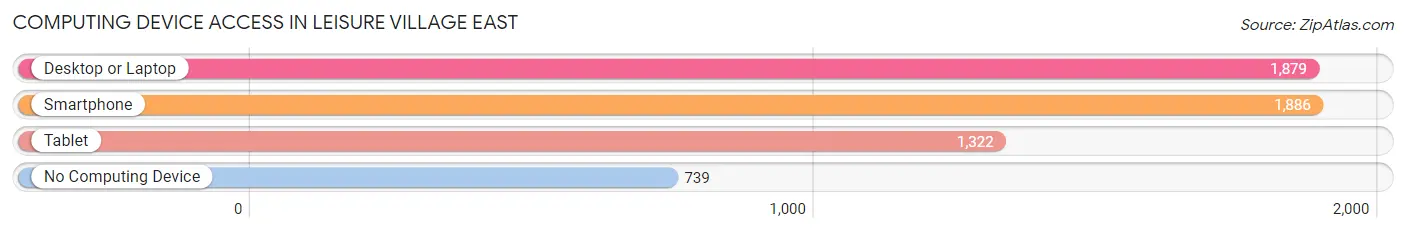
| Device Type | # Households | % Households |
| Desktop or Laptop | 1,879 | 61.7% |
| Smartphone | 1,886 | 61.9% |
| Tablet | 1,322 | 43.4% |
| No Computing Device | 739 | 24.3% |
| Total | 3,046 | 100.0% |
Internet Access in Leisure Village East
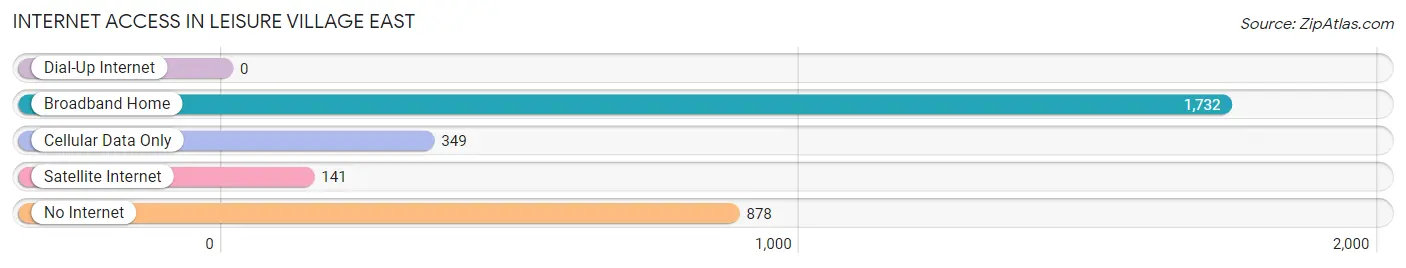
| Internet Type | # Households | % Households |
| Dial-Up Internet | 0 | 0.0% |
| Broadband Home | 1,732 | 56.9% |
| Cellular Data Only | 349 | 11.5% |
| Satellite Internet | 141 | 4.6% |
| No Internet | 878 | 28.8% |
| Total | 3,046 | 100.0% |
Leisure Village East Summary
Leisure Village East is a census-designated place located in Ocean County, New Jersey. It is a retirement community located in the township of Lakewood, and is part of the New York metropolitan area. As of the 2010 United States Census, the population of Leisure Village East was 2,845.
Geography
Leisure Village East is located at 40°6'25" North, 74°10'25" West (40.106944, -74.173611). It is situated in the northern part of Lakewood Township, and is bordered by the communities of Leisure Village West, Pine Lake Park, and Holiday City-Berkeley. The total area of Leisure Village East is 0.9 square miles, all of which is land.
History
Leisure Village East was established in 1969 as a retirement community. It was developed by the Leisure Village Corporation, which was founded by the late Robert E. Lee. The community was designed to provide a safe and secure environment for retirees, and was one of the first age-restricted communities in the United States.
The community was originally planned to have 1,500 homes, but the number of homes has since grown to over 2,000. The community is divided into two sections, Leisure Village East and Leisure Village West. The two sections are separated by a lake, and each section has its own clubhouse and recreational facilities.
Economy
Leisure Village East is a primarily residential community, and the majority of its residents are retired. The community does not have any major employers, but there are several small businesses located in the area. These businesses include a grocery store, a pharmacy, a bank, and a few restaurants.
Demographics
As of the 2010 United States Census, there were 2,845 people, 1,541 households, and 945 families residing in Leisure Village East. The population density was 3,093.3 people per square mile. The racial makeup of the community was 94.3% White, 2.2% African American, 0.3% Native American, 1.2% Asian, 0.1% Pacific Islander, 0.7% from other races, and 1.3% from two or more races. Hispanic or Latino of any race were 3.2% of the population.
The median age in Leisure Village East was 74.3 years. About 20.2% of residents were under the age of 18, and 8.2% were 65 years of age or older. The gender makeup of the community was 48.2% male and 51.8% female.
The median income for a household in Leisure Village East was $45,938, and the median income for a family was $50,938. About 8.2% of the population was below the poverty line.
Common Questions
What is Per Capita Income in Leisure Village East?
Per Capita income in Leisure Village East is $49,493.
What is the Median Family Income in Leisure Village East?
Median Family Income in Leisure Village East is $61,319.
What is the Median Household income in Leisure Village East?
Median Household Income in Leisure Village East is $45,395.
What is Inequality or Gini Index in Leisure Village East?
Inequality or Gini Index in Leisure Village East is 0.52.
What is the Total Population of Leisure Village East?
Total Population of Leisure Village East is 4,653.
What is the Total Male Population of Leisure Village East?
Total Male Population of Leisure Village East is 1,924.
What is the Total Female Population of Leisure Village East?
Total Female Population of Leisure Village East is 2,729.
What is the Ratio of Males per 100 Females in Leisure Village East?
There are 70.50 Males per 100 Females in Leisure Village East.
What is the Ratio of Females per 100 Males in Leisure Village East?
There are 141.84 Females per 100 Males in Leisure Village East.
What is the Median Population Age in Leisure Village East?
Median Population Age in Leisure Village East is 74.9 Years.
What is the Average Family Size in Leisure Village East
Average Family Size in Leisure Village East is 2.1 People.
What is the Average Household Size in Leisure Village East
Average Household Size in Leisure Village East is 1.5 People.
How Large is the Labor Force in Leisure Village East?
There are 1,121 People in the Labor Forcein in Leisure Village East.
What is the Percentage of People in the Labor Force in Leisure Village East?
24.1% of People are in the Labor Force in Leisure Village East.
What is the Unemployment Rate in Leisure Village East?
Unemployment Rate in Leisure Village East is 17.2%.