Zip Codes with the Highest Percentage of Population with a Degree in Liberal Arts and History in Paterson, NJ
RELATED REPORTS & OPTIONS
Liberal Arts and History
Paterson
Compare Zip Codes
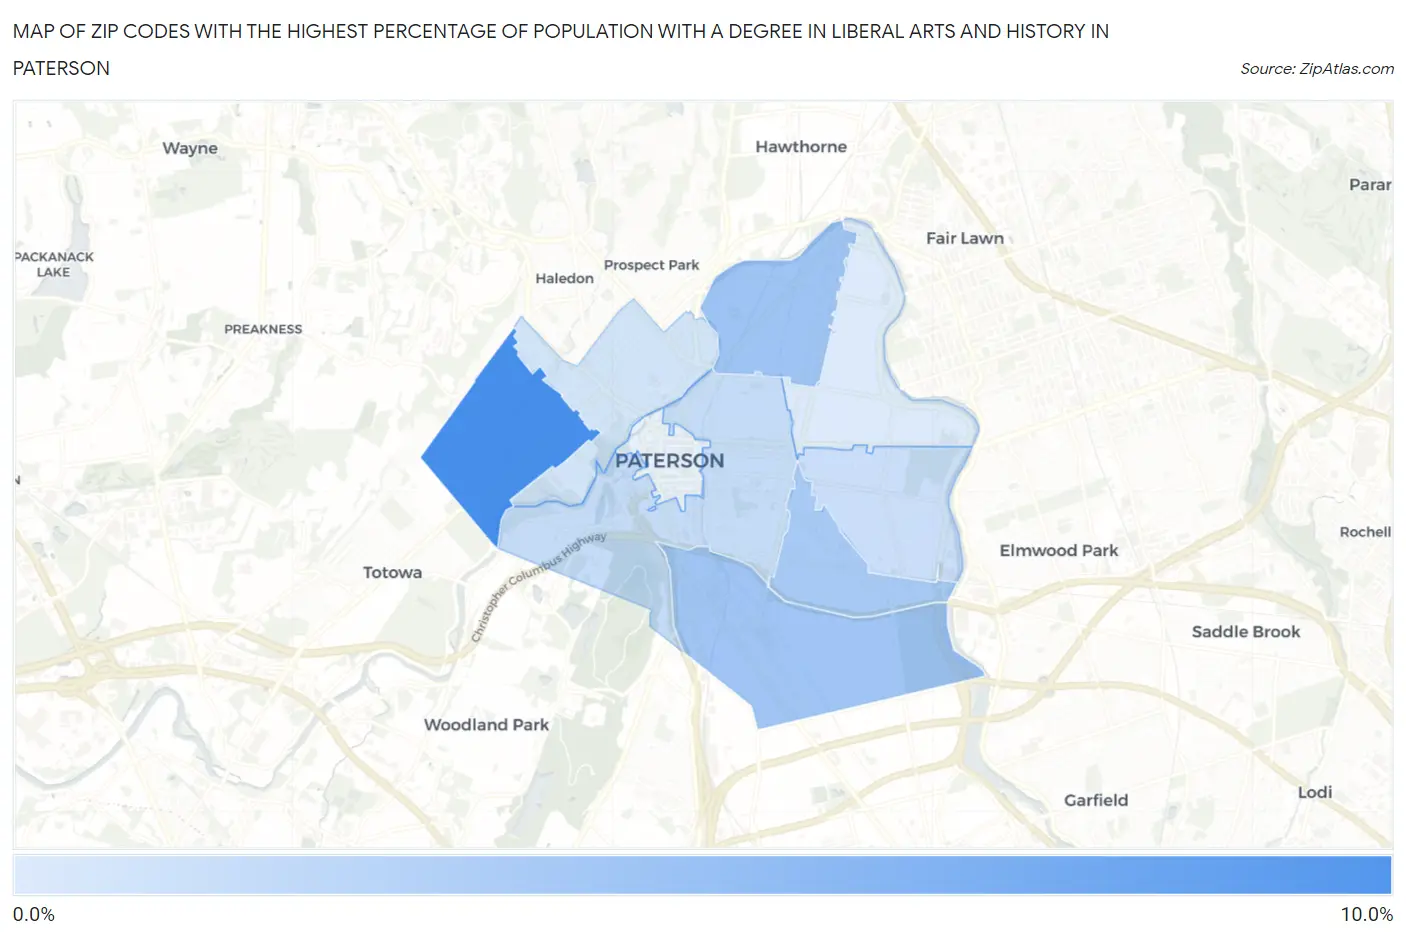
Map of Zip Codes with the Highest Percentage of Population with a Degree in Liberal Arts and History in Paterson
0.82%
8.5%
Zip Codes with the Highest Percentage of Population with a Degree in Liberal Arts and History in Paterson, NJ
| Zip Code | % Graduates | vs State | vs National | |
| 1. | 07502 | 8.5% | 4.6%(+3.89)#50 | 4.9%(+3.59)#4,374 |
| 2. | 07524 | 3.9% | 4.6%(-0.642)#314 | 4.9%(-0.945)#15,065 |
| 3. | 07503 | 3.8% | 4.6%(-0.794)#332 | 4.9%(-1.10)#15,613 |
| 4. | 07513 | 3.4% | 4.6%(-1.17)#369 | 4.9%(-1.47)#16,970 |
| 5. | 07501 | 1.9% | 4.6%(-2.66)#503 | 4.9%(-2.96)#21,598 |
| 6. | 07504 | 1.7% | 4.6%(-2.82)#513 | 4.9%(-3.12)#21,974 |
| 7. | 07522 | 1.3% | 4.6%(-3.30)#526 | 4.9%(-3.60)#22,926 |
| 8. | 07514 | 0.82% | 4.6%(-3.75)#536 | 4.9%(-4.06)#23,674 |
1
Common Questions
What are the Top 5 Zip Codes with the Highest Percentage of Population with a Degree in Liberal Arts and History in Paterson, NJ?
Top 5 Zip Codes with the Highest Percentage of Population with a Degree in Liberal Arts and History in Paterson, NJ are:
What zip code has the Highest Percentage of Population with a Degree in Liberal Arts and History in Paterson, NJ?
07502 has the Highest Percentage of Population with a Degree in Liberal Arts and History in Paterson, NJ with 8.5%.
What is the Percentage of Population with a Degree in Liberal Arts and History in Paterson, NJ?
Percentage of Population with a Degree in Liberal Arts and History in Paterson is 3.1%.
What is the Percentage of Population with a Degree in Liberal Arts and History in New Jersey?
Percentage of Population with a Degree in Liberal Arts and History in New Jersey is 4.6%.
What is the Percentage of Population with a Degree in Liberal Arts and History in the United States?
Percentage of Population with a Degree in Liberal Arts and History in the United States is 4.9%.