Zip Codes with the Highest Percentage of Population with a Degree in Computers and Mathematics in New Jersey
RELATED REPORTS & OPTIONS
Computers and Mathematics
New Jersey
Compare Zip Codes
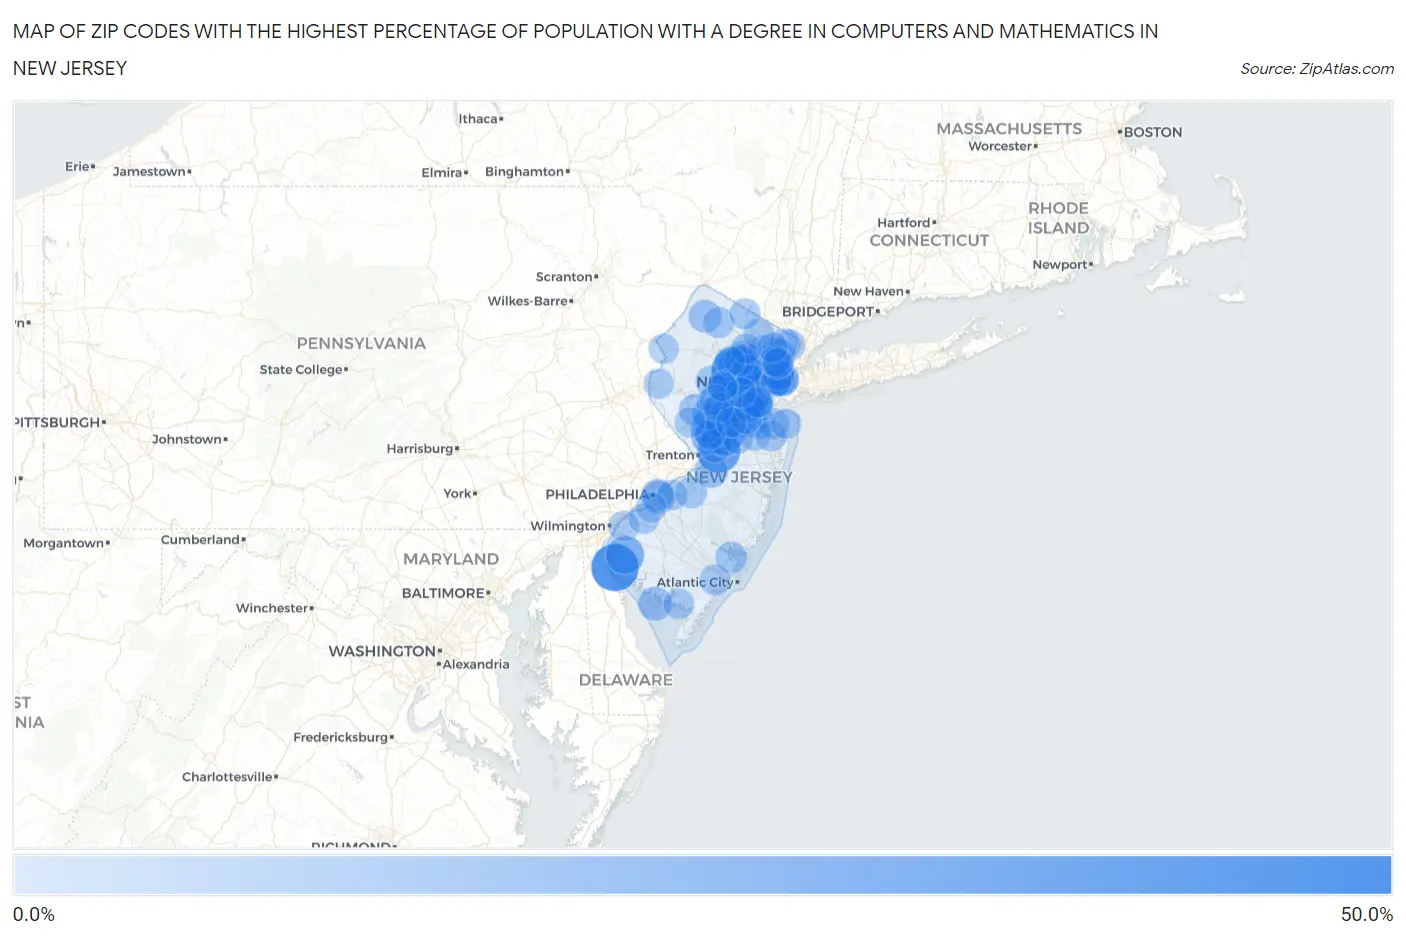
Map of Zip Codes with the Highest Percentage of Population with a Degree in Computers and Mathematics in New Jersey
0.0%
50.0%
Zip Codes with the Highest Percentage of Population with a Degree in Computers and Mathematics in New Jersey
| Zip Code | % Graduates | vs State | vs National | |
| 1. | 07961 | 47.6% | 6.2%(+41.5)#1 | 4.9%(+42.7)#95 |
| 2. | 08038 | 42.9% | 6.2%(+36.7)#2 | 4.9%(+38.0)#118 |
| 3. | 08561 | 33.8% | 6.2%(+27.7)#3 | 4.9%(+29.0)#180 |
| 4. | 08072 | 23.7% | 6.2%(+17.6)#4 | 4.9%(+18.8)#343 |
| 5. | 08544 | 21.7% | 6.2%(+15.5)#5 | 4.9%(+16.8)#403 |
| 6. | 07310 | 17.3% | 6.2%(+11.2)#6 | 4.9%(+12.4)#606 |
| 7. | 08820 | 17.0% | 6.2%(+10.8)#7 | 4.9%(+12.1)#630 |
| 8. | 08830 | 16.7% | 6.2%(+10.6)#8 | 4.9%(+11.9)#636 |
| 9. | 08536 | 16.6% | 6.2%(+10.4)#9 | 4.9%(+11.7)#657 |
| 10. | 08810 | 16.0% | 6.2%(+9.83)#10 | 4.9%(+11.1)#701 |
| 11. | 08880 | 15.8% | 6.2%(+9.63)#11 | 4.9%(+10.9)#717 |
| 12. | 08817 | 15.2% | 6.2%(+9.05)#12 | 4.9%(+10.3)#770 |
| 13. | 08321 | 14.8% | 6.2%(+8.65)#13 | 4.9%(+9.92)#808 |
| 14. | 08837 | 14.6% | 6.2%(+8.41)#14 | 4.9%(+9.69)#835 |
| 15. | 08852 | 14.5% | 6.2%(+8.32)#15 | 4.9%(+9.59)#847 |
| 16. | 08502 | 14.3% | 6.2%(+8.17)#16 | 4.9%(+9.44)#858 |
| 17. | 08824 | 14.3% | 6.2%(+8.12)#17 | 4.9%(+9.39)#861 |
| 18. | 07029 | 13.9% | 6.2%(+7.72)#18 | 4.9%(+8.99)#922 |
| 19. | 08515 | 13.7% | 6.2%(+7.50)#19 | 4.9%(+8.78)#948 |
| 20. | 07306 | 13.7% | 6.2%(+7.49)#20 | 4.9%(+8.77)#950 |
| 21. | 07946 | 13.5% | 6.2%(+7.36)#21 | 4.9%(+8.64)#975 |
| 22. | 07094 | 13.4% | 6.2%(+7.23)#22 | 4.9%(+8.51)#997 |
| 23. | 08550 | 13.2% | 6.2%(+7.00)#23 | 4.9%(+8.28)#1,027 |
| 24. | 07001 | 13.2% | 6.2%(+7.00)#24 | 4.9%(+8.27)#1,028 |
| 25. | 07822 | 12.9% | 6.2%(+6.72)#25 | 4.9%(+8.00)#1,068 |
| 26. | 08103 | 12.9% | 6.2%(+6.71)#26 | 4.9%(+7.98)#1,069 |
| 27. | 08512 | 12.6% | 6.2%(+6.40)#27 | 4.9%(+7.67)#1,115 |
| 28. | 07933 | 12.2% | 6.2%(+5.99)#28 | 4.9%(+7.26)#1,190 |
| 29. | 08854 | 12.1% | 6.2%(+5.91)#29 | 4.9%(+7.18)#1,203 |
| 30. | 07077 | 12.1% | 6.2%(+5.91)#30 | 4.9%(+7.18)#1,205 |
| 31. | 07311 | 12.0% | 6.2%(+5.87)#31 | 4.9%(+7.14)#1,207 |
| 32. | 07721 | 11.9% | 6.2%(+5.77)#32 | 4.9%(+7.04)#1,228 |
| 33. | 08859 | 11.9% | 6.2%(+5.72)#33 | 4.9%(+7.00)#1,236 |
| 34. | 08887 | 11.3% | 6.2%(+5.17)#34 | 4.9%(+6.44)#1,366 |
| 35. | 08102 | 11.3% | 6.2%(+5.14)#35 | 4.9%(+6.41)#1,378 |
| 36. | 07034 | 11.1% | 6.2%(+4.92)#36 | 4.9%(+6.19)#1,436 |
| 37. | 07065 | 11.0% | 6.2%(+4.79)#37 | 4.9%(+6.07)#1,464 |
| 38. | 08869 | 10.9% | 6.2%(+4.72)#38 | 4.9%(+6.00)#1,484 |
| 39. | 07927 | 10.6% | 6.2%(+4.48)#39 | 4.9%(+5.75)#1,538 |
| 40. | 08241 | 10.6% | 6.2%(+4.43)#40 | 4.9%(+5.70)#1,555 |
| 41. | 07302 | 10.5% | 6.2%(+4.37)#41 | 4.9%(+5.64)#1,570 |
| 42. | 08036 | 10.4% | 6.2%(+4.28)#42 | 4.9%(+5.55)#1,602 |
| 43. | 07974 | 10.4% | 6.2%(+4.19)#43 | 4.9%(+5.46)#1,624 |
| 44. | 08558 | 10.3% | 6.2%(+4.11)#44 | 4.9%(+5.38)#1,659 |
| 45. | 07088 | 10.2% | 6.2%(+4.07)#45 | 4.9%(+5.34)#1,677 |
| 46. | 07977 | 10.0% | 6.2%(+3.88)#46 | 4.9%(+5.15)#1,736 |
| 47. | 07058 | 10.0% | 6.2%(+3.88)#47 | 4.9%(+5.15)#1,737 |
| 48. | 08823 | 10.0% | 6.2%(+3.79)#48 | 4.9%(+5.06)#1,775 |
| 49. | 08540 | 9.9% | 6.2%(+3.78)#49 | 4.9%(+5.05)#1,778 |
| 50. | 07041 | 9.9% | 6.2%(+3.74)#50 | 4.9%(+5.01)#1,789 |
| 51. | 07057 | 9.9% | 6.2%(+3.74)#51 | 4.9%(+5.01)#1,792 |
| 52. | 07416 | 9.9% | 6.2%(+3.72)#52 | 4.9%(+4.99)#1,797 |
| 53. | 08844 | 9.7% | 6.2%(+3.55)#53 | 4.9%(+4.83)#1,875 |
| 54. | 08812 | 9.7% | 6.2%(+3.54)#54 | 4.9%(+4.81)#1,882 |
| 55. | 08816 | 9.7% | 6.2%(+3.53)#55 | 4.9%(+4.80)#1,885 |
| 56. | 07939 | 9.7% | 6.2%(+3.51)#56 | 4.9%(+4.78)#1,894 |
| 57. | 07054 | 9.7% | 6.2%(+3.48)#57 | 4.9%(+4.76)#1,904 |
| 58. | 07751 | 9.4% | 6.2%(+3.27)#58 | 4.9%(+4.54)#2,000 |
| 59. | 08234 | 9.4% | 6.2%(+3.25)#59 | 4.9%(+4.52)#2,006 |
| 60. | 07307 | 9.4% | 6.2%(+3.25)#60 | 4.9%(+4.52)#2,009 |
| 61. | 07095 | 9.3% | 6.2%(+3.11)#61 | 4.9%(+4.39)#2,075 |
| 62. | 07008 | 9.3% | 6.2%(+3.09)#62 | 4.9%(+4.37)#2,090 |
| 63. | 07758 | 9.2% | 6.2%(+3.05)#63 | 4.9%(+4.32)#2,102 |
| 64. | 08873 | 9.2% | 6.2%(+3.03)#64 | 4.9%(+4.30)#2,115 |
| 65. | 07436 | 9.0% | 6.2%(+2.83)#65 | 4.9%(+4.11)#2,255 |
| 66. | 07502 | 9.0% | 6.2%(+2.82)#66 | 4.9%(+4.09)#2,264 |
| 67. | 07421 | 9.0% | 6.2%(+2.80)#67 | 4.9%(+4.07)#2,282 |
| 68. | 08807 | 8.9% | 6.2%(+2.74)#68 | 4.9%(+4.02)#2,310 |
| 69. | 07662 | 8.8% | 6.2%(+2.67)#69 | 4.9%(+3.94)#2,347 |
| 70. | 07601 | 8.7% | 6.2%(+2.56)#70 | 4.9%(+3.84)#2,408 |
| 71. | 08904 | 8.7% | 6.2%(+2.55)#71 | 4.9%(+3.82)#2,413 |
| 72. | 07039 | 8.7% | 6.2%(+2.53)#72 | 4.9%(+3.81)#2,420 |
| 73. | 08835 | 8.7% | 6.2%(+2.50)#73 | 4.9%(+3.77)#2,444 |
| 74. | 07738 | 8.7% | 6.2%(+2.48)#74 | 4.9%(+3.76)#2,449 |
| 75. | 07641 | 8.6% | 6.2%(+2.48)#75 | 4.9%(+3.75)#2,452 |
| 76. | 07304 | 8.6% | 6.2%(+2.43)#76 | 4.9%(+3.70)#2,476 |
| 77. | 08314 | 8.5% | 6.2%(+2.31)#77 | 4.9%(+3.58)#2,557 |
| 78. | 07627 | 8.5% | 6.2%(+2.30)#78 | 4.9%(+3.57)#2,561 |
| 79. | 07082 | 8.5% | 6.2%(+2.29)#79 | 4.9%(+3.57)#2,566 |
| 80. | 08831 | 8.4% | 6.2%(+2.27)#80 | 4.9%(+3.54)#2,575 |
| 81. | 08872 | 8.4% | 6.2%(+2.24)#81 | 4.9%(+3.52)#2,592 |
| 82. | 08067 | 8.4% | 6.2%(+2.23)#82 | 4.9%(+3.50)#2,599 |
| 83. | 07074 | 8.3% | 6.2%(+2.18)#83 | 4.9%(+3.45)#2,626 |
| 84. | 08056 | 8.3% | 6.2%(+2.11)#84 | 4.9%(+3.38)#2,687 |
| 85. | 08542 | 8.3% | 6.2%(+2.10)#85 | 4.9%(+3.37)#2,695 |
| 86. | 08551 | 8.2% | 6.2%(+2.06)#86 | 4.9%(+3.34)#2,724 |
| 87. | 08863 | 8.2% | 6.2%(+2.06)#87 | 4.9%(+3.33)#2,730 |
| 88. | 08052 | 8.2% | 6.2%(+2.00)#88 | 4.9%(+3.28)#2,769 |
| 89. | 07075 | 8.1% | 6.2%(+1.95)#89 | 4.9%(+3.23)#2,805 |
| 90. | 07064 | 8.1% | 6.2%(+1.91)#90 | 4.9%(+3.19)#2,835 |
| 91. | 08902 | 8.1% | 6.2%(+1.89)#91 | 4.9%(+3.17)#2,855 |
| 92. | 07072 | 8.0% | 6.2%(+1.88)#92 | 4.9%(+3.15)#2,865 |
| 93. | 07410 | 8.0% | 6.2%(+1.88)#93 | 4.9%(+3.15)#2,867 |
| 94. | 08063 | 7.9% | 6.2%(+1.77)#94 | 4.9%(+3.05)#2,948 |
| 95. | 07950 | 7.8% | 6.2%(+1.63)#95 | 4.9%(+2.90)#3,068 |
| 96. | 07732 | 7.7% | 6.2%(+1.57)#96 | 4.9%(+2.85)#3,107 |
| 97. | 07023 | 7.7% | 6.2%(+1.53)#97 | 4.9%(+2.80)#3,138 |
| 98. | 07832 | 7.7% | 6.2%(+1.52)#98 | 4.9%(+2.79)#3,170 |
| 99. | 08886 | 7.7% | 6.2%(+1.50)#99 | 4.9%(+2.78)#3,179 |
| 100. | 07920 | 7.7% | 6.2%(+1.50)#100 | 4.9%(+2.77)#3,182 |
Common Questions
What are the Top 10 Zip Codes with the Highest Percentage of Population with a Degree in Computers and Mathematics in New Jersey?
Top 10 Zip Codes with the Highest Percentage of Population with a Degree in Computers and Mathematics in New Jersey are:
What zip code has the Highest Percentage of Population with a Degree in Computers and Mathematics in New Jersey?
07961 has the Highest Percentage of Population with a Degree in Computers and Mathematics in New Jersey with 47.6%.
What is the Percentage of Population with a Degree in Computers and Mathematics in the State of New Jersey?
Percentage of Population with a Degree in Computers and Mathematics in New Jersey is 6.2%.
What is the Percentage of Population with a Degree in Computers and Mathematics in the United States?
Percentage of Population with a Degree in Computers and Mathematics in the United States is 4.9%.