Zip Codes with the Highest Percentage of Population with a Degree in Computers and Mathematics in Princeton, NJ

RELATED REPORTS & OPTIONS

Computers and Mathematics
Population
Families and Households
Female Fertility
Race (Community Size)
Race (Percentage)
Ancestry (Community Size)
AfricanAlbanianAmericanArabArgentineanArmenianAustralianAustrianBangladeshiBelgianBhutaneseBrazilianBritishBulgarianBurmeseCanadianCentral AmericanCentral American IndianCherokeeChileanColombianCosta RicanCroatianCubanCzechCzechoslovakianDanishDominicanDutchEastern EuropeanEcuadorianEgyptianEnglishEthiopianEuropeanFilipinoFrenchFrench CanadianGermanGreekGuatemalanGuyaneseHaitianHonduranHungarianIndian (Asian)IranianIrishIsraeliItalianJamaicanKenyanKoreanLaotianLebaneseLiberianLithuanianMacedonianMexicanMongolianMoroccanNigerianNorthern EuropeanNorwegianOkinawanPakistaniPalestinianPeruvianPolishPortuguesePuerto RicanRomanianRussianScandinavianScotch-IrishScottishSloveneSouth AfricanSouth AmericanSouth American IndianSpaniardSpanishSri LankanSubsaharan AfricanSwedishSwissSyrianThaiTurkishUkrainianWelshWest IndianYugoslavian
Ancestry (Percentage)
AfricanAlbanianAmericanArabArgentineanArmenianAustralianAustrianBangladeshiBelgianBhutaneseBrazilianBritishBulgarianBurmeseCanadianCentral AmericanCentral American IndianCherokeeChileanColombianCosta RicanCroatianCubanCzechCzechoslovakianDanishDominicanDutchEastern EuropeanEcuadorianEgyptianEnglishEthiopianEuropeanFilipinoFrenchFrench CanadianGermanGreekGuatemalanGuyaneseHaitianHonduranHungarianIndian (Asian)IranianIrishIsraeliItalianJamaicanKenyanKoreanLaotianLebaneseLiberianLithuanianMacedonianMexicanMongolianMoroccanNigerianNorthern EuropeanNorwegianOkinawanPakistaniPalestinianPeruvianPolishPortuguesePuerto RicanRomanianRussianScandinavianScotch-IrishScottishSloveneSouth AfricanSouth AmericanSouth American IndianSpaniardSpanishSri LankanSubsaharan AfricanSwedishSwissSyrianThaiTurkishUkrainianWelshWest IndianYugoslavian
Immigrant Origin (Total)
Immigrant Origin (Percentage)
Income
Income (Families)
Income (Households)
Poverty
Poverty (Families)
Unemployment
Employment Occupations
Employment Industries
Employer Class
Commute Time
Commute Means
School Enrollment
Education by Degree Field
Occupancy
Finances
Physical Characteristics
Princeton
Compare Zip Codes
Comparison Subject

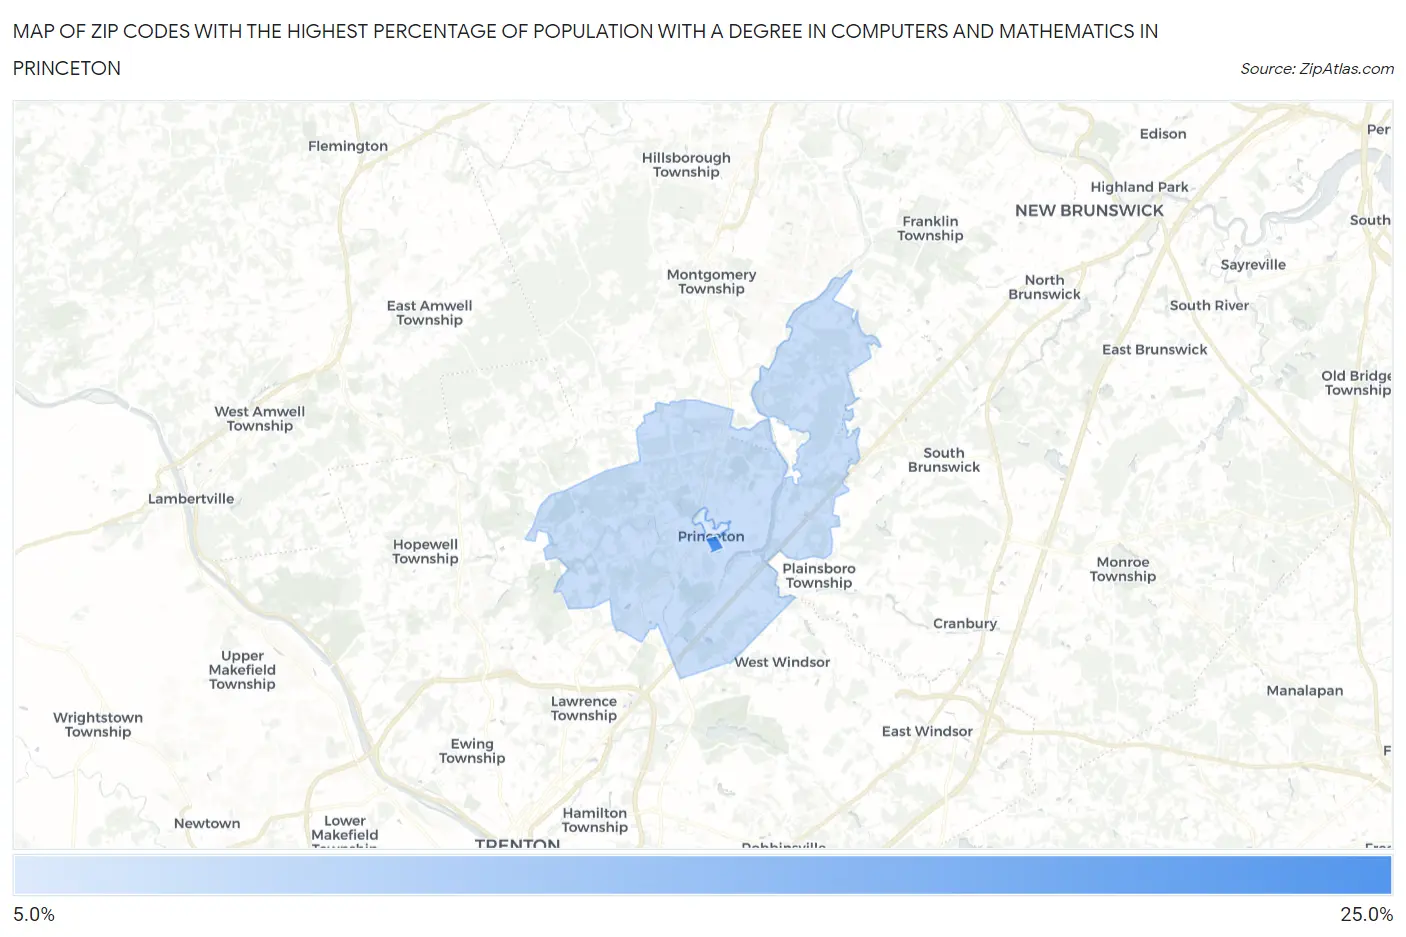
Map of Zip Codes with the Highest Percentage of Population with a Degree in Computers and Mathematics in Princeton

0.0%
25.0%
Zip Codes with the Highest Percentage of Population with a Degree in Computers and Mathematics in Princeton Map

Zip Codes with the Highest Percentage of Population with a Degree in Computers and Mathematics in Princeton, NJ

Zip Code % Graduates vs State vs National
1.0854421.7%6.2%(+15.5)#54.9%(+16.8)#403
2.085409.9%6.2%(+3.78)#494.9%(+5.05)#1,778
3.085428.3%6.2%(+2.10)#854.9%(+3.37)#2,695

Common Questions

What are the Top Zip Codes with the Highest Percentage of Population with a Degree in Computers and Mathematics in Princeton, NJ?
Top Zip Codes with the Highest Percentage of Population with a Degree in Computers and Mathematics in Princeton, NJ are:
#1
21.7%
#2
9.9%
#3
8.3%
What zip code has the Highest Percentage of Population with a Degree in Computers and Mathematics in Princeton, NJ?
08544 has the Highest Percentage of Population with a Degree in Computers and Mathematics in Princeton, NJ with 21.7%.
What is the Percentage of Population with a Degree in Computers and Mathematics in Princeton, NJ?
Percentage of Population with a Degree in Computers and Mathematics in Princeton is 9.1%.
What is the Percentage of Population with a Degree in Computers and Mathematics in New Jersey?
Percentage of Population with a Degree in Computers and Mathematics in New Jersey is 6.2%.
What is the Percentage of Population with a Degree in Computers and Mathematics in the United States?
Percentage of Population with a Degree in Computers and Mathematics in the United States is 4.9%.