Zip Codes with the Highest Percentage of Population Employed in Accommodation & Food Services in Princeton, NJ
RELATED REPORTS & OPTIONS
Accommodation & Food Services
Princeton
Compare Zip Codes
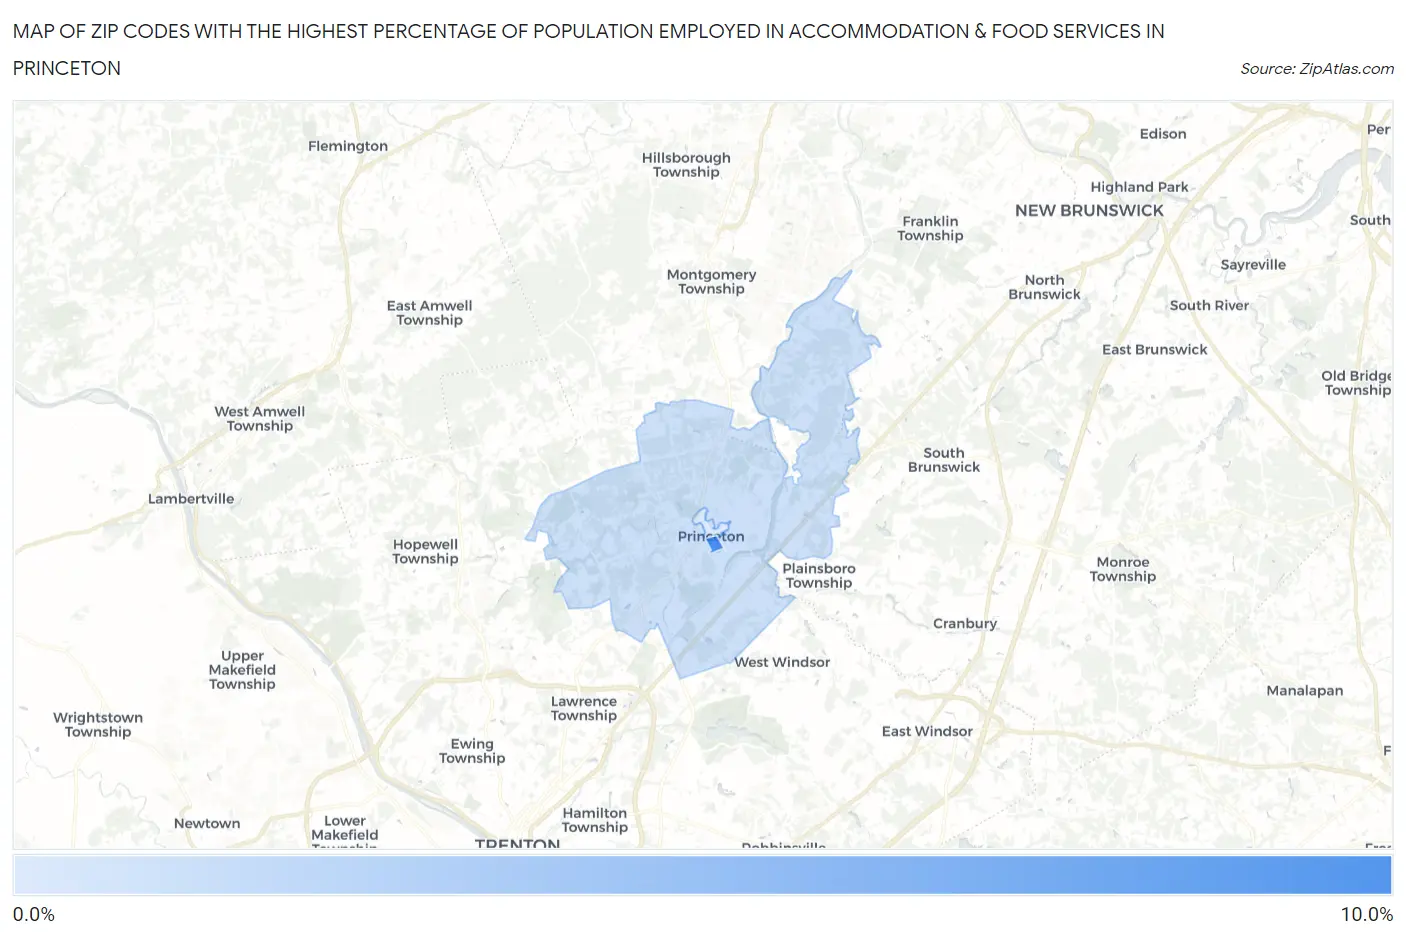
Map of Zip Codes with the Highest Percentage of Population Employed in Accommodation & Food Services in Princeton
1.4%
8.3%
Zip Codes with the Highest Percentage of Population Employed in Accommodation & Food Services in Princeton, NJ
| Zip Code | % Employed | vs State | vs National | |
| 1. | 08544 | 8.3% | 5.3%(+2.99)#69 | 6.9%(+1.39)#7,278 |
| 2. | 08540 | 2.1% | 5.3%(-3.19)#493 | 6.9%(-4.79)#25,389 |
| 3. | 08542 | 1.4% | 5.3%(-3.91)#522 | 6.9%(-5.51)#26,701 |
1
Common Questions
What are the Top Zip Codes with the Highest Percentage of Population Employed in Accommodation & Food Services in Princeton, NJ?
Top Zip Codes with the Highest Percentage of Population Employed in Accommodation & Food Services in Princeton, NJ are:
What zip code has the Highest Percentage of Population Employed in Accommodation & Food Services in Princeton, NJ?
08544 has the Highest Percentage of Population Employed in Accommodation & Food Services in Princeton, NJ with 8.3%.
What is the Percentage of Population Employed in Accommodation & Food Services in Princeton, NJ?
Percentage of Population Employed in Accommodation & Food Services in Princeton is 2.6%.
What is the Percentage of Population Employed in Accommodation & Food Services in New Jersey?
Percentage of Population Employed in Accommodation & Food Services in New Jersey is 5.3%.
What is the Percentage of Population Employed in Accommodation & Food Services in the United States?
Percentage of Population Employed in Accommodation & Food Services in the United States is 6.9%.