Zip Codes with the Highest Percentage of Population Employed in Accommodation & Food Services in Jersey City, NJ
RELATED REPORTS & OPTIONS
Accommodation & Food Services
Jersey City
Compare Zip Codes
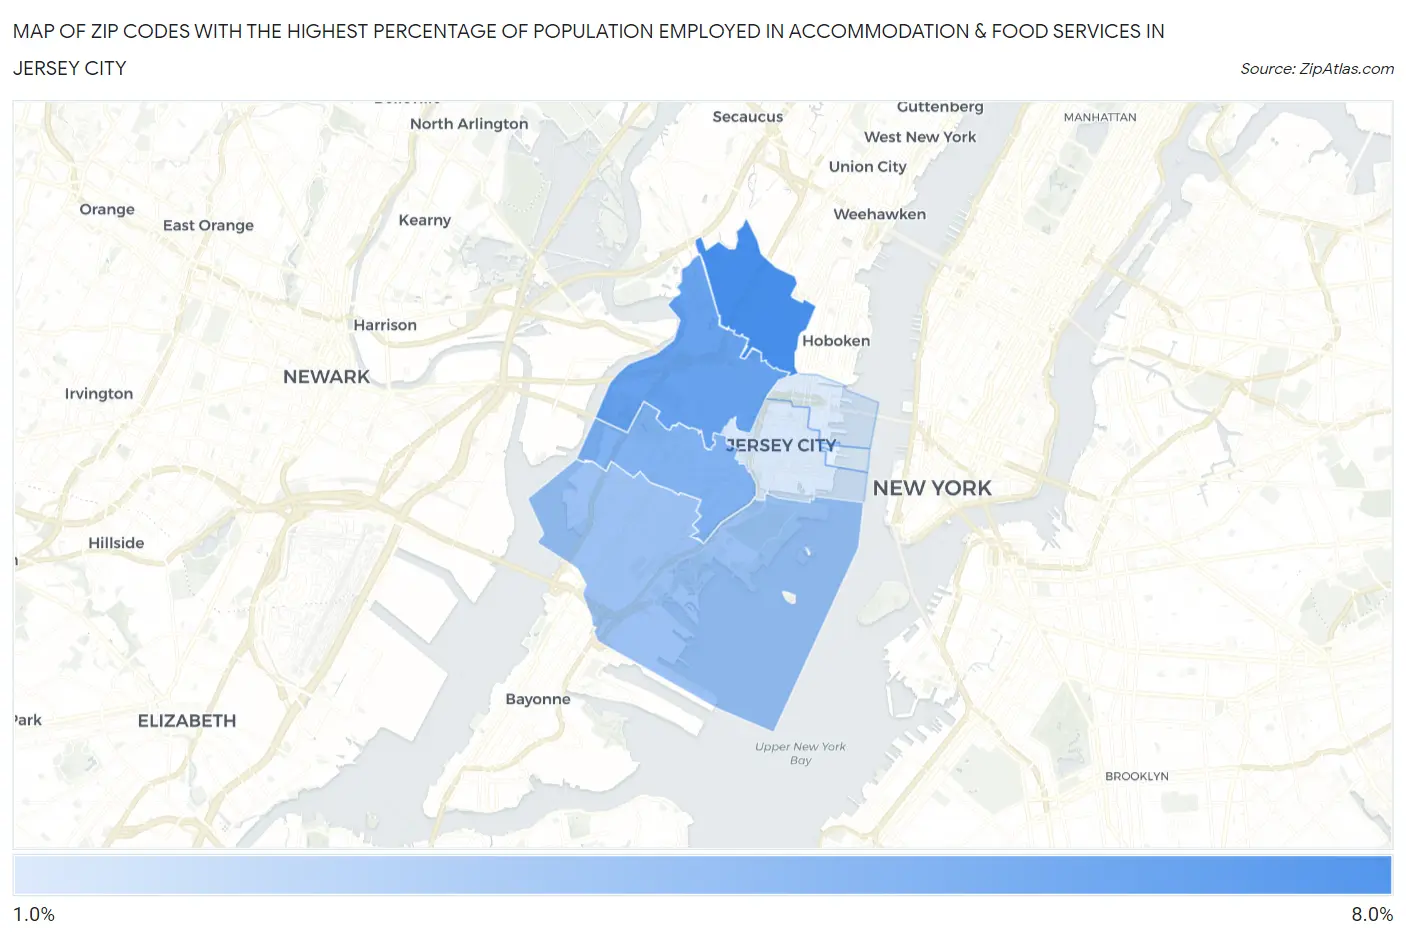
Map of Zip Codes with the Highest Percentage of Population Employed in Accommodation & Food Services in Jersey City
1.8%
7.2%
Zip Codes with the Highest Percentage of Population Employed in Accommodation & Food Services in Jersey City, NJ
| Zip Code | % Employed | vs State | vs National | |
| 1. | 07307 | 7.2% | 5.3%(+1.89)#112 | 6.9%(+0.284)#9,887 |
| 2. | 07306 | 6.0% | 5.3%(+0.684)#176 | 6.9%(-0.920)#13,574 |
| 3. | 07304 | 5.0% | 5.3%(-0.232)#244 | 6.9%(-1.84)#16,668 |
| 4. | 07305 | 4.1% | 5.3%(-1.19)#328 | 6.9%(-2.80)#19,865 |
| 5. | 07302 | 2.0% | 5.3%(-3.25)#496 | 6.9%(-4.85)#25,490 |
| 6. | 07310 | 1.8% | 5.3%(-3.44)#507 | 6.9%(-5.04)#25,874 |
1
Common Questions
What are the Top 5 Zip Codes with the Highest Percentage of Population Employed in Accommodation & Food Services in Jersey City, NJ?
Top 5 Zip Codes with the Highest Percentage of Population Employed in Accommodation & Food Services in Jersey City, NJ are:
What zip code has the Highest Percentage of Population Employed in Accommodation & Food Services in Jersey City, NJ?
07307 has the Highest Percentage of Population Employed in Accommodation & Food Services in Jersey City, NJ with 7.2%.
What is the Percentage of Population Employed in Accommodation & Food Services in Jersey City, NJ?
Percentage of Population Employed in Accommodation & Food Services in Jersey City is 4.3%.
What is the Percentage of Population Employed in Accommodation & Food Services in New Jersey?
Percentage of Population Employed in Accommodation & Food Services in New Jersey is 5.3%.
What is the Percentage of Population Employed in Accommodation & Food Services in the United States?
Percentage of Population Employed in Accommodation & Food Services in the United States is 6.9%.