Zip Codes with the Highest Percentage of Population Employed in Accommodation & Food Services in Cherry Hill, NJ
RELATED REPORTS & OPTIONS
Accommodation & Food Services
Cherry Hill
Compare Zip Codes
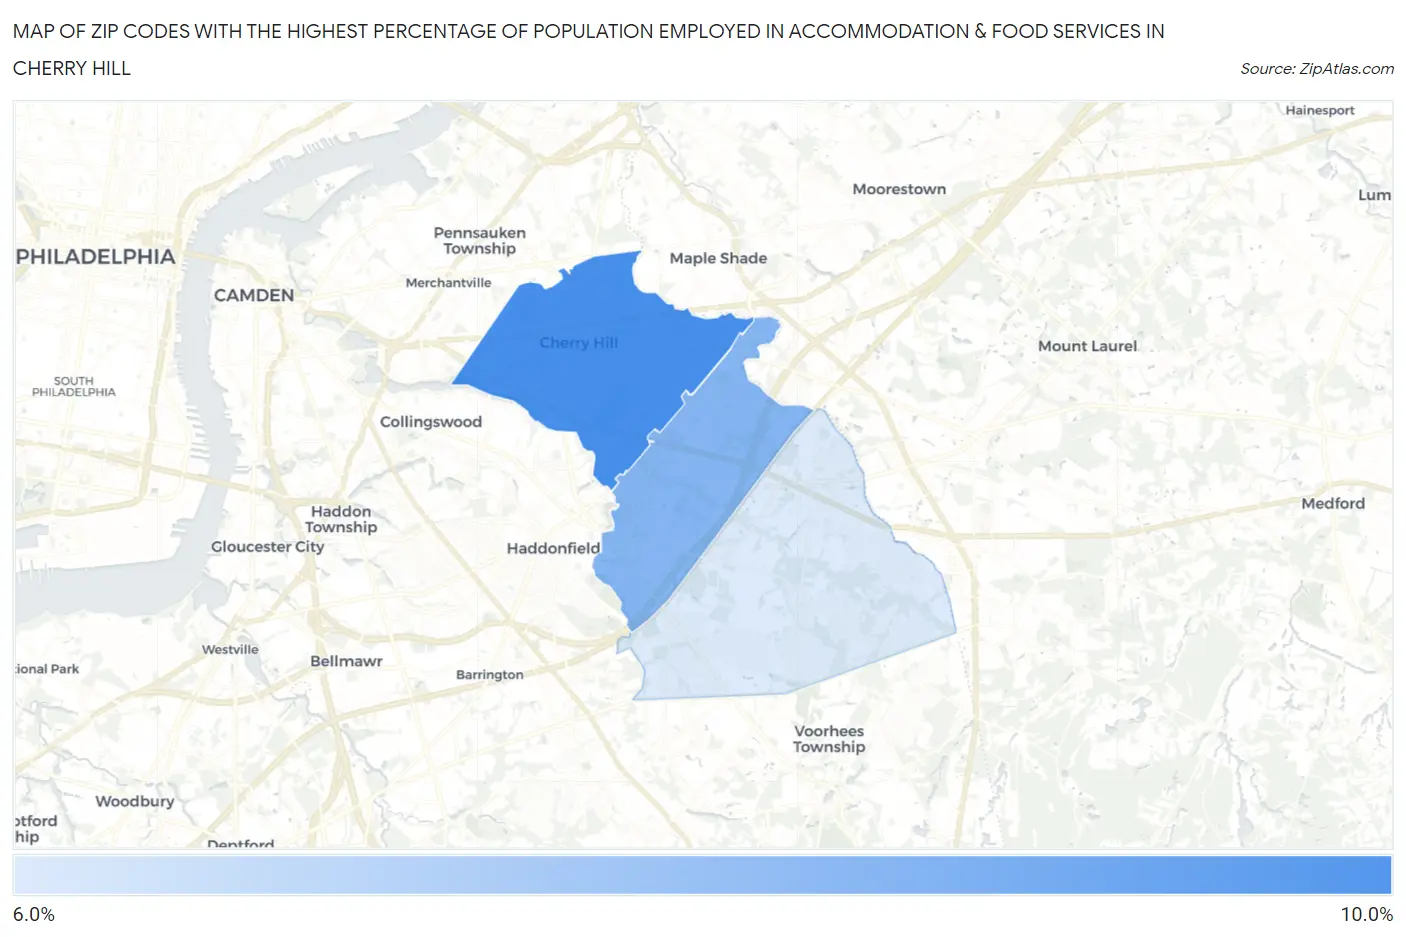
Map of Zip Codes with the Highest Percentage of Population Employed in Accommodation & Food Services in Cherry Hill
6.5%
8.3%
Zip Codes with the Highest Percentage of Population Employed in Accommodation & Food Services in Cherry Hill, NJ
| Zip Code | % Employed | vs State | vs National | |
| 1. | 08002 | 8.3% | 5.3%(+3.03)#67 | 6.9%(+1.43)#7,201 |
| 2. | 08034 | 7.5% | 5.3%(+2.26)#92 | 6.9%(+0.659)#8,891 |
| 3. | 08003 | 6.5% | 5.3%(+1.19)#143 | 6.9%(-0.409)#11,936 |
1
Common Questions
What are the Top Zip Codes with the Highest Percentage of Population Employed in Accommodation & Food Services in Cherry Hill, NJ?
Top Zip Codes with the Highest Percentage of Population Employed in Accommodation & Food Services in Cherry Hill, NJ are:
What zip code has the Highest Percentage of Population Employed in Accommodation & Food Services in Cherry Hill, NJ?
08002 has the Highest Percentage of Population Employed in Accommodation & Food Services in Cherry Hill, NJ with 8.3%.
What is the Percentage of Population Employed in Accommodation & Food Services in New Jersey?
Percentage of Population Employed in Accommodation & Food Services in New Jersey is 5.3%.
What is the Percentage of Population Employed in Accommodation & Food Services in the United States?
Percentage of Population Employed in Accommodation & Food Services in the United States is 6.9%.