Zip Codes with the Highest Percentage of Population Employed in Accommodation & Food Services in Toms River, NJ
RELATED REPORTS & OPTIONS
Accommodation & Food Services
Toms River
Compare Zip Codes
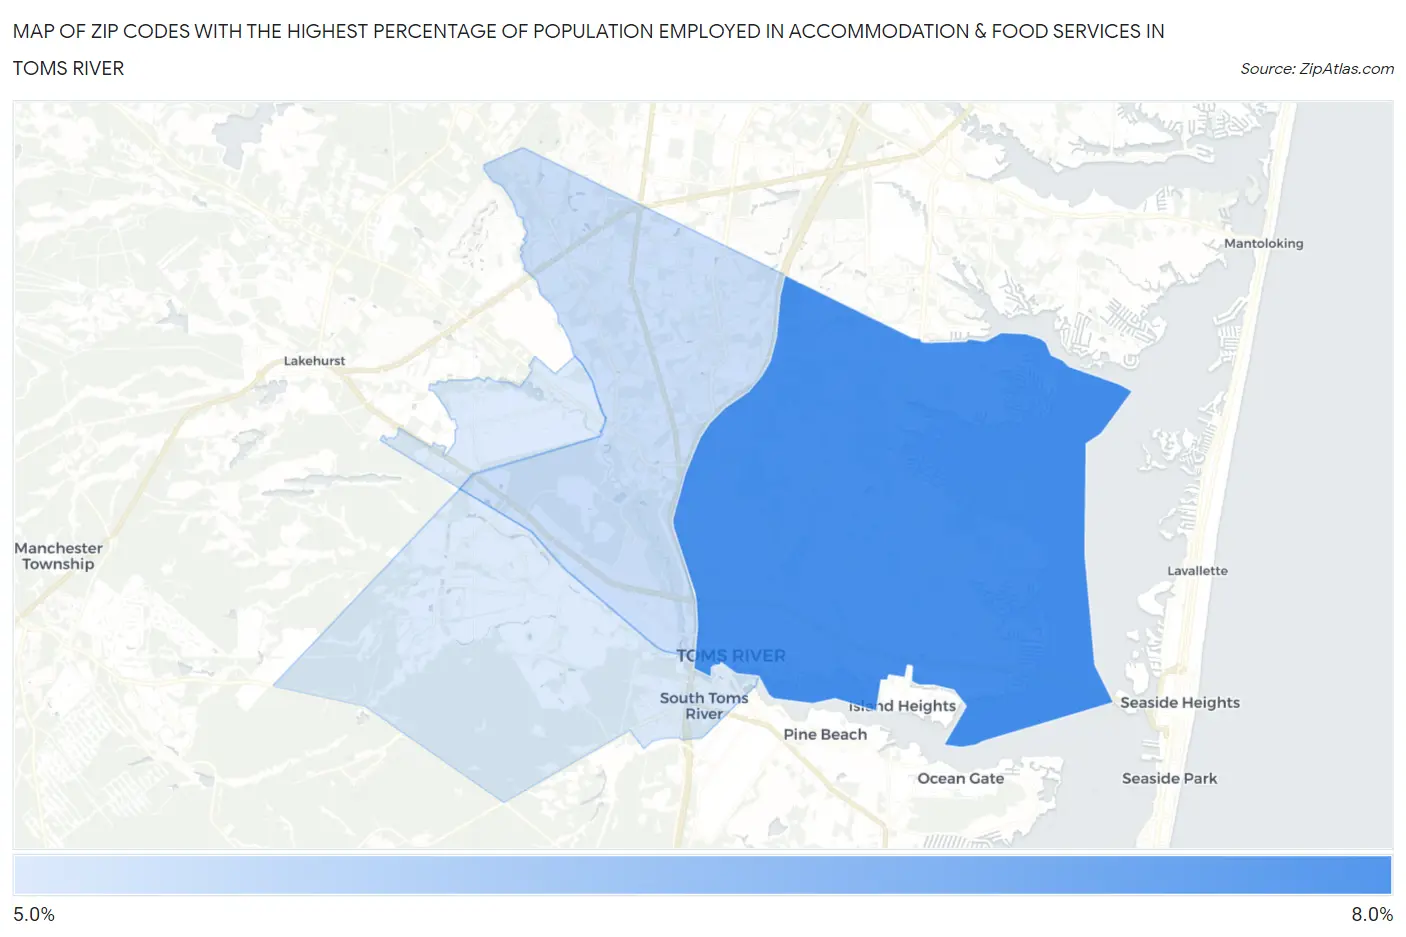
Map of Zip Codes with the Highest Percentage of Population Employed in Accommodation & Food Services in Toms River
5.5%
7.0%
Zip Codes with the Highest Percentage of Population Employed in Accommodation & Food Services in Toms River, NJ
| Zip Code | % Employed | vs State | vs National | |
| 1. | 08753 | 7.0% | 5.3%(+1.70)#119 | 6.9%(+0.100)#10,369 |
| 2. | 08755 | 5.7% | 5.3%(+0.422)#195 | 6.9%(-1.18)#14,399 |
| 3. | 08757 | 5.5% | 5.3%(+0.251)#202 | 6.9%(-1.35)#14,956 |
1
Common Questions
What are the Top Zip Codes with the Highest Percentage of Population Employed in Accommodation & Food Services in Toms River, NJ?
Top Zip Codes with the Highest Percentage of Population Employed in Accommodation & Food Services in Toms River, NJ are:
What zip code has the Highest Percentage of Population Employed in Accommodation & Food Services in Toms River, NJ?
08753 has the Highest Percentage of Population Employed in Accommodation & Food Services in Toms River, NJ with 7.0%.
What is the Percentage of Population Employed in Accommodation & Food Services in Toms River, NJ?
Percentage of Population Employed in Accommodation & Food Services in Toms River is 6.7%.
What is the Percentage of Population Employed in Accommodation & Food Services in New Jersey?
Percentage of Population Employed in Accommodation & Food Services in New Jersey is 5.3%.
What is the Percentage of Population Employed in Accommodation & Food Services in the United States?
Percentage of Population Employed in Accommodation & Food Services in the United States is 6.9%.