Cities with the Most Immigrants from Hong Kong in Ohio
RELATED REPORTS & OPTIONS
Hong Kong
Ohio
Compare Cities
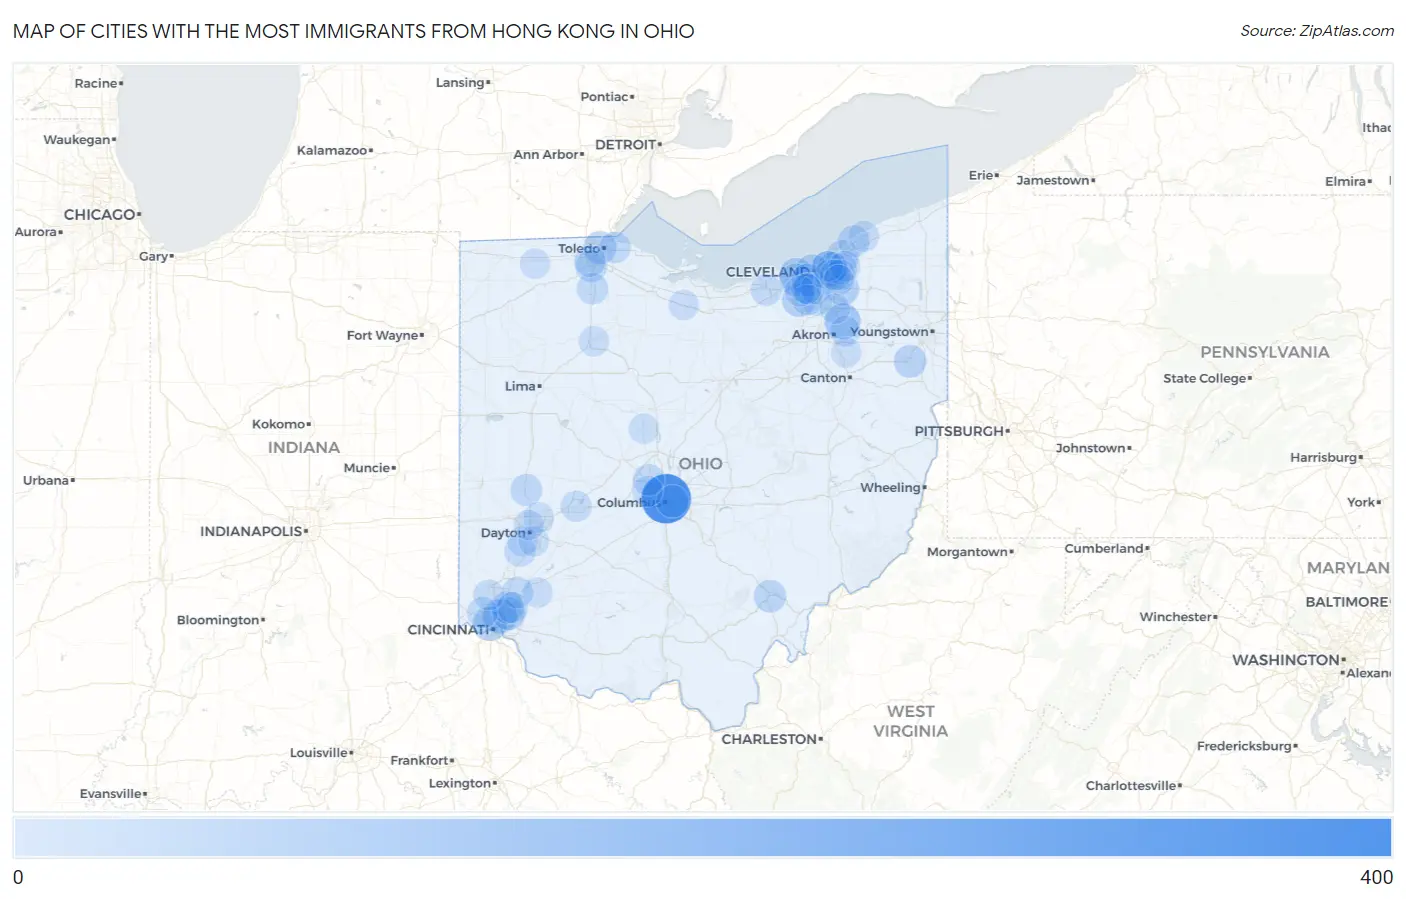
Map of Cities with the Most Immigrants from Hong Kong in Ohio
0
400
Cities with the Most Immigrants from Hong Kong in Ohio
| City | Hong Kong | vs State | vs National | |
| 1. | Columbus | 328 | 2,094(15.66%)#1 | 239,302(0.14%)#98 |
| 2. | Stow | 97 | 2,094(4.63%)#2 | 239,302(0.04%)#303 |
| 3. | Cleveland Heights | 80 | 2,094(3.82%)#3 | 239,302(0.03%)#369 |
| 4. | Golf Manor | 72 | 2,094(3.44%)#4 | 239,302(0.03%)#410 |
| 5. | Cincinnati | 66 | 2,094(3.15%)#5 | 239,302(0.03%)#438 |
| 6. | Rocky River | 64 | 2,094(3.06%)#6 | 239,302(0.03%)#456 |
| 7. | Cleveland | 55 | 2,094(2.63%)#7 | 239,302(0.02%)#515 |
| 8. | Solon | 55 | 2,094(2.63%)#8 | 239,302(0.02%)#521 |
| 9. | Strongsville | 54 | 2,094(2.58%)#9 | 239,302(0.02%)#529 |
| 10. | Kenwood | 47 | 2,094(2.24%)#10 | 239,302(0.02%)#595 |
| 11. | Toledo | 46 | 2,094(2.20%)#11 | 239,302(0.02%)#597 |
| 12. | Fairview Park | 45 | 2,094(2.15%)#12 | 239,302(0.02%)#620 |
| 13. | Salem | 42 | 2,094(2.01%)#13 | 239,302(0.02%)#646 |
| 14. | Brooklyn | 41 | 2,094(1.96%)#14 | 239,302(0.02%)#658 |
| 15. | Bexley | 38 | 2,094(1.81%)#15 | 239,302(0.02%)#698 |
| 16. | Athens | 36 | 2,094(1.72%)#16 | 239,302(0.02%)#728 |
| 17. | Willoughby Hills | 36 | 2,094(1.72%)#17 | 239,302(0.02%)#735 |
| 18. | Blue Ash | 33 | 2,094(1.58%)#18 | 239,302(0.01%)#783 |
| 19. | Troy | 30 | 2,094(1.43%)#19 | 239,302(0.01%)#833 |
| 20. | Mentor | 29 | 2,094(1.38%)#20 | 239,302(0.01%)#850 |
| 21. | Perrysburg | 28 | 2,094(1.34%)#21 | 239,302(0.01%)#871 |
| 22. | Dublin | 26 | 2,094(1.24%)#22 | 239,302(0.01%)#916 |
| 23. | Bowling Green | 24 | 2,094(1.15%)#23 | 239,302(0.01%)#967 |
| 24. | Parma | 23 | 2,094(1.10%)#24 | 239,302(0.01%)#982 |
| 25. | Oregon | 22 | 2,094(1.05%)#25 | 239,302(0.01%)#1,029 |
| 26. | Mason | 21 | 2,094(1.00%)#26 | 239,302(0.01%)#1,049 |
| 27. | Broadview Heights | 21 | 2,094(1.00%)#27 | 239,302(0.01%)#1,053 |
| 28. | Maumee | 21 | 2,094(1.00%)#28 | 239,302(0.01%)#1,055 |
| 29. | Elyria | 20 | 2,094(0.96%)#29 | 239,302(0.01%)#1,071 |
| 30. | Springfield | 18 | 2,094(0.86%)#30 | 239,302(0.01%)#1,135 |
| 31. | Miamisburg | 18 | 2,094(0.86%)#31 | 239,302(0.01%)#1,152 |
| 32. | Seven Hills | 18 | 2,094(0.86%)#32 | 239,302(0.01%)#1,158 |
| 33. | Montgomery | 18 | 2,094(0.86%)#33 | 239,302(0.01%)#1,161 |
| 34. | Shaker Heights | 14 | 2,094(0.67%)#34 | 239,302(0.01%)#1,314 |
| 35. | White Oak | 14 | 2,094(0.67%)#35 | 239,302(0.01%)#1,325 |
| 36. | Mayfield Heights | 13 | 2,094(0.62%)#36 | 239,302(0.01%)#1,374 |
| 37. | North Royalton | 12 | 2,094(0.57%)#37 | 239,302(0.01%)#1,415 |
| 38. | Tallmadge | 12 | 2,094(0.57%)#38 | 239,302(0.01%)#1,424 |
| 39. | Fairfield | 11 | 2,094(0.53%)#39 | 239,302(0.00%)#1,463 |
| 40. | Hilliard | 11 | 2,094(0.53%)#40 | 239,302(0.00%)#1,469 |
| 41. | South Euclid | 10 | 2,094(0.48%)#41 | 239,302(0.00%)#1,543 |
| 42. | Painesville | 10 | 2,094(0.48%)#42 | 239,302(0.00%)#1,544 |
| 43. | Pepper Pike | 10 | 2,094(0.48%)#43 | 239,302(0.00%)#1,568 |
| 44. | Gates Mills | 10 | 2,094(0.48%)#44 | 239,302(0.00%)#1,574 |
| 45. | East Cleveland | 9 | 2,094(0.43%)#45 | 239,302(0.00%)#1,618 |
| 46. | Beachwood | 9 | 2,094(0.43%)#46 | 239,302(0.00%)#1,620 |
| 47. | Huber Heights | 8 | 2,094(0.38%)#47 | 239,302(0.00%)#1,658 |
| 48. | Findlay | 8 | 2,094(0.38%)#48 | 239,302(0.00%)#1,660 |
| 49. | Middleburg Heights | 7 | 2,094(0.33%)#49 | 239,302(0.00%)#1,739 |
| 50. | Uniontown | 7 | 2,094(0.33%)#50 | 239,302(0.00%)#1,752 |
| 51. | Moraine | 7 | 2,094(0.33%)#51 | 239,302(0.00%)#1,753 |
| 52. | Kettering | 6 | 2,094(0.29%)#52 | 239,302(0.00%)#1,785 |
| 53. | Parma Heights | 6 | 2,094(0.29%)#53 | 239,302(0.00%)#1,807 |
| 54. | Orange | 6 | 2,094(0.29%)#54 | 239,302(0.00%)#1,832 |
| 55. | Bellevue | 5 | 2,094(0.24%)#55 | 239,302(0.00%)#1,874 |
| 56. | Dayton | 4 | 2,094(0.19%)#56 | 239,302(0.00%)#1,896 |
| 57. | Wauseon | 3 | 2,094(0.14%)#57 | 239,302(0.00%)#1,946 |
| 58. | Morrow | 3 | 2,094(0.14%)#58 | 239,302(0.00%)#1,954 |
| 59. | Prospect | 3 | 2,094(0.14%)#59 | 239,302(0.00%)#1,961 |
| 60. | Boston Heights | 2 | 2,094(0.10%)#60 | 239,302(0.00%)#1,990 |
Common Questions
What are the Top 10 Cities with the Most Immigrants from Hong Kong in Ohio?
Top 10 Cities with the Most Immigrants from Hong Kong in Ohio are:
#1
328
#2
97
#3
80
#4
72
#5
66
#6
64
#7
55
#8
55
#9
54
#10
47
What city has the Most Immigrants from Hong Kong in Ohio?
Columbus has the Most Immigrants from Hong Kong in Ohio with 328.
What is the Total Immigrants from Hong Kong in the State of Ohio?
Total Immigrants from Hong Kong in Ohio is 2,094.
What is the Total Immigrants from Hong Kong in the United States?
Total Immigrants from Hong Kong in the United States is 239,302.