Cities with the Most Immigrants from Dominican Republic in Georgia
RELATED REPORTS & OPTIONS
Dominican Republic
Georgia
Compare Cities
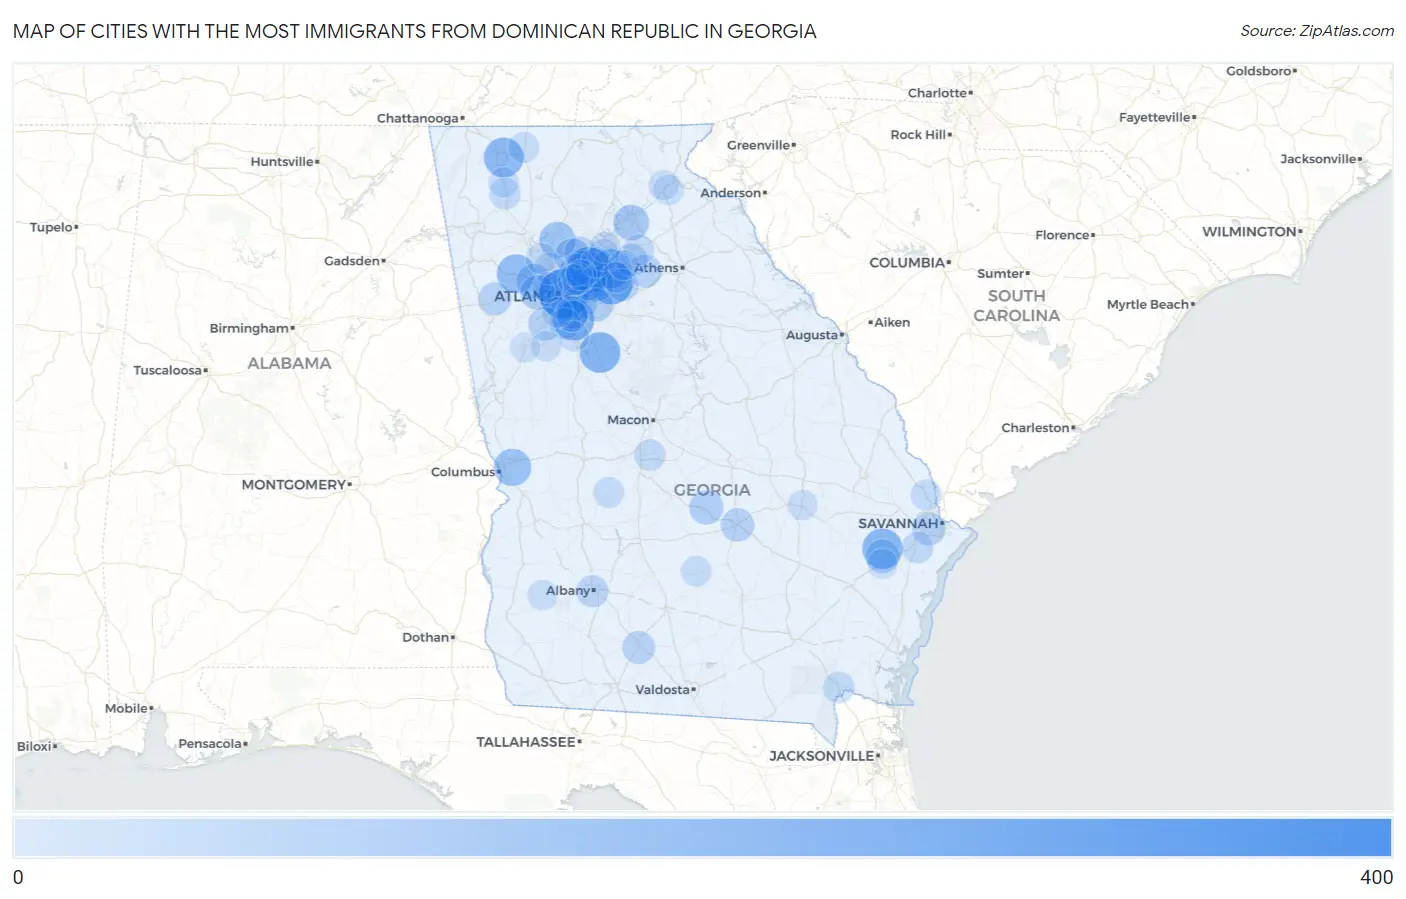
Map of Cities with the Most Immigrants from Dominican Republic in Georgia
0
400
Cities with the Most Immigrants from Dominican Republic in Georgia
| City | Dominican Republic | vs State | vs National | |
| 1. | Atlanta | 398 | 11,847(3.36%)#1 | 1,223,316(0.03%)#258 |
| 2. | Norcross | 316 | 11,847(2.67%)#2 | 1,223,316(0.03%)#309 |
| 3. | Snellville | 273 | 11,847(2.30%)#3 | 1,223,316(0.02%)#360 |
| 4. | Morrow | 219 | 11,847(1.85%)#4 | 1,223,316(0.02%)#422 |
| 5. | Locust Grove | 214 | 11,847(1.81%)#5 | 1,223,316(0.02%)#426 |
| 6. | Fort Stewart | 205 | 11,847(1.73%)#6 | 1,223,316(0.02%)#444 |
| 7. | Dalton | 194 | 11,847(1.64%)#7 | 1,223,316(0.02%)#465 |
| 8. | Augusta-Richmond County Consolidated Government (Balance) | 188 | 11,847(1.59%)#8 | 1,223,316(0.02%)#472 |
| 9. | Lawrenceville | 185 | 11,847(1.56%)#9 | 1,223,316(0.02%)#481 |
| 10. | Dallas | 174 | 11,847(1.47%)#10 | 1,223,316(0.01%)#508 |
| 11. | Columbus | 145 | 11,847(1.22%)#11 | 1,223,316(0.01%)#578 |
| 12. | Holly Springs | 123 | 11,847(1.04%)#12 | 1,223,316(0.01%)#653 |
| 13. | Roswell | 108 | 11,847(0.91%)#13 | 1,223,316(0.01%)#703 |
| 14. | Gainesville | 108 | 11,847(0.91%)#14 | 1,223,316(0.01%)#704 |
| 15. | Tucker | 104 | 11,847(0.88%)#15 | 1,223,316(0.01%)#713 |
| 16. | Mountain Park | 97 | 11,847(0.82%)#16 | 1,223,316(0.01%)#753 |
| 17. | Powder Springs | 93 | 11,847(0.79%)#17 | 1,223,316(0.01%)#780 |
| 18. | Athens-Clarke County Unified Government (Balance) | 90 | 11,847(0.76%)#18 | 1,223,316(0.01%)#794 |
| 19. | Peachtree Corners | 90 | 11,847(0.76%)#19 | 1,223,316(0.01%)#797 |
| 20. | Lithia Springs | 88 | 11,847(0.74%)#20 | 1,223,316(0.01%)#810 |
| 21. | Panthersville | 78 | 11,847(0.66%)#21 | 1,223,316(0.01%)#886 |
| 22. | Eastman | 77 | 11,847(0.65%)#22 | 1,223,316(0.01%)#897 |
| 23. | Hinesville | 72 | 11,847(0.61%)#23 | 1,223,316(0.01%)#941 |
| 24. | Stonecrest | 70 | 11,847(0.59%)#24 | 1,223,316(0.01%)#956 |
| 25. | Fairburn | 69 | 11,847(0.58%)#25 | 1,223,316(0.01%)#973 |
| 26. | Mcrae Helena | 66 | 11,847(0.56%)#26 | 1,223,316(0.01%)#998 |
| 27. | Savannah | 63 | 11,847(0.53%)#27 | 1,223,316(0.01%)#1,012 |
| 28. | Bethlehem | 62 | 11,847(0.52%)#28 | 1,223,316(0.01%)#1,037 |
| 29. | Temple | 58 | 11,847(0.49%)#29 | 1,223,316(0.00%)#1,072 |
| 30. | Forest Park | 55 | 11,847(0.46%)#30 | 1,223,316(0.00%)#1,092 |
| 31. | Moultrie | 54 | 11,847(0.46%)#31 | 1,223,316(0.00%)#1,102 |
| 32. | Auburn | 53 | 11,847(0.45%)#32 | 1,223,316(0.00%)#1,120 |
| 33. | Conley | 51 | 11,847(0.43%)#33 | 1,223,316(0.00%)#1,142 |
| 34. | Loganville | 47 | 11,847(0.40%)#34 | 1,223,316(0.00%)#1,186 |
| 35. | Dunwoody | 46 | 11,847(0.39%)#35 | 1,223,316(0.00%)#1,197 |
| 36. | Albany | 42 | 11,847(0.35%)#36 | 1,223,316(0.00%)#1,249 |
| 37. | Alpharetta | 38 | 11,847(0.32%)#37 | 1,223,316(0.00%)#1,318 |
| 38. | Chamblee | 35 | 11,847(0.30%)#38 | 1,223,316(0.00%)#1,380 |
| 39. | Marietta | 32 | 11,847(0.27%)#39 | 1,223,316(0.00%)#1,449 |
| 40. | Suwanee | 31 | 11,847(0.26%)#40 | 1,223,316(0.00%)#1,475 |
| 41. | Richmond Hill | 31 | 11,847(0.26%)#41 | 1,223,316(0.00%)#1,477 |
| 42. | Calhoun | 28 | 11,847(0.24%)#42 | 1,223,316(0.00%)#1,545 |
| 43. | Folkston | 28 | 11,847(0.24%)#43 | 1,223,316(0.00%)#1,556 |
| 44. | Riverdale | 27 | 11,847(0.23%)#44 | 1,223,316(0.00%)#1,573 |
| 45. | Warner Robins | 26 | 11,847(0.22%)#45 | 1,223,316(0.00%)#1,595 |
| 46. | Brookhaven | 25 | 11,847(0.21%)#46 | 1,223,316(0.00%)#1,625 |
| 47. | Cusseta Chattahoochee County Unified Government | 25 | 11,847(0.21%)#47 | 1,223,316(0.00%)#1,642 |
| 48. | Rincon | 22 | 11,847(0.19%)#48 | 1,223,316(0.00%)#1,719 |
| 49. | Lake City | 22 | 11,847(0.19%)#49 | 1,223,316(0.00%)#1,732 |
| 50. | Montezuma | 18 | 11,847(0.15%)#50 | 1,223,316(0.00%)#1,876 |
| 51. | Kennesaw | 17 | 11,847(0.14%)#51 | 1,223,316(0.00%)#1,891 |
| 52. | Hoschton | 17 | 11,847(0.14%)#52 | 1,223,316(0.00%)#1,916 |
| 53. | Eton | 14 | 11,847(0.12%)#53 | 1,223,316(0.00%)#2,060 |
| 54. | Sugar Hill | 13 | 11,847(0.11%)#54 | 1,223,316(0.00%)#2,073 |
| 55. | Fitzgerald | 13 | 11,847(0.11%)#55 | 1,223,316(0.00%)#2,082 |
| 56. | Peachtree City | 9 | 11,847(0.08%)#56 | 1,223,316(0.00%)#2,267 |
| 57. | Duluth | 9 | 11,847(0.08%)#57 | 1,223,316(0.00%)#2,271 |
| 58. | Doraville | 9 | 11,847(0.08%)#58 | 1,223,316(0.00%)#2,282 |
| 59. | Grayson | 9 | 11,847(0.08%)#59 | 1,223,316(0.00%)#2,293 |
| 60. | Mount Airy | 9 | 11,847(0.08%)#60 | 1,223,316(0.00%)#2,310 |
| 61. | Bonanza | 8 | 11,847(0.07%)#61 | 1,223,316(0.00%)#2,349 |
| 62. | College Park | 7 | 11,847(0.06%)#62 | 1,223,316(0.00%)#2,389 |
| 63. | Morgan | 6 | 11,847(0.05%)#63 | 1,223,316(0.00%)#2,481 |
| 64. | Mableton | 5 | 11,847(0.04%)#64 | 1,223,316(0.00%)#2,503 |
| 65. | Lyons | 5 | 11,847(0.04%)#65 | 1,223,316(0.00%)#2,528 |
| 66. | Demorest | 4 | 11,847(0.03%)#66 | 1,223,316(0.00%)#2,595 |
| 67. | Resaca | 4 | 11,847(0.03%)#67 | 1,223,316(0.00%)#2,602 |
| 68. | Walthourville | 3 | 11,847(0.03%)#68 | 1,223,316(0.00%)#2,627 |
| 69. | Dacula | 2 | 11,847(0.02%)#69 | 1,223,316(0.00%)#2,676 |
| 70. | Newnan | 1 | 11,847(0.01%)#70 | 1,223,316(0.00%)#2,713 |
Common Questions
What are the Top 10 Cities with the Most Immigrants from Dominican Republic in Georgia?
Top 10 Cities with the Most Immigrants from Dominican Republic in Georgia are:
#1
398
#2
316
#3
273
#4
219
#5
214
#6
205
#7
194
#8
185
#9
174
#10
145
What city has the Most Immigrants from Dominican Republic in Georgia?
Atlanta has the Most Immigrants from Dominican Republic in Georgia with 398.
What is the Total Immigrants from Dominican Republic in the State of Georgia?
Total Immigrants from Dominican Republic in Georgia is 11,847.
What is the Total Immigrants from Dominican Republic in the United States?
Total Immigrants from Dominican Republic in the United States is 1,223,316.