Cities with the Most Immigrants from Dominican Republic in Pennsylvania
RELATED REPORTS & OPTIONS
Dominican Republic
Pennsylvania
Compare Cities
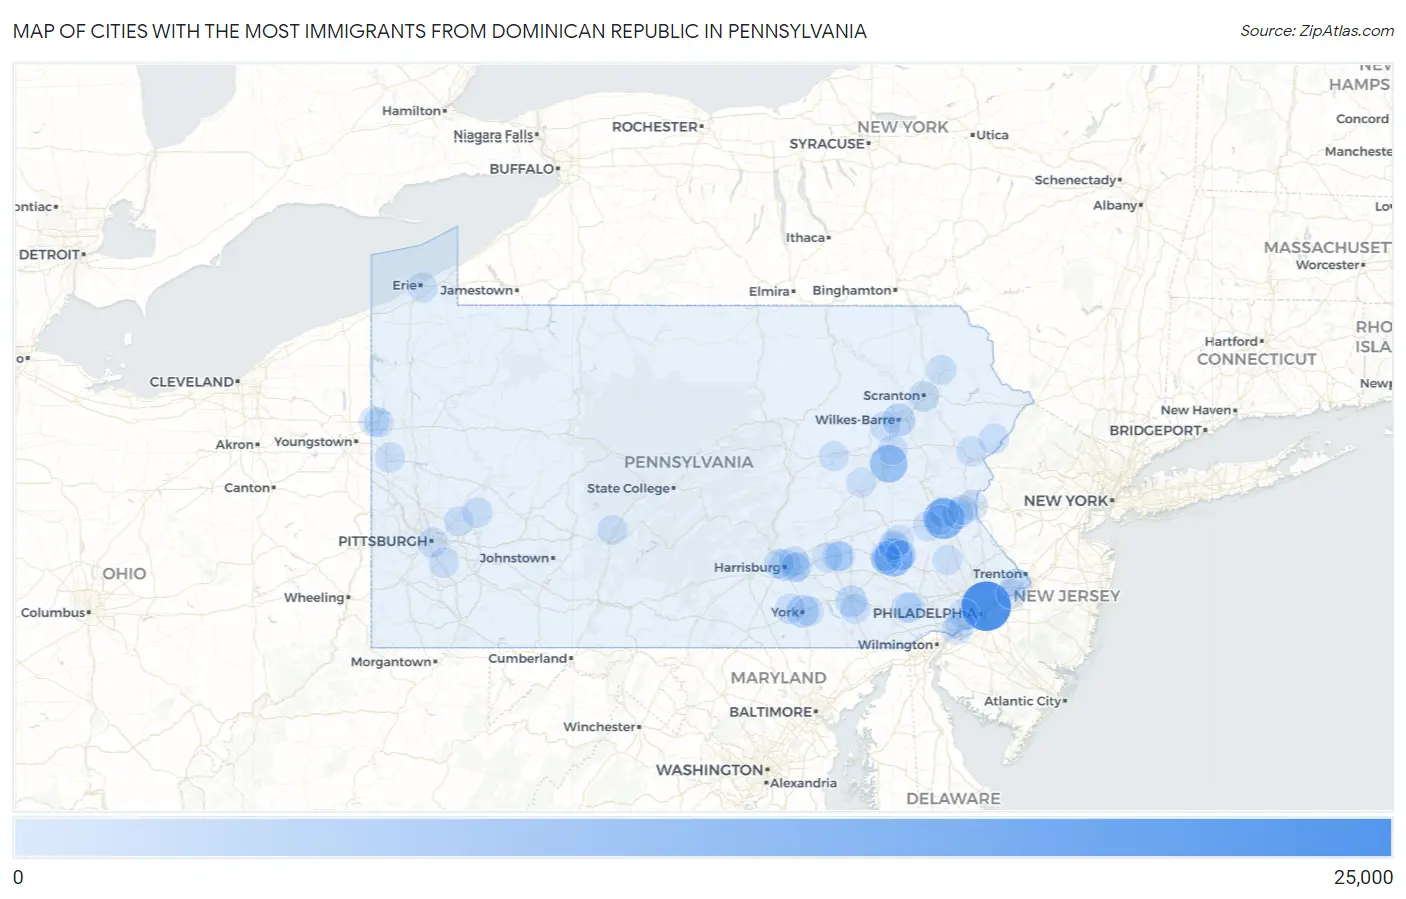
Map of Cities with the Most Immigrants from Dominican Republic in Pennsylvania
0
25,000
Cities with the Most Immigrants from Dominican Republic in Pennsylvania
| City | Dominican Republic | vs State | vs National | |
| 1. | Philadelphia | 22,822 | 86,544(26.37%)#1 | 1,223,316(1.87%)#6 |
| 2. | Allentown | 12,311 | 86,544(14.23%)#2 | 1,223,316(1.01%)#10 |
| 3. | Reading | 9,099 | 86,544(10.51%)#3 | 1,223,316(0.74%)#14 |
| 4. | Hazleton | 8,475 | 86,544(9.79%)#4 | 1,223,316(0.69%)#16 |
| 5. | Wilkes Barre | 2,931 | 86,544(3.39%)#5 | 1,223,316(0.24%)#35 |
| 6. | York | 2,670 | 86,544(3.09%)#6 | 1,223,316(0.22%)#40 |
| 7. | Lancaster | 1,722 | 86,544(1.99%)#7 | 1,223,316(0.14%)#65 |
| 8. | Harrisburg | 1,411 | 86,544(1.63%)#8 | 1,223,316(0.12%)#80 |
| 9. | Bethlehem | 1,289 | 86,544(1.49%)#9 | 1,223,316(0.11%)#85 |
| 10. | West Hazleton Borough | 1,260 | 86,544(1.46%)#10 | 1,223,316(0.10%)#89 |
| 11. | Lebanon | 997 | 86,544(1.15%)#11 | 1,223,316(0.08%)#111 |
| 12. | Fullerton | 834 | 86,544(0.96%)#12 | 1,223,316(0.07%)#127 |
| 13. | Scranton | 806 | 86,544(0.93%)#13 | 1,223,316(0.07%)#132 |
| 14. | Easton | 753 | 86,544(0.87%)#14 | 1,223,316(0.06%)#142 |
| 15. | Hyde Park | 387 | 86,544(0.45%)#15 | 1,223,316(0.03%)#263 |
| 16. | Laureldale Borough | 358 | 86,544(0.41%)#16 | 1,223,316(0.03%)#282 |
| 17. | Saw Creek | 355 | 86,544(0.41%)#17 | 1,223,316(0.03%)#286 |
| 18. | Mcadoo Borough | 341 | 86,544(0.39%)#18 | 1,223,316(0.03%)#291 |
| 19. | West York Borough | 313 | 86,544(0.36%)#19 | 1,223,316(0.03%)#314 |
| 20. | Pittsburgh | 311 | 86,544(0.36%)#20 | 1,223,316(0.03%)#316 |
| 21. | Norristown Borough | 277 | 86,544(0.32%)#21 | 1,223,316(0.02%)#353 |
| 22. | Pennside | 253 | 86,544(0.29%)#22 | 1,223,316(0.02%)#378 |
| 23. | Levittown | 251 | 86,544(0.29%)#23 | 1,223,316(0.02%)#380 |
| 24. | Fountain Hill Borough | 245 | 86,544(0.28%)#24 | 1,223,316(0.02%)#389 |
| 25. | Freeland Borough | 218 | 86,544(0.25%)#25 | 1,223,316(0.02%)#424 |
| 26. | West Wyomissing | 213 | 86,544(0.25%)#26 | 1,223,316(0.02%)#429 |
| 27. | Colonial Park | 206 | 86,544(0.24%)#27 | 1,223,316(0.02%)#440 |
| 28. | Milton Borough | 192 | 86,544(0.22%)#28 | 1,223,316(0.02%)#469 |
| 29. | Columbia Borough | 182 | 86,544(0.21%)#29 | 1,223,316(0.01%)#488 |
| 30. | Mount Joy Borough | 182 | 86,544(0.21%)#30 | 1,223,316(0.01%)#489 |
| 31. | Clairton | 148 | 86,544(0.17%)#31 | 1,223,316(0.01%)#576 |
| 32. | Mount Pocono Borough | 141 | 86,544(0.16%)#32 | 1,223,316(0.01%)#595 |
| 33. | Croydon | 138 | 86,544(0.16%)#33 | 1,223,316(0.01%)#601 |
| 34. | Erie | 132 | 86,544(0.15%)#34 | 1,223,316(0.01%)#622 |
| 35. | Dunmore Borough | 130 | 86,544(0.15%)#35 | 1,223,316(0.01%)#633 |
| 36. | Edwardsville Borough | 124 | 86,544(0.14%)#36 | 1,223,316(0.01%)#652 |
| 37. | Chambersburg Borough | 120 | 86,544(0.14%)#37 | 1,223,316(0.01%)#660 |
| 38. | Lincoln Park | 120 | 86,544(0.14%)#38 | 1,223,316(0.01%)#663 |
| 39. | Plymouth Borough | 116 | 86,544(0.13%)#39 | 1,223,316(0.01%)#678 |
| 40. | Nazareth Borough | 110 | 86,544(0.13%)#40 | 1,223,316(0.01%)#699 |
| 41. | Mahanoy City Borough | 103 | 86,544(0.12%)#41 | 1,223,316(0.01%)#724 |
| 42. | South Temple | 102 | 86,544(0.12%)#42 | 1,223,316(0.01%)#728 |
| 43. | Kutztown Borough | 101 | 86,544(0.12%)#43 | 1,223,316(0.01%)#733 |
| 44. | Temple | 98 | 86,544(0.11%)#44 | 1,223,316(0.01%)#746 |
| 45. | Shenandoah Borough | 97 | 86,544(0.11%)#45 | 1,223,316(0.01%)#754 |
| 46. | Penn Estates | 97 | 86,544(0.11%)#46 | 1,223,316(0.01%)#755 |
| 47. | Nanticoke | 95 | 86,544(0.11%)#47 | 1,223,316(0.01%)#768 |
| 48. | East York | 90 | 86,544(0.10%)#48 | 1,223,316(0.01%)#799 |
| 49. | Wilson Borough | 89 | 86,544(0.10%)#49 | 1,223,316(0.01%)#805 |
| 50. | Wyomissing Borough | 87 | 86,544(0.10%)#50 | 1,223,316(0.01%)#819 |
| 51. | Shenandoah Heights | 86 | 86,544(0.10%)#51 | 1,223,316(0.01%)#832 |
| 52. | Breinigsville | 83 | 86,544(0.10%)#52 | 1,223,316(0.01%)#849 |
| 53. | Freemansburg Borough | 83 | 86,544(0.10%)#53 | 1,223,316(0.01%)#851 |
| 54. | Blandon | 81 | 86,544(0.09%)#54 | 1,223,316(0.01%)#863 |
| 55. | Beech Mountain Lakes | 81 | 86,544(0.09%)#55 | 1,223,316(0.01%)#864 |
| 56. | Chester | 77 | 86,544(0.09%)#56 | 1,223,316(0.01%)#892 |
| 57. | Dorneyville | 77 | 86,544(0.09%)#57 | 1,223,316(0.01%)#898 |
| 58. | Middletown | 74 | 86,544(0.09%)#58 | 1,223,316(0.01%)#929 |
| 59. | Denver Borough | 73 | 86,544(0.08%)#59 | 1,223,316(0.01%)#938 |
| 60. | Coatesville | 69 | 86,544(0.08%)#60 | 1,223,316(0.01%)#975 |
| 61. | Stony Creek Mills | 69 | 86,544(0.08%)#61 | 1,223,316(0.01%)#977 |
| 62. | Souderton Borough | 67 | 86,544(0.08%)#62 | 1,223,316(0.01%)#989 |
| 63. | Rutherford | 67 | 86,544(0.08%)#63 | 1,223,316(0.01%)#990 |
| 64. | Willow Street | 63 | 86,544(0.07%)#64 | 1,223,316(0.01%)#1,017 |
| 65. | Catasauqua Borough | 63 | 86,544(0.07%)#65 | 1,223,316(0.01%)#1,021 |
| 66. | Forty Fort Borough | 63 | 86,544(0.07%)#66 | 1,223,316(0.01%)#1,023 |
| 67. | Sharon | 62 | 86,544(0.07%)#67 | 1,223,316(0.01%)#1,031 |
| 68. | Kenhorst Borough | 58 | 86,544(0.07%)#68 | 1,223,316(0.00%)#1,074 |
| 69. | Lititz Borough | 57 | 86,544(0.07%)#69 | 1,223,316(0.00%)#1,081 |
| 70. | Beaver Meadows Borough | 57 | 86,544(0.07%)#70 | 1,223,316(0.00%)#1,085 |
| 71. | Fleetwood Borough | 56 | 86,544(0.06%)#71 | 1,223,316(0.00%)#1,089 |
| 72. | South Greensburg Borough | 54 | 86,544(0.06%)#72 | 1,223,316(0.00%)#1,107 |
| 73. | Altoona | 53 | 86,544(0.06%)#73 | 1,223,316(0.00%)#1,113 |
| 74. | Bloomsburg | 52 | 86,544(0.06%)#74 | 1,223,316(0.00%)#1,127 |
| 75. | New Cumberland Borough | 52 | 86,544(0.06%)#75 | 1,223,316(0.00%)#1,130 |
| 76. | Hanover Borough | 51 | 86,544(0.06%)#76 | 1,223,316(0.00%)#1,139 |
| 77. | Mount Carmel Borough | 51 | 86,544(0.06%)#77 | 1,223,316(0.00%)#1,143 |
| 78. | Roslyn | 50 | 86,544(0.06%)#78 | 1,223,316(0.00%)#1,153 |
| 79. | Caln | 49 | 86,544(0.06%)#79 | 1,223,316(0.00%)#1,167 |
| 80. | Palmyra Borough | 46 | 86,544(0.05%)#80 | 1,223,316(0.00%)#1,204 |
| 81. | Annville | 46 | 86,544(0.05%)#81 | 1,223,316(0.00%)#1,207 |
| 82. | Hebron | 46 | 86,544(0.05%)#82 | 1,223,316(0.00%)#1,211 |
| 83. | New Kensington | 44 | 86,544(0.05%)#83 | 1,223,316(0.00%)#1,230 |
| 84. | Hermitage | 43 | 86,544(0.05%)#84 | 1,223,316(0.00%)#1,241 |
| 85. | Drexel Hill | 42 | 86,544(0.05%)#85 | 1,223,316(0.00%)#1,252 |
| 86. | New Castle | 42 | 86,544(0.05%)#86 | 1,223,316(0.00%)#1,253 |
| 87. | Marietta Borough | 41 | 86,544(0.05%)#87 | 1,223,316(0.00%)#1,279 |
| 88. | Mifflintown Borough | 41 | 86,544(0.05%)#88 | 1,223,316(0.00%)#1,280 |
| 89. | Whitfield | 40 | 86,544(0.05%)#89 | 1,223,316(0.00%)#1,291 |
| 90. | Woodlyn | 38 | 86,544(0.04%)#90 | 1,223,316(0.00%)#1,332 |
| 91. | Moosic Borough | 38 | 86,544(0.04%)#91 | 1,223,316(0.00%)#1,337 |
| 92. | Woxall | 38 | 86,544(0.04%)#92 | 1,223,316(0.00%)#1,339 |
| 93. | Northampton Borough | 37 | 86,544(0.04%)#93 | 1,223,316(0.00%)#1,350 |
| 94. | Lawnton | 35 | 86,544(0.04%)#94 | 1,223,316(0.00%)#1,392 |
| 95. | Weigelstown | 34 | 86,544(0.04%)#95 | 1,223,316(0.00%)#1,411 |
| 96. | Carbondale | 33 | 86,544(0.04%)#96 | 1,223,316(0.00%)#1,435 |
| 97. | Enola | 33 | 86,544(0.04%)#97 | 1,223,316(0.00%)#1,439 |
| 98. | Taylor Borough | 32 | 86,544(0.04%)#98 | 1,223,316(0.00%)#1,463 |
| 99. | Ashley Borough | 32 | 86,544(0.04%)#99 | 1,223,316(0.00%)#1,468 |
| 100. | Alburtis Borough | 32 | 86,544(0.04%)#100 | 1,223,316(0.00%)#1,469 |
Common Questions
What are the Top 10 Cities with the Most Immigrants from Dominican Republic in Pennsylvania?
Top 10 Cities with the Most Immigrants from Dominican Republic in Pennsylvania are:
#1
22,822
#2
12,311
#3
9,099
#4
8,475
#5
2,931
#6
2,670
#7
1,722
#8
1,411
#9
1,289
#10
997
What city has the Most Immigrants from Dominican Republic in Pennsylvania?
Philadelphia has the Most Immigrants from Dominican Republic in Pennsylvania with 22,822.
What is the Total Immigrants from Dominican Republic in the State of Pennsylvania?
Total Immigrants from Dominican Republic in Pennsylvania is 86,544.
What is the Total Immigrants from Dominican Republic in the United States?
Total Immigrants from Dominican Republic in the United States is 1,223,316.