Cities with the Most Immigrants from Dominican Republic in Virginia
RELATED REPORTS & OPTIONS
Dominican Republic
Virginia
Compare Cities
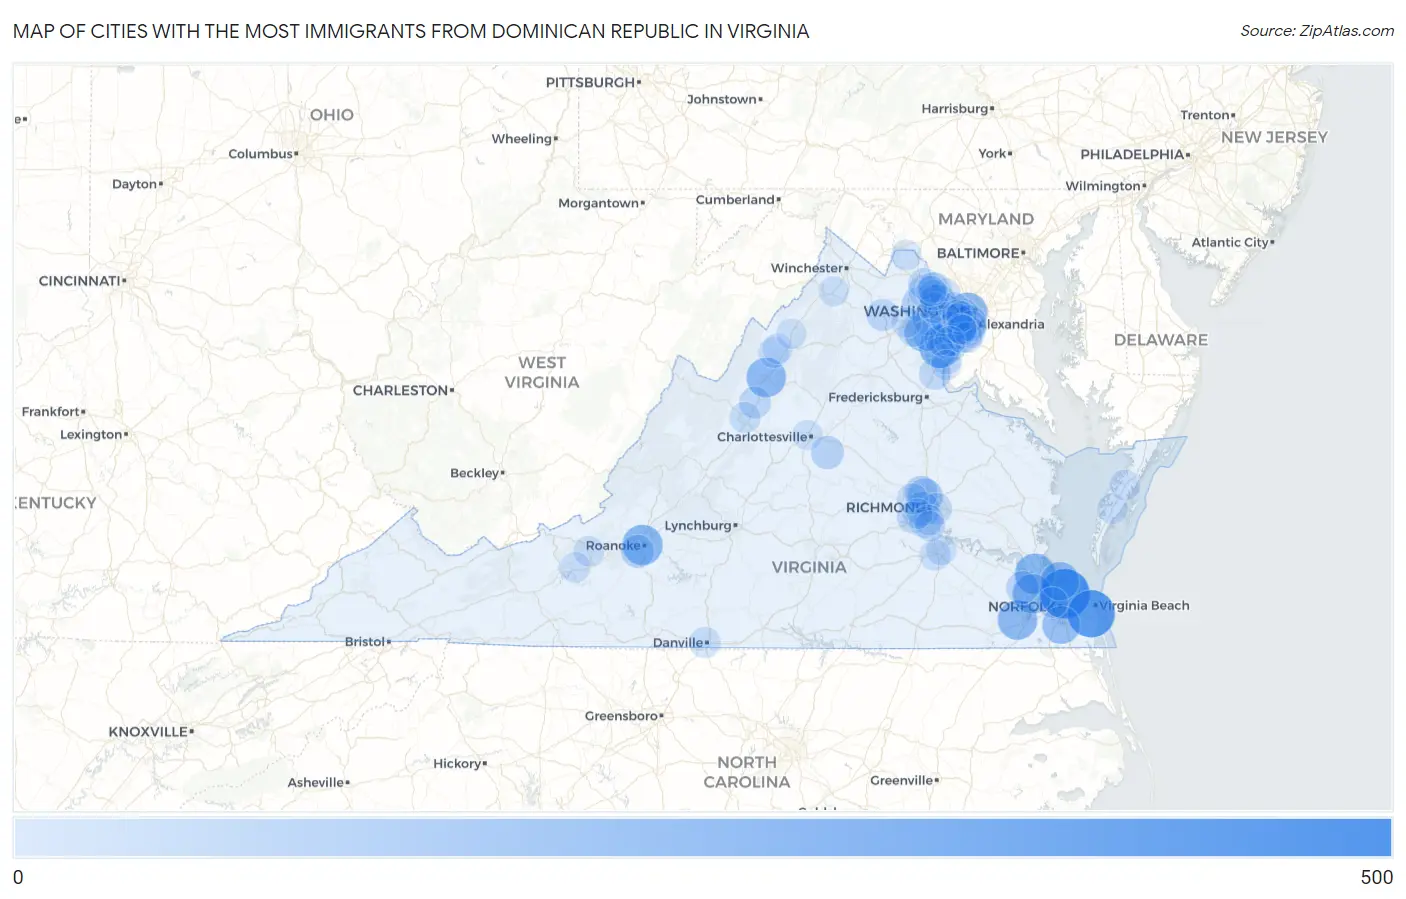
Map of Cities with the Most Immigrants from Dominican Republic in Virginia
0
500
Cities with the Most Immigrants from Dominican Republic in Virginia
| City | Dominican Republic | vs State | vs National | |
| 1. | Norfolk | 499 | 6,698(7.45%)#1 | 1,223,316(0.04%)#215 |
| 2. | Virginia Beach | 440 | 6,698(6.57%)#2 | 1,223,316(0.04%)#241 |
| 3. | Dale City | 277 | 6,698(4.14%)#3 | 1,223,316(0.02%)#352 |
| 4. | Newport News | 258 | 6,698(3.85%)#4 | 1,223,316(0.02%)#370 |
| 5. | Roanoke | 257 | 6,698(3.84%)#5 | 1,223,316(0.02%)#373 |
| 6. | Arlington | 251 | 6,698(3.75%)#6 | 1,223,316(0.02%)#379 |
| 7. | Suffolk | 240 | 6,698(3.58%)#7 | 1,223,316(0.02%)#394 |
| 8. | Harrisonburg | 236 | 6,698(3.52%)#8 | 1,223,316(0.02%)#399 |
| 9. | Carrollton | 235 | 6,698(3.51%)#9 | 1,223,316(0.02%)#401 |
| 10. | Hampton | 212 | 6,698(3.17%)#10 | 1,223,316(0.02%)#430 |
| 11. | Manassas | 211 | 6,698(3.15%)#11 | 1,223,316(0.02%)#433 |
| 12. | Chesapeake | 197 | 6,698(2.94%)#12 | 1,223,316(0.02%)#457 |
| 13. | Woodlawn Cdp Fairfax County | 196 | 6,698(2.93%)#13 | 1,223,316(0.02%)#460 |
| 14. | Lakeside | 135 | 6,698(2.02%)#14 | 1,223,316(0.01%)#610 |
| 15. | Reston | 131 | 6,698(1.96%)#15 | 1,223,316(0.01%)#626 |
| 16. | Alexandria | 129 | 6,698(1.93%)#16 | 1,223,316(0.01%)#634 |
| 17. | Richmond | 92 | 6,698(1.37%)#17 | 1,223,316(0.01%)#781 |
| 18. | Arcola | 88 | 6,698(1.31%)#18 | 1,223,316(0.01%)#813 |
| 19. | Lake Ridge | 79 | 6,698(1.18%)#19 | 1,223,316(0.01%)#870 |
| 20. | Laurel | 79 | 6,698(1.18%)#20 | 1,223,316(0.01%)#872 |
| 21. | Lake Monticello | 76 | 6,698(1.13%)#21 | 1,223,316(0.01%)#902 |
| 22. | Seven Corners | 76 | 6,698(1.13%)#22 | 1,223,316(0.01%)#905 |
| 23. | Centreville | 73 | 6,698(1.09%)#23 | 1,223,316(0.01%)#932 |
| 24. | Cave Spring | 73 | 6,698(1.09%)#24 | 1,223,316(0.01%)#934 |
| 25. | Leesylvania | 72 | 6,698(1.07%)#25 | 1,223,316(0.01%)#943 |
| 26. | Smithfield | 63 | 6,698(0.94%)#26 | 1,223,316(0.01%)#1,018 |
| 27. | Ashburn | 62 | 6,698(0.93%)#27 | 1,223,316(0.01%)#1,028 |
| 28. | Cascades | 52 | 6,698(0.78%)#28 | 1,223,316(0.00%)#1,128 |
| 29. | Burke | 51 | 6,698(0.76%)#29 | 1,223,316(0.00%)#1,136 |
| 30. | Buckhall | 50 | 6,698(0.75%)#30 | 1,223,316(0.00%)#1,150 |
| 31. | Marshall | 47 | 6,698(0.70%)#31 | 1,223,316(0.00%)#1,191 |
| 32. | Mount Sidney | 47 | 6,698(0.70%)#32 | 1,223,316(0.00%)#1,192 |
| 33. | Lorton | 46 | 6,698(0.69%)#33 | 1,223,316(0.00%)#1,200 |
| 34. | Aquia Harbour | 45 | 6,698(0.67%)#34 | 1,223,316(0.00%)#1,219 |
| 35. | Montrose | 40 | 6,698(0.60%)#35 | 1,223,316(0.00%)#1,287 |
| 36. | Moorefield | 39 | 6,698(0.58%)#36 | 1,223,316(0.00%)#1,312 |
| 37. | Rockwood | 38 | 6,698(0.57%)#37 | 1,223,316(0.00%)#1,333 |
| 38. | West Springfield | 35 | 6,698(0.52%)#38 | 1,223,316(0.00%)#1,382 |
| 39. | Meadowbrook | 30 | 6,698(0.45%)#39 | 1,223,316(0.00%)#1,491 |
| 40. | Cherry Hill | 29 | 6,698(0.43%)#40 | 1,223,316(0.00%)#1,514 |
| 41. | Danville | 27 | 6,698(0.40%)#41 | 1,223,316(0.00%)#1,568 |
| 42. | Lansdowne | 26 | 6,698(0.39%)#42 | 1,223,316(0.00%)#1,609 |
| 43. | Newington | 25 | 6,698(0.37%)#43 | 1,223,316(0.00%)#1,639 |
| 44. | Linton Hall | 24 | 6,698(0.36%)#44 | 1,223,316(0.00%)#1,661 |
| 45. | Herndon | 23 | 6,698(0.34%)#45 | 1,223,316(0.00%)#1,686 |
| 46. | Montclair | 23 | 6,698(0.34%)#46 | 1,223,316(0.00%)#1,688 |
| 47. | Tuckahoe | 22 | 6,698(0.33%)#47 | 1,223,316(0.00%)#1,704 |
| 48. | Staunton | 22 | 6,698(0.33%)#48 | 1,223,316(0.00%)#1,708 |
| 49. | Broadway | 21 | 6,698(0.31%)#49 | 1,223,316(0.00%)#1,776 |
| 50. | Franklin Farm | 20 | 6,698(0.30%)#50 | 1,223,316(0.00%)#1,790 |
| 51. | Great Falls | 20 | 6,698(0.30%)#51 | 1,223,316(0.00%)#1,793 |
| 52. | Fort Belvoir | 20 | 6,698(0.30%)#52 | 1,223,316(0.00%)#1,796 |
| 53. | Portsmouth | 19 | 6,698(0.28%)#53 | 1,223,316(0.00%)#1,814 |
| 54. | Petersburg | 19 | 6,698(0.28%)#54 | 1,223,316(0.00%)#1,820 |
| 55. | Sterling | 19 | 6,698(0.28%)#55 | 1,223,316(0.00%)#1,821 |
| 56. | Groveton | 18 | 6,698(0.27%)#56 | 1,223,316(0.00%)#1,863 |
| 57. | County Center | 18 | 6,698(0.27%)#57 | 1,223,316(0.00%)#1,873 |
| 58. | Fairfax | 17 | 6,698(0.25%)#58 | 1,223,316(0.00%)#1,897 |
| 59. | Tysons | 16 | 6,698(0.24%)#59 | 1,223,316(0.00%)#1,935 |
| 60. | Hybla Valley | 16 | 6,698(0.24%)#60 | 1,223,316(0.00%)#1,942 |
| 61. | Huntington | 16 | 6,698(0.24%)#61 | 1,223,316(0.00%)#1,945 |
| 62. | West Falls Church | 14 | 6,698(0.21%)#62 | 1,223,316(0.00%)#2,032 |
| 63. | Radford | 14 | 6,698(0.21%)#63 | 1,223,316(0.00%)#2,036 |
| 64. | Annandale | 13 | 6,698(0.19%)#64 | 1,223,316(0.00%)#2,067 |
| 65. | Blacksburg | 11 | 6,698(0.16%)#65 | 1,223,316(0.00%)#2,158 |
| 66. | Lovettsville | 10 | 6,698(0.15%)#66 | 1,223,316(0.00%)#2,245 |
| 67. | Onley | 9 | 6,698(0.13%)#67 | 1,223,316(0.00%)#2,320 |
| 68. | Mount Vernon | 8 | 6,698(0.12%)#68 | 1,223,316(0.00%)#2,339 |
| 69. | Fort Lee | 8 | 6,698(0.12%)#69 | 1,223,316(0.00%)#2,343 |
| 70. | Bensley | 8 | 6,698(0.12%)#70 | 1,223,316(0.00%)#2,346 |
| 71. | Countryside | 7 | 6,698(0.10%)#71 | 1,223,316(0.00%)#2,395 |
| 72. | Dulles Town Center | 7 | 6,698(0.10%)#72 | 1,223,316(0.00%)#2,406 |
| 73. | Timberville | 7 | 6,698(0.10%)#73 | 1,223,316(0.00%)#2,418 |
| 74. | Lake Barcroft | 6 | 6,698(0.09%)#74 | 1,223,316(0.00%)#2,457 |
| 75. | Bellwood | 6 | 6,698(0.09%)#75 | 1,223,316(0.00%)#2,464 |
| 76. | Manchester | 5 | 6,698(0.07%)#76 | 1,223,316(0.00%)#2,519 |
| 77. | Exmore | 5 | 6,698(0.07%)#77 | 1,223,316(0.00%)#2,540 |
| 78. | Haymarket | 5 | 6,698(0.07%)#78 | 1,223,316(0.00%)#2,542 |
| 79. | Middletown | 5 | 6,698(0.07%)#79 | 1,223,316(0.00%)#2,543 |
| 80. | Midlothian | 4 | 6,698(0.06%)#80 | 1,223,316(0.00%)#2,574 |
| 81. | Kingstowne | 4 | 6,698(0.06%)#81 | 1,223,316(0.00%)#2,575 |
| 82. | Franconia | 3 | 6,698(0.04%)#82 | 1,223,316(0.00%)#2,619 |
| 83. | University Of Virginia | 3 | 6,698(0.04%)#83 | 1,223,316(0.00%)#2,621 |
| 84. | Occoquan | 3 | 6,698(0.04%)#84 | 1,223,316(0.00%)#2,646 |
| 85. | Quantico | 3 | 6,698(0.04%)#85 | 1,223,316(0.00%)#2,654 |
| 86. | Mount Jackson | 2 | 6,698(0.03%)#86 | 1,223,316(0.00%)#2,687 |
Common Questions
What are the Top 10 Cities with the Most Immigrants from Dominican Republic in Virginia?
Top 10 Cities with the Most Immigrants from Dominican Republic in Virginia are:
#1
499
#2
440
#3
277
#4
258
#5
257
#6
251
#7
240
#8
236
#9
235
#10
212
What city has the Most Immigrants from Dominican Republic in Virginia?
Norfolk has the Most Immigrants from Dominican Republic in Virginia with 499.
What is the Total Immigrants from Dominican Republic in the State of Virginia?
Total Immigrants from Dominican Republic in Virginia is 6,698.
What is the Total Immigrants from Dominican Republic in the United States?
Total Immigrants from Dominican Republic in the United States is 1,223,316.