Cities with the Most Immigrants from Dominican Republic in Minnesota
RELATED REPORTS & OPTIONS
Dominican Republic
Minnesota
Compare Cities
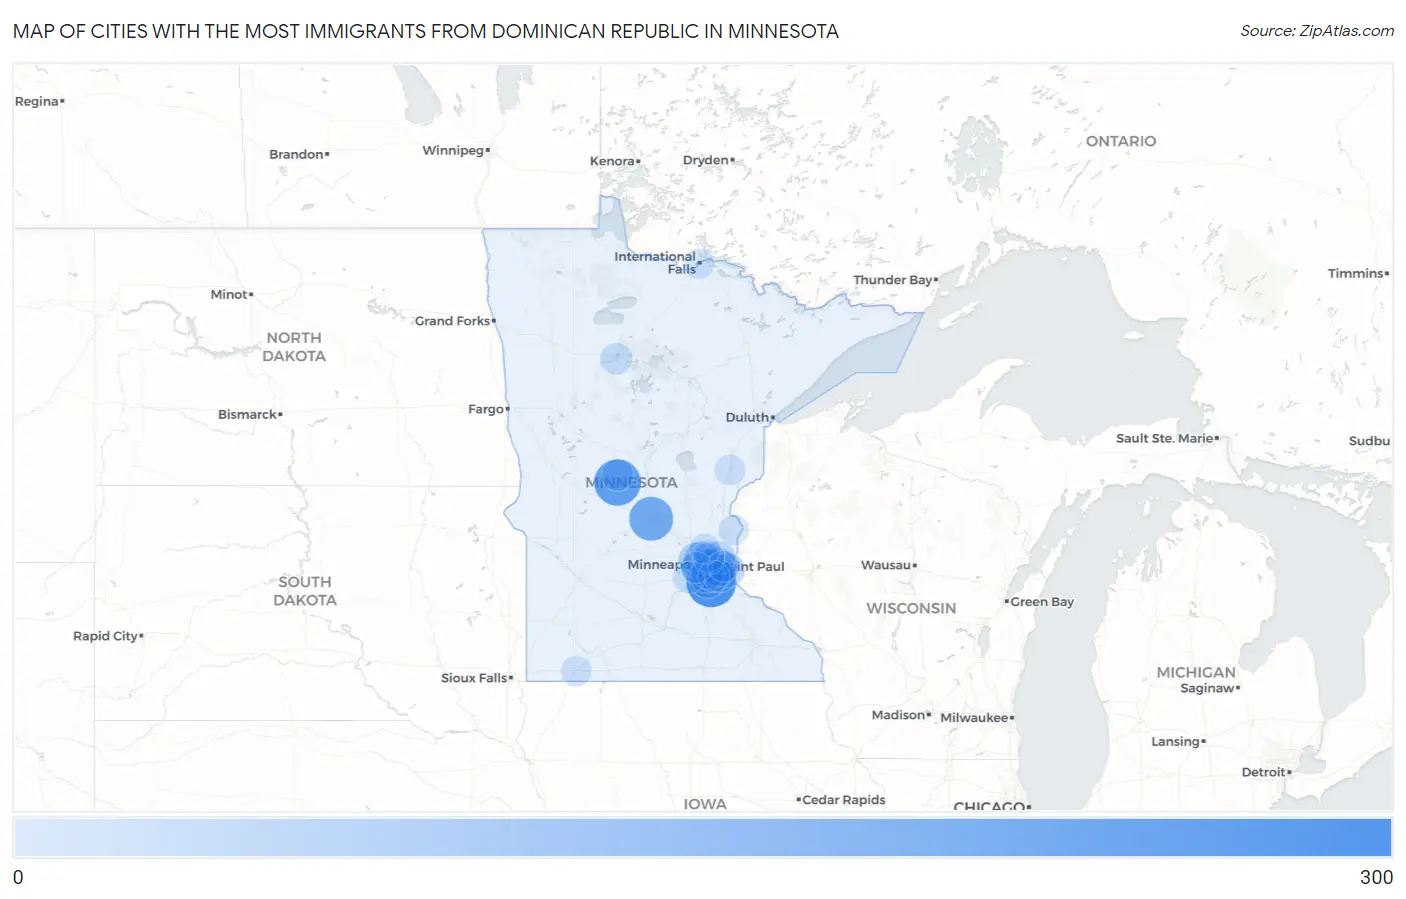
Map of Cities with the Most Immigrants from Dominican Republic in Minnesota
0
300
Cities with the Most Immigrants from Dominican Republic in Minnesota
| City | Dominican Republic | vs State | vs National | |
| 1. | Apple Valley | 285 | 1,665(17.12%)#1 | 1,223,316(0.02%)#340 |
| 2. | Long Prairie | 239 | 1,665(14.35%)#2 | 1,223,316(0.02%)#396 |
| 3. | Waite Park | 201 | 1,665(12.07%)#3 | 1,223,316(0.02%)#453 |
| 4. | St Paul | 125 | 1,665(7.51%)#4 | 1,223,316(0.01%)#644 |
| 5. | Hopkins | 93 | 1,665(5.59%)#5 | 1,223,316(0.01%)#779 |
| 6. | Burnsville | 83 | 1,665(4.98%)#6 | 1,223,316(0.01%)#844 |
| 7. | Plymouth | 70 | 1,665(4.20%)#7 | 1,223,316(0.01%)#955 |
| 8. | New Hope | 61 | 1,665(3.66%)#8 | 1,223,316(0.00%)#1,040 |
| 9. | Woodbury | 58 | 1,665(3.48%)#9 | 1,223,316(0.00%)#1,066 |
| 10. | Minneapolis | 38 | 1,665(2.28%)#10 | 1,223,316(0.00%)#1,317 |
| 11. | Bloomington | 37 | 1,665(2.22%)#11 | 1,223,316(0.00%)#1,344 |
| 12. | Richfield | 33 | 1,665(1.98%)#12 | 1,223,316(0.00%)#1,429 |
| 13. | Vadnais Heights | 33 | 1,665(1.98%)#13 | 1,223,316(0.00%)#1,434 |
| 14. | West St Paul | 28 | 1,665(1.68%)#14 | 1,223,316(0.00%)#1,544 |
| 15. | Inver Grove Heights | 22 | 1,665(1.32%)#15 | 1,223,316(0.00%)#1,705 |
| 16. | Browerville | 22 | 1,665(1.32%)#16 | 1,223,316(0.00%)#1,738 |
| 17. | Chaska | 21 | 1,665(1.26%)#17 | 1,223,316(0.00%)#1,751 |
| 18. | Bemidji | 21 | 1,665(1.26%)#18 | 1,223,316(0.00%)#1,761 |
| 19. | Columbia Heights | 18 | 1,665(1.08%)#19 | 1,223,316(0.00%)#1,859 |
| 20. | Fridley | 16 | 1,665(0.96%)#20 | 1,223,316(0.00%)#1,934 |
| 21. | Minnetonka | 13 | 1,665(0.78%)#21 | 1,223,316(0.00%)#2,066 |
| 22. | Eagan | 10 | 1,665(0.60%)#22 | 1,223,316(0.00%)#2,209 |
| 23. | Landfall | 10 | 1,665(0.60%)#23 | 1,223,316(0.00%)#2,254 |
| 24. | Worthington | 7 | 1,665(0.42%)#24 | 1,223,316(0.00%)#2,390 |
| 25. | Sandstone | 6 | 1,665(0.36%)#25 | 1,223,316(0.00%)#2,478 |
| 26. | Coon Rapids | 4 | 1,665(0.24%)#26 | 1,223,316(0.00%)#2,562 |
| 27. | International Falls | 3 | 1,665(0.18%)#27 | 1,223,316(0.00%)#2,622 |
| 28. | Center City | 3 | 1,665(0.18%)#28 | 1,223,316(0.00%)#2,653 |
Common Questions
What are the Top 10 Cities with the Most Immigrants from Dominican Republic in Minnesota?
Top 10 Cities with the Most Immigrants from Dominican Republic in Minnesota are:
#1
285
#2
239
#3
201
#4
125
#5
93
#6
83
#7
70
#8
61
#9
58
#10
38
What city has the Most Immigrants from Dominican Republic in Minnesota?
Apple Valley has the Most Immigrants from Dominican Republic in Minnesota with 285.
What is the Total Immigrants from Dominican Republic in the State of Minnesota?
Total Immigrants from Dominican Republic in Minnesota is 1,665.
What is the Total Immigrants from Dominican Republic in the United States?
Total Immigrants from Dominican Republic in the United States is 1,223,316.